HAL Id: hal-00299137
https://hal.archives-ouvertes.fr/hal-00299137
Submitted on 31 Jan 2005
HAL is a multi-disciplinary open access
archive for the deposit and dissemination of
sci-entific research documents, whether they are
pub-lished or not. The documents may come from
teaching and research institutions in France or
abroad, or from public or private research centers.
L’archive ouverte pluridisciplinaire HAL, est
destinée au dépôt et à la diffusion de documents
scientifiques de niveau recherche, publiés ou non,
émanant des établissements d’enseignement et de
recherche français ou étrangers, des laboratoires
publics ou privés.
gravitational creep
E. Brückl, M. Parotidis
To cite this version:
E. Brückl, M. Parotidis. Prediction of slope instabilities due to deep-seated gravitational creep.
Natu-ral Hazards and Earth System Science, Copernicus Publications on behalf of the European Geosciences
Union, 2005, 5 (2), pp.155-172. �hal-00299137�
Natural Hazards and Earth System Sciences (2005) 5: 155–172 SRef-ID: 1684-9981/nhess/2005-5-155
European Geosciences Union
© 2005 Author(s). This work is licensed under a Creative Commons License.
Natural Hazards
and Earth
System Sciences
Prediction of slope instabilities due to deep-seated
gravitational creep
E. Br ¨uckl1and M. Parotidis2,*
1Geophysics Department, Vienna University of Technology, Austria 2Geophysics Department, Freie Universitaet Berlin, Germany *now at: Geomechanics International Inc., Mainz, Germany
Received: 20 October 2004 – Revised: 10 January 2005 – Accepted: 17 January 2005 – Published: 31 January 2005
Part of Special Issue “Landslides and debris flows: analysis, monitoring, modeling and hazard”
Abstract. Deep-seated gravitational creep in rock slopes,
rock-flow or sackung is a special category of mass-movement, in which long-lasting small-scale movements prevail. The prime causes of these mass movements in the Alpine area seem to have been glacial retreat at ∼15 000 a B.P. Many sackung stabilize and some undergo the transi-tion to rapid sliding. This paper concentrates on four mass-movements in crystalline complexes of the Austrian Alps which have been investigated for aspects of deep-seated grav-itational creep and prediction of the transition to rapid slid-ing. The present-day extent of the creeping or sliding of the rock mass has been modelled by a process of progressive, stress induced damage. Subcritical crack growth has been assumed to control this process and also the velocity of the mass movement. A sliding surface and decreasing Coulomb stress at this surface as a function of slip is a precondition for instability. The development of the four examples has been modelled successfully by a rotational slider block model and the conception of subcritical crack growth and progressive smoothing of the sliding surface. The interrelations between velocity, pore water pressure, seismic activity and the state of the sliding surface have been derived. Finally we discuss how the hypothesis inherent in the models presented could be validated and used for prediction.
1 Introduction
Deep-seated gravitational creep in rock slopes is a special category of mass-movement, in which long-lasting small-scale movements prevail (e.g. Nemcok et al., 1972); the terms sackung (sagging) and rock-flow have also been used (Zischinsky, 1969; Hutchinson, 1988; Dikau et al., 1996). Typically, slopes involved in deep-seated gravitational creep are ∼1000 m high and the typical thickness and volume of
Correspondence to: E. Br¨uckl
the creeping rock-mass are 100 m and 108m3, respectively. Structural characteristics of saggings are cracks and uphill facing scarps together with trenches in the upper part and bulging in the lower part (Ampferer, 1939; Stini, 1941; Savage and Varnes, 1987; Bisci et al., 1996). Crystalline rocks of a wide range of metamorphic grades may undergo deep-seated gravitational creep; most of these creeping rock-masses have not been significantly altered by weathering and can be described by the rheology of brittle rocks. Deforma-tion has not been restricted to a sliding or a narrow sliding zone but has affected the whole moving rock-mass. Gener-ally, the development of deep-seated gravitational creep has been strongly influenced by the rock structure.
The prime causes of sagging in the Alpine area seem to have been glacial retreat at ∼15 000 a B.P. (Zischinsky, 1969). During the last ice age (W¨urm), the ice surface had an elevation of about 2400 m in the area of the saggings we consider (Husen, 1987). The idea proposed is that glacial erosion over-steepened the valley flanks and after the retreat of the glaciers and the loss of a supporting ice column of about 1000 m height, the creep process started on some val-ley flanks. In the lower part of the slope of the later giant rockslide at K¨ofels, the increase of Coulomb stress was about 8 MPa, at Lesachriegel about 2 MPa (Br¨uckl, 2001). Sub-stantial erosion of the river banks at the toe of the slope may also enhance movement. Another important parameter for slope stability is interstitial water. Rocks may be physically or chemically altered by water. The mechanical effect of in-terstitial water is the reduction of effective stress and fric-tional forces by the pore pressure and a push in the direction of the hydraulic gradient in case the water table is inclined (Jaeger, 1972; pp. 184–187). The tectonic stress field may also have an influence (Gerber and Scheidegger, 1969; Schei-degger, 1970).
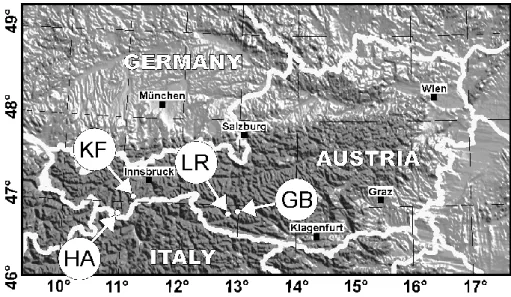
Fig. 1. Location of the mass movements K¨ofels (KF), Lesachriegel (LR), Gradenbach (GB) and Hochmais-Atemskopf (HA).
Table 1. Examples of deep-seated gravitational creep.
Symbol Location Petrology References
KF K¨ofels Granite-gneiss (Augengneiss) Erismann et al. (1977) Heuberger (1994) LR Lesachriegel Gneiss, mica shists and amphibolites Hauswirth et al. (1979) GB Gradenbach Phyllites, calcareous mica shists of the Matreier rock formation Moser and Kiefer (1988)
Gottschling (1999) HA Hochmais-Atemskopf Paragneisses, micaschists, orthogneisses and amphibolites Tentschert (1998)
Br¨uckl et al. (2004b)
Table 2. Area (A), volume (V ), escarpment area (A0) and
aver-age discontinuous displacement (s) on the basal plane of the mass movements KF, LR, GB and HA.
A[km2] V [km3] A0 [km2] s[m] KF 12.9 3.88 11.0 1622 LR 1.10 0.063 1.74 247 GB 1.68 0.121 1.68 40 HA 2.82 0.264 2.83 10
Many sackung persist in creeping and stabilize after the centre of gravity has sagged down 100–200 m (vertical com-ponent of displacement). Representative examples for this behaviour are the Glunzerberg and Nassereiner Alm, Tyrol, Austria (Zyschinsky, 1969; Br¨uckl and Scheidegger, 1972). However, there are also examples of mass movements which started through deep-seated creep but changed to rapid slid-ing. The main aim of this paper is to elaborate a model for a better understanding of both processes and the prediction of the transition to rapid sliding.
2 Examples of deep-seated gravitational creep in rock
This paper concentrates on four mass-movements which have been investigated for aspects of deep-seated gravita-tional creep and the prediction of the transition to rapid slid-ing. The locations of these mass-movements, all of which lie in crystalline complexes of the Austrian Alps are shown in Fig. 1. Brief petrological characterizations and references to geological and geomorphological descriptions have been compiled in Table 1. The possible influence of foliation and pre-existing joint sets on the generation of the mass move-ments will be discussed, together with the orientation and shape of the basal surface of the mass movements (Sect. 3).
Structural models of creeping rock-masses have been con-structed at K¨ofels (KF) (Br¨uckl et al., 2001), Lersachriegel (LR) and Gradenbach GB (Br¨uckl and Br¨uckl, submitted, 20041 and HA (Br¨uckl et al., 2004b). The thicknesses of the mass-movements have been derived from a combination of refraction seismic measurements (at KF also reflection seismic measurements) and all the available direct evidence
1Br¨uckl, E. and Br¨uckl, J.: Geophysical models of
the Lesachriegel and Gradenbach deep-seated mass-movements (Schober range, Austria), submitted to Eng. Geology, 2004.
E. Br¨uckl and M. Parotidis: Prediction of slope instabilities 157
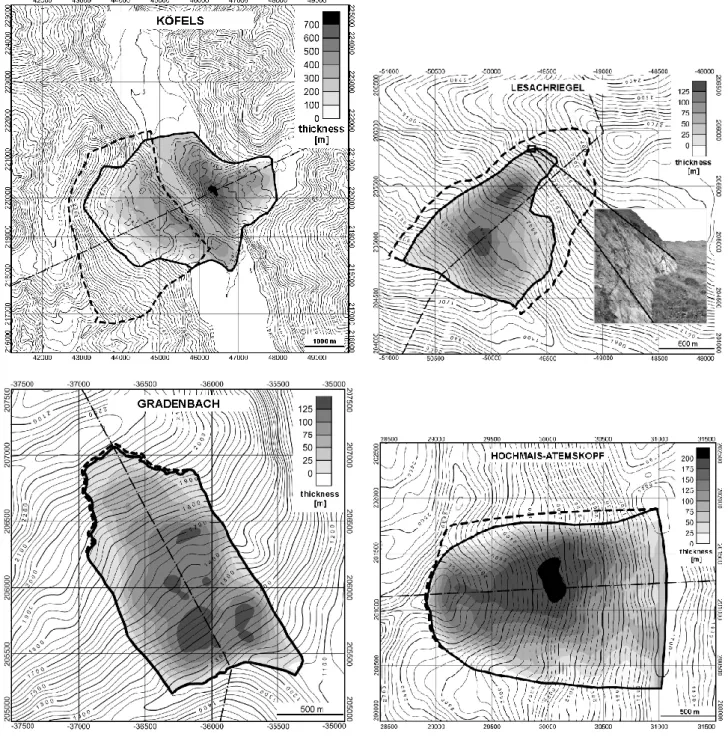
Fig. 2. Topography (contours from digital elevation model), boundaries (solid lines) and escarpment area (dashed lines) of the mass
move-ments (a) KF, (b) LR, (c) GB, (d) HA. The thicknesses are superimposed in grey scale. The locations of the cross sections later shown in Fig. 5 are also marked (dash-dotted). A picture of the scarp generated in 1965 on LR is inserted into Fig. 2b.
from boreholes and galleries. Representative examples of re-fraction and reflection profiles from KF, LR, GB and HA may be found in the references given above. Figures 2a–d show the digital terrain models, the boundaries of the mov-ing rock-masses, the escarpment areas and the thicknesses of the mass-movements. In Table 2, values of the present day area and volume of the mass-movements have been com-piled. Furthermore, the distance of discontinuous sliding along the basal surfaces has been derived from the extent of
the scarps at the uphill end of the mass-movements and from the estimated overthrusting at the fronts (toes).
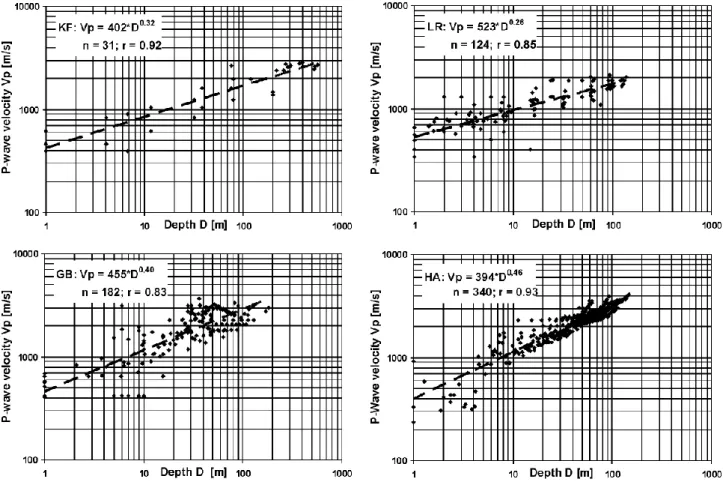
A significant relationship has been found between the P-wave velocity (Vp) of the creeping rock-mass and the depth below the surface (D), measured normal to the dip of the average slope (Br¨uckl and Parotidis, 2000; Br¨uckl et al., 2004b). In establishing this relationship, the P-wave veloci-ties have been reduced to dry conditions, using Gassmann’s relation (Gassmann, 1951), in places where water saturation
Fig. 3. Relations between longitudinal seismic velocity (reduced to dry conditions) versus depth of overburden of the mass movement with
the resulting exponential trend lines, the number of data points and the correlation coefficients, (a) KF, (b) LR, (c) GB, (d) HA. probably occurred. At KF, the water table has been
corre-lated with a refractor about 10 m below the river bed and, at HA, with the water level of the hydroelectric power reser-voir bordering the mass-movement at the toe of the slope. At GB, Moser and Kiefer (1988) report a shallow water table in the lower part of the slope in 1979. Vp data from a seis-mic campaign in that year has been reduced to dry conditions using this information. On LR, there is no information about the water table and no reductions have been performed. Fig-ures 3a–d show the log-log relationships between Vp and D, together with the resulting trend lines, the number of data points and the correlation coefficients. The porosity of the moving rock-mass was estimated from the reduced seismic data using the relationship given by Watkins et al. (1972).
The present-day activity of the four mass-movements un-der consiun-deration are quite different. In the 18th century, KF became famous when pumice was found at a sliding plane (Erismann et al., 1977; Erismann, 1979), resulting from fric-tion along the sliding plane causing temperatures of over 1700◦C to be generated; this was confirmed by laboratory experiments. According to the kinematic model of Erismann et al. (1977), no further sliding or has taken place since this event, which has been radiocarbon dated (calibrated to cal-endar years) to 9600 years B.P. It has been assumed here that a phase of deep-seated gravitational creep, during which the sliding plane developed, preceded the rapid rock-slide.
In 1965, during a period of high precipitation and severe floods, the whole sackung at LR slipped, producing a scarp with about 3 m horizontal displacement which can still be clearly seen today (see picture inserted in Fig. 2b). Geodetic measurements (Hauswirth et al., 1979) after this slip event have demonstrated that the mass-movement has decelerated to low creep velocities (∼0.01 m/a). As a result, it is difficult to choose a mean creeping velocity of the present-day move-ment. The slip of 3 m in 1965 is here assumed to account for the total movement during 50 years.
For GB, much more observational data is available, since this slope has been under geodetic and geotechnical con-trol for more than 30 years. Strong movements during the period of high precipitation which caused the slip at LR, resulted in catastrophic debris flows at GB. High displace-ment rates of ∼6 m/year were also observed during 1974– 1975 (Kronfellner-Kraus, 1980). Weidner et al. (1998) re-ported horizontal displacements of 11.9 m in the upper part of the sagging mass and 7.4 m in the toe zone, for the period 1969 to 1991. From 1999 to 2003, an average creep rate of 0.3 m/year has been observed at 4 GPS stations distributed over the whole slope (Brunner et al., 2003). During the sum-mer of 2001, a phase of accelerated movement, with a creep rate of 0.2 m/month, was observed. The most significant av-erage values have been deduced from recent photogrammet-ric evaluations for the years 1962 and 1996 (Br¨uckl et al.,
E. Br¨uckl and M. Parotidis: Prediction of slope instabilities 159
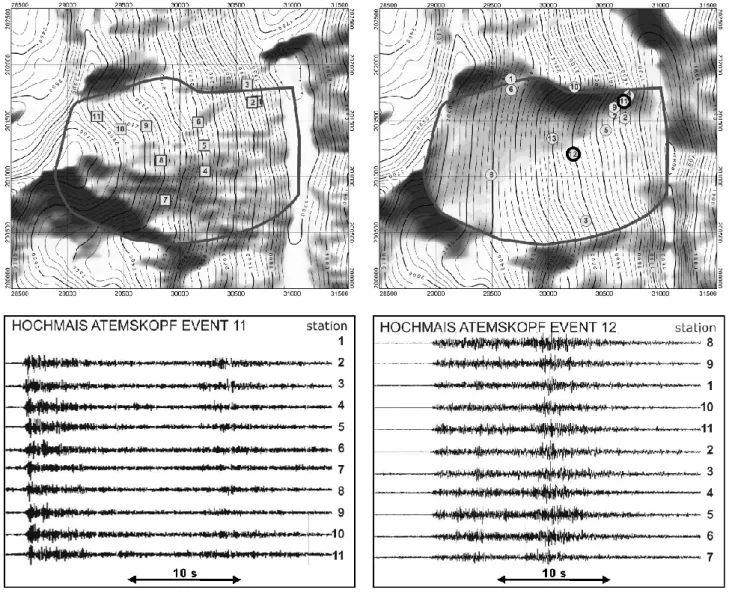
Fig. 4. Seismic monitoring at HA; (a) Location of 12 seismic monitoring stations (rectangles with station number); (b) 12 epicentres of
seismic events detected during 3 days (circles with event number); (c) seismograms of event 11, traces with station numbers; (d) seismograms of event 12, traces with station number.
2004a). For this period, the average horizontal displacement was 0.6 m/year. In the upper part of the slope, the displace-ments were slightly higher than in the lower part, although generally the displacements were remarkably uniform.
HA has been under geodetic and geotechnical control for the last four decades. The importance of these investiga-tions is a consequence of the hydroelectric power reservoir (140 million m3)bordering the mass-movements (Tentschert, 1998). Several scarps define individual sliding slabs; the ve-locity of the most active slab is 30–40 mm/year at the surface and about 25 mm/year at its base. In the upper part of the slope, the creep rates drops to <6 mm/year. A creep rate of 10 mm/year has been assumed to be representative for the present-day activity of the whole creeping rock-mass.
The creeping rock-masses of the four examples presented here have deformed in a brittle fashion. Therefore, it is ex-pected that seismic events have accompanied the deforma-tion processes. Seismic monitoring has been started on LR
and GB; up to now, the total observation time for both mass-movements has been about one month, with a maximum of 10 monitoring stations deployed simultaneously (Br¨uckl et al., 2003). Examples of seismograms, together with the lo-cations of the monitoring stations and the epicentres at HA are shown in Fig. 4. The 13 events for which the epicentres are shown in Fig. 4 have been observed within 3 days, the shortest time interval between the events was 8 min (between event 8 and 9), the longest 13 h (between event 4 and 5). Seismic moments have been estimated from the recordings using a relationship with maximum ground velocity and dis-tance (McGarr and Bicknell, 1990). These seismic moments were converted to moment magnitudes (MW) by the relation of Hanks and Kanamori (1979). MW varies from −1.5 to 0.7 and has an average value MW=−0.4. On GB, 16 seismic events of similar frequency content, duration and magnitude have been observed during a period of 12 days.
Fig. 5. Representative cross sections through the mass movements with actual surface, basal plane and reconstructed pre-failure surface for (a) KF, (b) LR, (c) GB, (d) HA. The location of these cross sections is marked in Fig. 2.
3 Primary phase of deep-seated gravitational creep in rock
A remarkable observation at all four examples of deep-seated gravitational creep in rock studied here is that there were no pre-existing geological discontinuities or planes of weak-ness which constituted the basal sliding surface. The foli-ation of the granite-gneiss (Augengneiss) at KF is of low mechanical significance and Erismann et al. (1977) did not consider the anisotropy during their experiments on friction and rock melting. At LR, the foliation dips steeply (∼75◦)to S (Hauswirth et al., 1979), much steeper than the basal sur-face. At GB (Moser and Kiefer, 1988) and HA (Br¨uckl et al., 2004b), the dip direction of the foliation is about normal to the dip of the sagging slopes. On LR, GB and HA, joint sets have been observed by the authors referenced before, which support the development of a creeping rock mass but do not directly serve as basal surface or sliding plane. Therefore, it has been assumed that the primary phase of deep-seated gravitational creep comprises the development of the creep-ing rock-mass by processes discussed later.
3.1 Reconstruction of the pre-failure topography
Before trying to model the primary phase, the pre-failure to-pography had to be reconstructed. This has been done for KF, LR and GB in 3-D, taking into account the conserva-tion of mass, the dilaconserva-tion accompanying the disintegraconserva-tion of the creeping rock-mass, the surrounding morphology and the gradient of the slope in the direction of the movement (Br¨uckl, 2001; Br¨uckl and Br¨uckl, submitted, 20041). A sim-ilar reconstruction has been carried out for HA in 2-D along the presumed centre flow line (Br¨uckl et al., 2004b). Fig-ures 5a–d show cross-sections through the mass-movements,
indicating the present-day and pre-failure topographies and the base of the moving rock-masses. These cross-sections have been input into the model of the primary phase.
3.2 Numerical modelling of progressive damage
One approach to model mass-movements is to use all the available geomorphological and geological information to construct the model. Thus existing faults, cracks, and other structures have been defined as input, and, with a model, stress and strain have been calculated (e.g. Castillo, 1997; Savage et al., 2000; Kreuzer and Hinteregger, 2001; Eber-hardt et al., 2004). In contrast to these approaches Savage and Varnes (1987) used a homogenous and isotropic elastic medium without any geological structure in order to calcu-late the state of stress. They were able to model significant morphological features of gravitational spreading of steep-sided ridges by the introduction of plastic yielding according to the Mohr-Coulomb criterion.
In this study, numerical modelling was started also from a homogeneous and isotropic elastic rock material which we term compact in its initial state. The term “compact” should not be understood in a rock-mechanical sense (high strength, few joints); it has been chosen to make a clear difference to the creeping rock-mass, which in a mineralogical sense, is the same as the compact rock-mass, but has been entirely damaged by new fractures. Damage takes place in zones of the model where a stress yield criterion has been satisfied. The damage has been numerically modelled by a reduction of the shear modulus. Additionally a dilatation corresponding to an average dilation angle of ∼5◦has been simulated by in-creasing a virtual temperature of the damaged rock material. After applying damage to the zones where the yield criterion has been satisfied, the model is no longer homogenous and
E. Br¨uckl and M. Parotidis: Prediction of slope instabilities 161
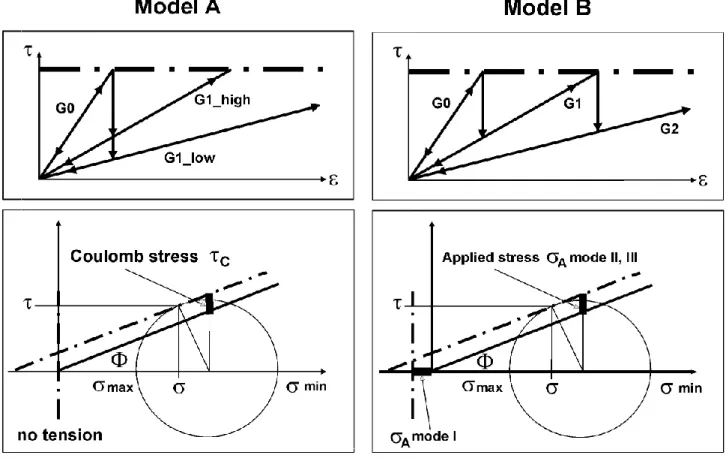
Fig. 6. Stress-strain diagrams for stress induced damage (above) and yield stress criteria in Mohr’s circles (below). (a) Model A – single
damage: The steepest stress-strain path corresponds to the shear modulus G0 of the compact rock, the middle stress-strain path to the shear modulus G1 high of the least damaged rock and the most gentle to the shear modulus G1 low of the most damaged rock. (b) Model B – multiple damage: Again the steepest stress-strain path corresponds to the shear modulus G0 of the compact rock. The first damage reduces the shear modulus to G1, a second to G2 and so on (not shown in the diagram).
the state of stress must be recalculated. The lower shear mod-ulus in the damaged zones causes a redistribution of stress and new zones satisfy the yield criterion and undergo further damage. The development of a creeping (damaged) rock-mass on an originally homogenous and compact (in the sense defined before) rock slope can be modelled by the repeated recalculation of the state of stress and the application of dam-age. The difference to numerical modelling based on plastic yielding is that the changing elastic properties of the rock ma-terial, due to damage, control the progressive development of the creeping rock-mass and not the development of a zone of plastic yielding. The method presented here implies repeated numerical calculations of the elastic state of stress which al-ways deliver a stable solution. On the other hand, only elas-tic deformation has been considered. Therefore, the method should only be used to model the initial phase of deep grav-itational creep, during which the creeping rock-mass devel-ops, and not larger displacements in a later phase.
In earlier investigations (model A) concentrating on KF, LR and GB (Br¨uckl and Parotidis, 2001; Parotidis 2001), the yield criterion was defined by no-tension and Mohr-Coulomb failure criteria (Fig. 6a) where damage happened only once and the degree of damage was selected in order to
quali-tatively model the dependence of the shear modulus with depth, inferred from the seismic results. The values of the damage factor (k) applied to the shear modulus varied in the interval 1/4≤k≤1/160 with the lowest values applied to the damaged rock material at the surface. The steepest stress-strain path in Fig. 6a corresponds to the shear modulus G0 of the compact rock, the middle stress-strain path to the shear modulus G1 high of the least damaged rock and the most gentle to the shear modulus G1 low of the most dam-aged rock. Deformation along these stress-strain paths is re-versible but the transition from the compact to the damaged state is irreversible.
In subsequent numerical studies on GB and HA (model B), the maximum applied stress (σA)for fracture modes I (opening), II (sliding) and III (tearing) was used as a stress yield criterion (Fig. 6b). For a definition of the fracture modes and the applied stress σA see, for example, Lawn (1993, pp. 24, 31). Furthermore, and in contrast to model A, the modelling allowed for multiple damage when the ap-plied stresses repeatedly reached the yield criteria in dam-aged zones. The damage factors k=1/4, 1/8, 1/16 and 1/32 were successively applied. As in Fig. 6a, the steepest stress-strain path in Fig. 6b corresponds to the shear modulus G0 of
Table 3. Compressional (K) and shear modul (G) and angle of internal friction (8) used for damage modelling of KF, LR, GB and HA; the
average Coulomb stress (τC)and the average applied stress (σA)follow from the application of damage model A or B.
KF LR GB HA K[Pa] 2.15×10¹⁰ 1.53×10¹⁰ 1.58×10¹⁰ 1.67×10¹⁰ G[Pa] 9.92×10⁹ 3.28×10⁹ 7.27×10⁹ 7.69×10⁹ 8[◦] 28 29 25 25 τC[Pa] 2.1×10⁶ 0.5×10⁶ 0.4×10⁶ – σA[Pa] – – 0.4×10⁶ 0.5×10⁶
the compact rock. The first damage reduces the shear modu-lus to G1 (=G0/4), a second to G2 (=G0/8) and so on. Again, deformation along these stress-strain paths is reversible but the transition from a less to a more damaged state is irre-versible. The stress-strain paths shown in Figs. 6a and b are similar to those obtained from analytical models of the rela-tionship between damage (crack growth) and elastic modulus (see Fig. 8 in Segall, 1984).
Laboratory experiments (Rao et al., 1999) have indicated that fracture toughness is approximately two to three times larger for fracture mode II than for mode I. Therefore, the most realistic yield criterion for tensional stress should be found between the no-tension criterion (model A) and the assumption of equal applied stress for all fracture modes (model B).
The elastic state of stress has been calculated by elastic 2D-FEM (Finite Element Method) calculations for the cross-sections of the pre-failure topography shown in Figs. 5a– d. The models used for the FEM-calculation were of much larger spatial extent, in order to avoid boundary effects. The input parameters of the models were the modulus of elasticity (E), the shear modulus (G), the angle of internal friction (8), and the damage factor (k). For model A, damage was applied to all elements with tensional stress and a definite number of elements with the highest value of the Coulomb stress. For model B, damage was applied to a definite number of ele-ments with the highest values of σA(either mode I, mode II, or mode III). Thereafter, for both models, the elastic state of stress was calculated again and the procedure repeated. This repeated damaging of the elements with the highest loading generated a fractured zone of comparable size and shape to that of the real mass-movement. The parameters were ad-justed by trial and error in order to fit the observed cross-section of the creeping rock-mass. An additional degree of freedom came from assumptions concerning the water table; as described earlier (reduction of P-wave velocities from wa-ter saturated to dry conditions) only few constraints are avail-able for this important parameter for the present-day situa-tion and we are confronted with further uncertainties using this information to describe the water table during the ini-tial phase of the mass movements. As pointed out before the models used for the FEM-calculation were of much larger spatial extent, in order to avoid edge effects. However, the area where the damaging procedure was applied had to be
restricted to the areas shown in Figs. 7a–j. Otherwise, dam-age would have happened on other, apparently stable slopes. This was probably a consequence of disregarding the struc-tural rock properties of the different slopes.
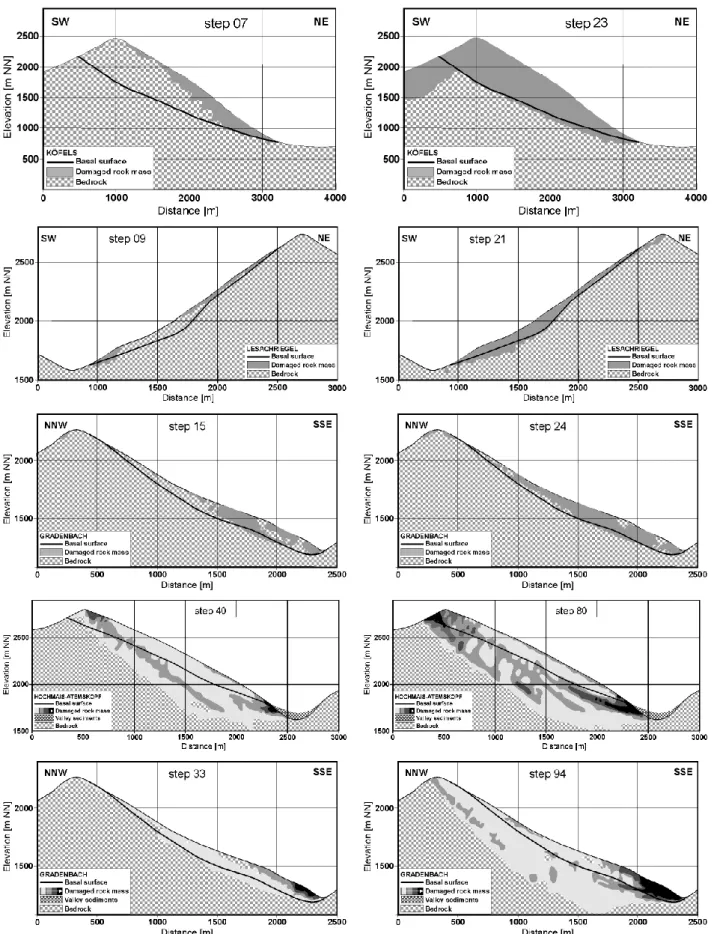
The results from model A for KF, LR, and GB which best fitted the cross-sections of the creeping rock-mass have been shown in Figs. 7a–f. Preliminary results for model B (GB and HA) have been shown in Figs. 7g–j. The input parame-ters for have been compiled in Table 3. The density was kept constant with d=2600 kg/m3. For the application of model A to KF, LR and GB (Figs. 7a–f), parameters have been found which gave satisfactory fits to the observed base of the mass-movement and the extent of the damaged zone as calculated previously. The numerical modelling was most sensitive to the angle of internal friction 8. The preliminary results of the application of model B to GB and HA show clearly the development of a damaged zone which could develop into a sliding surface. However, this zone is deeper than the ob-served basal surface and further modelling efforts are neces-sary in order to achieve a better fit. An increase of the angle of internal friction from 8=25◦to 8=26◦ resulted in a re-duction of the applied stresses σA from an average value of 0.5 MPa to values <0.1 MPa. We took σA<0.1 MPa as an indication that the process of progressive damage would not develop. Both models A and B confirm the conclusion that 8is well constrained.
As pointed out before, in both models A and B, the value of the yield stress (Coulomb stress, τC, or applied stress, σA)was not defined in advance; it was chosen in order to maintain the process of progressive damaging of a definite number of elements for each iteration. The last two rows in Table 3 show the average values of the highest Coulomb or applied stresses for all successive iterations. These values define the magnitude of the stress necessary to maintain an ongoing damage process.
3.3 Comparison of model parameters with results from rock mechanical testing
Essential for comparing the model data with the results from rock mechanical testing is the assumption that the creeping rock has been generated from an originally compact rock by a process of progressive stress induced damage. As pointed out in Sect. 3.2, the term “compact” was chosen to make
E. Br¨uckl and M. Parotidis: Prediction of slope instabilities 163
Fig. 7. Development of the zone of damaged rock after consecutive steps of progressive damage: (a) and (b): KF at steps 7 and 23; damage
model A (c) and (d): LR at steps 9 and 21; damage model A (e) and (f): GB at steps 15 and 24; damage model A (g) and (h): GB at steps 33 and 94; damage model B (i) and (j): HA at steps 40 and 80; damage model B
a difference to the creeping rock mass and not to exclude pre-existing joints and fractures. Alteration of the mechani-cal properties of the rock material by weathering or similar processes has been excluded. The results of the numerical models deliver values for the angle of internal friction be-tween 25◦ and 29◦. Generally, published values for crys-talline rock are higher than 35◦or even 40◦(Jaeger, 1972), although in environments of very high differential stresses or normal stresses, lower values of 8 can be expected. Hen-dron (1968) has given an example of a gneiss where, for dif-ferential pressures over 35 MPa, the corresponding value of 8dropped from 43◦to 28◦. A similar decrease in the angle of friction at high pressure can also be seen in Byerlee’s law (Byerlee, 1978), which describes the strength of faults based on laboratory results, independent of rock type, and accord-ing to the normal stress σ :
for σ <200 MPa (appr. 6 km depth) τ =σeff×0.85 [MPa] for σ >200 MPa τ =50+σeff×0.60 [MPa]
These equations estimate the angle of friction with 8∼40◦ and for higher values of σ , with 8∼31◦. Both Byerlee’s law and the tests reported by Hendron (1968) demonstrate that for high normal pressures, the angle of friction is within or at least near the range of the values which have been found for 8by the modelling described in this paper.
Another parameter of the model is the value of Coulomb stress τCor applied stress σAat which damage has been in-troduced. For the investigated cases, the average Coulomb stresses of the finite elements subjected to damage were in the range of 0.4–2.1 MPa (Table 3). This range is signifi-cantly lower than the corresponding values coming from the example given by Hendron (1968) or from Byerlee’s law. They are also clearly less than the typical values for rock strength. For example, Attewell and Farmer (1976) gave a tensile strength of 7–25 MPa and a shear strength of 14– 50 MPa for granite. In summary, the applied stresses for in-ducing damage in our model are significantly lower than the corresponding empirical geomechanical values for compact crystalline rocks. It has been assumed that even favourable conditions for the stress induced damage could not close this gap. If Coulomb or applied stresses for damage in the models are significantly lower than measured values for damage, this could appear to invalidate the model. Therefore, we consider subcritical crack growth in the next section.
4 Subcritical crack growth
In the previous sections, it has been demonstrated that the Coulomb stress (τC)or the applied stress (σA)derived from the model have much lower values than would be expected from geomechanical testing. For this reason, critical crack growth under stresses corresponding to the fracture tough-ness could not have been the process controlling the devel-opment of the creeping rock-masses. Other processes must, therefore, have been responsible for crack growth and dam-age at a lower stress level. As the time-scale for the gen-eration of deep creep is in the order of 1000–10 000 years
these processes may be very slow. Note that the present day average creep velocity is not representative of the whole pro-cess, which was initiated – according our assumption – after the retreat of the ice age glaciers 15 000 a B.P. In the follow-ing section, subcritical crack growth has been assessed as a possible mechanism, as suggested by Br¨uckl and Parotidis (2001).
4.1 Phenomenon of subcritical crack growth
Subcritical crack growth enables material to degrade at stresses well below the material strength. This theory, which is based on fracture mechanics principles (Atkinson and Meredith, 1987), describes the velocity of crack growth by a stress intensity factor (Kn)and the fracture toughness (Kc). The stress intensity factor, Kn, where n=I, II or III according to the failure mode, represents the magnitude of the stress field at the crack tip (Lawn, 1993, p. 24). Two constitutive laws for crack growth have been defined; the equilibrium law and the kinematic law. The equilibrium law specifies that cracks begin to grow when a critical value of the stress in-tensity factor has been reached, which is called the fracture toughness (Kc). When Kn≥Kc, the crack growth velocity may reach the S-wave velocity of the material. The kinematic law states that for certain subcritical stress values (values smaller than the material strength) a crack growth velocity develops which is a function of the applied stress. Subcritical crack growth is valid for Knvalues greater than a lower limit (K0), which is suggested to be as low as ∼0.2 Kc (Atkin-son and Meredith, 1987). There is a power law relationship between crack growth velocity and Kn for Kn>K0. This
relationship holds up to values of Kn∼0.8 Kc. In the inter-val 0.8 Kc<Kn<1.0 Kc, no further increase in crack growth velocity takes place, until dynamic rupture starts at Kn=Kc. The characteristic features of subcritical crack growth are summarized in Fig. 8.
The crack growth velocity can be significantly affected by the presence of agents such as fluids. An important exam-ple of subcritical crack growth is crack growth due to the chemical interactions between the crack tip and the environ-ment. The phenomenon of chemical degradation because of environmental agents has been termed stress corrosion. In the range where the power law relationship between crack growth velocity and Kn holds, the crack growth velocity is controlled by the rate of corrosion reactions at the crack-tip. In the interval 0.8 Kc<Kn<1.0 Kc, the crack growth veloc-ity is controlled by the transport rate of reactive substances to the tip. Therefore, in this phase the crack growth velocity no longer depends on Knand the applied stress. At Kn≥Kc dynamic fracture takes over as the controlling mechanism of the process, which is relatively insensitive to the chemical environment.
4.2 Subcritical crack growth and creep velocity
As outlined above, subcritical crack growth is relatively well understood and has been confirmed by laboratory
E. Br¨uckl and M. Parotidis: Prediction of slope instabilities 165
investigations. Thus, it is reasonable to accept this process as a candidate for the process which allows for progressive damage and deformation of a previously compacted rock-mass at a low stress level. A physical model relating pro-gressive damage to deformation rate and creep velocity has not been established here. We assume a proportionality be-tween the overall creep rate and the velocity of crack growth. This simple assumption may be justified if continuing defor-mation does not take place only by sliding and rolling but is controlled by the generation and growth of cracks and frac-tures. For a particular mass-movement, the creep velocity (V el) is defined at the centre of gravity.
As summarized above, there is a power law relation-ship between crack growth velocity and Kn in the inter-val 0.2 Kc≤Kn≤0.8 Kc. Laboratory experiments on granite, summarized by Meredith and Atkinson (1987), show that this exponent has a value of about 8 or higher. For further con-sideration, the value 8 has been taken here. We disregard the influence of the changing length of the cracks which have to grow in order to maintain deformation. In this case, σA is proportional to Kn and the following relationship for the creep velocity (V el) has been formulated:
V el ∝ σA8 (1)
Disregarding a systematic change in the crack length may be justified to some extent if the remaining compact parts of the rock are considered to be the obstacles controlling the de-formation rate. However, we will later introduce a smoothing of the sliding surface (or zone) which can also account for the systematic growth of cracks in this zone.
In the primary phase of deep-seated gravitational creep, the whole volume undergoing creep has been damaged. The second phase of deep-seated gravitational creep is charac-terized by the concentration of shear into narrow zones and finally surfaces, especially the basal surface. Deformation concentrates along this surface and asperities are destroyed or smoothed, also by subcritical crack growth. This smooth-ing of the slidsmooth-ing surface has been observed and corresponds to the mechanism responsible for the reduction of the angle of friction in Byerlee’s law for high normal pressures. Exam-ples of slickensides have been seen, for example, on the 1965 generated scarp at LR (see picture inserted in Fig. 2b). Other smooth and remarkably planar sliding surfaces have been ob-served for example near HA (Br¨uckl et al., 2004b) and at KF (Erismann et al., 1977).
Continued smoothing of the sliding surface reduces the ap-plied stress σAover an increasing part of this surface. Con-sequently, stress concentrations will be generated at the re-maining asperities, and the stress concentration factor (SC) has been introduced to account for this phenomenon. The relationship for the creep velocity during the second phase is then:
V el ∝ (SC × σA)8 (2)
Again, this relationship is linked to the movement of the centre of gravity. For the primary phase, SC=1. Friction on
Fig. 8. Schematic diagram for fracture mode I crack growth because
of stress corrosion (after Atkinson and Meredith 1987); Kcis the fracture toughness for mode I, K0is a lower threshold of the process on subcritical crack growth.
the sliding surface may also be reduced by the generation of a breccia and fault gouge. This effect can also be modelled by Eq. (2); in this case, SC should not be interpreted as a stress concentration factor, but as a factor considering the increase of the Coloumb stress because of the reduction of the angle of friction.
In the next step, the creep velocity is quantitatively related to the applied stress (SC×σA). As discussed above, subcriti-cal crack growth occurs when the applied stress corresponds to stress intensity factors in the range of 0.2 to 1.0 Kc. The power law relation holds between about 0.2 Kc and 0.8 Kc. Assuming V el=0.001 m/year at SC×σA corresponding to 0.2 Kc, the creep velocity at an applied stress corresponding to 0.8 Kcwould be V el∼0.2 m/d. If this power law relation-ship held for the whole range of subcritical crack growth, then the creep velocity at the transition to dynamic rupture would be V el∼1 m/d. The highest observable creep rates in the regime of subcritical crack growth should be ∼0.2 m/d. Such high creep rates could describe accelerations which look like stick-slip at a low temporal resolution. Although the highest creep velocities (last phase of accelerating creep before rupture) reported for the Vajont rock-slide two years before the catastrophic rupture in 1963 were 0.08 m/d (Eris-mann and Abele, 2001), it may be justifiably speculated that during the last hours before the catastrophe, the velocity was significantly higher.
5 Secondary phase of deep-seated gravitational creep in rock
By modelling the primary phase of deep-seated gravitational creep in rock, it has been found that Coulomb stress or applied stress is far too low to initiate dynamic rupture.
Fig. 9. Geometry of rotational slider block model. Rg: Radius
pointing from the axis of rotation to the centre of gravity of the slider block; Rs: Radius of the sliding surface; α0: Start angle be-tween the plumb line and Rg; α1: Angle bebe-tween the plumb line and Rg at rupture (KF) or at present day (LR, GB, HA).
Subcritical crack growth has been introduced as a process which allows crack growth, and therefore creep, even under a low stress regime. As mentioned before, the secondary phase of deep-seated gravitational creep has been characterized by the concentration of shear into a narrow basal zone or a basal sliding surface. According to the model proposed here, as-perities on the sliding surface are progressively smoothed, resulting in a stress concentration at the remaining ties. Through this process, the applied stress at the asperi-ties increases progressively up to the value at which the frac-ture toughness is reached at all asperities. At this moment, the transition to dynamic rupture of the whole slope takes place. Other processes leading to higher stress concentra-tions and crack growth velocities are a systematic increase of the crack length in the shear zone and/or the alignment of cracks in directions favouring crack propagation. For sim-plicity, all these processes have been summarized under the term “smoothing of the basal surface”.
The concept and model of progressive smoothing pre-sented here seems at a first sight to be a simplification of the Dieterich-Ruina law, which models the development of the coefficient of friction in terms of a state variable and the sliding velocity. The Dieterich-Ruina law has achieved great importance in earthquake modelling and prediction (Scholz, 2002). An asymptotic solution of this law results in a pre-diction of the time of failure by a linear extrapolation of the inverse of the velocity to zero (Voight, 1988, 1990). Gen-eral solutions of the law have been applied successfully to the catastrophic Vajont rockslide and the La Clapiere
mass-Table 4. Parameters of the rotational slider block model; for the
description of the parameters see Fig. 9 and the Appendix.
Rg[m] Rs[m] 8[◦] α0[◦] α1[◦] V el1 [m/a] KF 6497 6786 28 30.2 29.6 365 LR 4418 4462 29 30.9 27.7 0.06 GB 5178 5242 25 27.6 27.2 0.6 HA 15550 15630 25.5 28.4 28.4 0.01
movement (Helmstetter et al., 2004). However, the differ-ence between these applications of the Dieterich-Ruina law and the approach presented in this article is that the develop-ment of the Coulomb stress at asperities (or apparent cohe-sion) is modelled here and the coefficient of friction (or angle of internal friction) is kept constant.
Continuing slip of the landslide body along the basal slid-ing surface may also result in lower gravitationally-induced stresses, because of the decreasing average slope angle. If this influence dominates, the creep process may effect a sta-bilisation of the slope. In the following section, the competi-tion between these two processes by a geo-mechanical model have been described.
5.1 Rotational slider block model
A simple rotational slider block has been chosen to model the smoothing of the sliding surface and the change in grav-itational stresses due to the rotation. The geometry of the model has been shown in Fig. 9. A description of all vari-ables and parameters have been given in the Appendix. Ap-plied stress can be replaced by Coulomb stress for a slider block model as both quantities are identical for shear mode failures. The Coulomb stress τC(α, q) at the asperities on the sliding surface for arbitrary α (angle between the plumb line and the radius pointing from the axis of rotation to the cen-tre of gravity of the slider block) and q (ratio between pore water and overburden pressure at the sliding plane), has been derived in the Appendix (Eq. A6). The stress concentration at asperities due to the smoothing of the sliding surface has been modelled by a stress concentration factor (SC) increas-ing exponentially with displacement on slidincreas-ing surface (Ap-pendix: Eq. A5). The creep velocity is given by Eq. (2) and has been formulated as a function of α and q in the following way (Appendix: Eq. A8):
V el(α, q) = V el1 × (τC(α, q)/τC(α1, q))8 (3) The numerical values of the parameters necessary to cal-culate Coulomb stress and velocity have been compiled in Tables 2, 3 and 4. The quantities V el1 and α1 are the values for velocity and α at rupture (KF) or at the present (LR, GB, HA). The values of α1, corresponding to a discontinuous dis-placement of 80 m, and V el1=1 m/d are assumptions for KF. The value s=1622 m given for KF in Table 2 is the present day discontinuous displacement after the rapid sliding phase
E. Br¨uckl and M. Parotidis: Prediction of slope instabilities 167
and is not relevant for the considerations here. A density of d=2200 kg/m3has been chosen for the creeping rock-mass.
According our assumption the initial phase of the mass-movement started just after glacial retreat at 15 000 a B.P. At KF, the instability occurred at 9800 a B.P. and the devel-opment of the mass-movement ended at that time. The other mass-movements have continued to develop. The present day creep velocity of these mass movements is higher than the av-erage velocity calculated from the total displacement and the 15 000 years since the glacial retreat. The primary phase of the mass-movement is the phase before a sliding surface has developed; during this phase, the stress concentration factor is therefore SC=1. Assuming an internal shear deformation of 100% at the end of the initial phase, the displacement of the centre of gravity is the thickness of the block. Estimates of the internal shear deformation using reconstructions of the pre-failure topography and the actual digital terrain model give values in the range of 130–160% (Br¨uckl and Parotidis, 2000). The factor q considers the pore water pressure at the sliding surface. As pointed out earlier, there is very little in-formation to constrain q. Therefore, values of q=0.00, 0.05, 0.10, 0.15, 0.20, 0.25, 0.30 have been used in the calcula-tion. For LR, the calculations started with q=0.075, and 0.10 in order to keep the rock-mass moving.
Using the relationship for the velocity (3) and the addi-tional data described, the time needed for the primary phase (Tinit)and for the sliding during the secondary phase (Tslide) have been calculated. The total time (Tt ot al)is the sum of Tinit and Tslide, which is 15 000 years for LR, GB and HA and 5200 years for KF. In order to fit Tt ot alto these values, the parameter controlling the smoothing of the sliding sur-face (s0) must be selected properly. As a result, the vari-ation of the Coulomb stress at the sliding surface τ C(α, q) with increasing discontinuous displacement has been ob-tained (Figs. 10a–d). The creep velocity during the initial phase (V el0) and the duration of the initial phase (Tinit) have also been determined. These quantities and s0 have been compiled in Table 5 for the value of q which has been assumed to be the most probable. Furthermore, the ratio of the stress concentration factor during the primary phase (Kinit)to the fracture toughness (Kc) has been calculated from V el0 and the assumption that 1 mm/year creep velocity corresponds to a ratio Kinit/Kc=0.2. Disregarding a system-atic change of the crack length, as has been done previously, the interval of the Coulomb stress (or apparent stress) which corresponds to subcritical crack growth can be indicated in Figs. 10a–d. If the Coulomb stress drops below the lower boundary, the mass-movement stops; if the Coulomb stress reaches the upper boundary, dynamic rupture and the transi-tion to rapid sliding takes place.
On the basis of the variation of τC(α, q) with increas-ing discontinuous displacement at the slidincreas-ing surface shown in Figs. 10a–d, the development of the individual mass-movements investigated here have been discussed below. The conclusions drawn from the models have been discussed critically later.
Table 5. Duration of the primary phase Tinit, velocity during the primary phase V el0, characteristic length controlling the smoothing of the sliding surface s0, ratio of stress concentration factor during initial phase Kinitto fracture toughness Kc, and corresponding ra-tio of pore pressure to effective normal stress q for KF, LR, GB and HA.
Tinit[a] V el0 [m/a] s0 [m] Kinit/Kc q KF 5067 0.059 60 0.33 0.20 LR 5478 0.008 253 0.26 0.15 GB 13431 0.005 62 0.25 0.20 HA 13755 0.007 189 0.26 0.20
KF: The input data have been chosen to get a transition to rapid sliding and, of course, this transition must happen in the model. However, it is remarkable that this transition would have taken place even at very low pore-pressures (q=0.05). Furthermore, the Coulomb stress level corresponding to sub-critical crack growth is exceptionally high compared to LR, GB and HA. The upper boundary is about 3 MPa which is an average value for the stress drop accompanying earthquakes (Kanamori and Anderson, 1975).
LR: During its development, this mass-movement never approached the transition to rapid sliding. At present, it is inactive at low pore water pressures. At higher pore wa-ter pressures (q=0.3) the creep velocity would rise up to 4 m/year. However, this value is insufficient to completely account for the generation of a new scarp, with ∼3 m dis-placement, formed during a short period of heavy precipita-tion in 1965 (see inserted picture in Fig. 2b). This shortcom-ing has been discussed below.
GB: The development of the creeping rock-mass during the primary phase took >10 000 years; since this time GB has been in an accelerating phase. As at LR, the creep veloc-ity would rise to 4–5 m/year at higher pore-pressures. The explanation of the highest creeping velocities of ∼6 m/year, observed from 1974–1975, has been given in the discussion below. The acceleration phase of GB will continue and at a total slip at the basal sliding surface of ∼100 m, a transition to rapid sliding should take place. Only additional stabiliza-tion at the toe of the slope can stop this development.
HA: As at GB, the primary phase took a very long time and today the mass-movement is in an early state of the sec-ondary phase. At present, high pore water pressures will not severely accelerate the rate of movement. The mass-movement could become unstable after a slip of about 200 m. However, such a large displacement would change the gravi-tational stresses in a way not properly described by the model presented here.
5.2 Seismic activity
As briefly described, considerable seismic activity has been observed on GB and HA. How seismic activity could be related to the concept of subcritical crack growth as the
Fig. 10. Rotational slider block model, (a) KF, (b) LR, (c) GB and (d) HA: The diagrams show the Coulomb stress over slip (s) at the
sliding surface. The hatched stress intervals correspond to the subcritical crack growth regime between lower threshold K0and critical stress concentration Kc.
controlling process of slope movement has been discussed here. A prediction combining the seismic activity to the de-velopment of the sliding surface during the secondary phase of deep-seated creep has also been included.
Seismic activity has been assumed to be related to the gen-eration of new fractures. In the model, new fractures are formed by subcritical crack growth, which would not gener-ate any seismic energy. However, if a crack grows, the stress concentration factor at the crack tip will at some point reach a critical value and dynamic rupture, producing seismic en-ergy, will take place. Therefore, seismic activity should be observed during the primary and the secondary phases. For the latter, the assumption has been made that seismic activity is proportional to the power consumed to overcome the as-perities. In this case, seismic activity is proportional to the overall Coulomb stress, τC0, (related to the total sliding sur-face) and from Eq. (2) it follows:
τC0 ∝ 1/SC × V el1/8 (4)
Therefore, the ratio of seismic energy to creep velocity will decrease with increasing smoothing (increasing SC). Infor-mation about the development of SC and of a smooth sliding plane can be obtained by seismic monitoring plus observa-tion of the creep velocity.
5.3 Pore water pressure
The relative sensitivity of the velocity versus pore water pres-sure, represented by the factor q, has been derived in the Ap-pendix. According (A11) it is:
dln(V el(α, q) = [d × g × (V /F ) × cos(α) × (tan(8)/τC0) × dq]8(5) From Eq. (5), it can be seen that the relative sensitivity of the velocity to changing pore water pressures (represented by the factor q) increases as the overall Coulomb stress (τC0), which is related to the total area of the sliding plane, decreases and the sliding surface becomes smoother. On the other hand, to achieve slope stabilization, the Coulomb stress must decrease. Therefore, reactivation of the mass-movement by high pore water pressures at the sliding sur-face (higher than during the earlier development of the mass-movement) is always a possibility, even when the process has been approaching a stable end. The formation of fault gouge or fine grained breccias may support the build-up of high pore water pressure.
6 Discussion and Conclusions
The conclusions drawn from the introduction of subcriti-cal crack growth as the controlling process of deep-seated
E. Br¨uckl and M. Parotidis: Prediction of slope instabilities 169
gravitational creep have been summarized as:
– Creep starts at applied or Coulomb stresses which are
about 20% of the critical stress necessary to overcome fracture toughness.
– The velocity of subcritical crack growth is proportional
to the 8th power of the applied or Coulomb stress; this relation holds for stresses between 20% and 80% of the stresses necessary to overcome fracture toughness. Be-tween 80% and 100%, there is no further increase of the velocity of crack growth.
– The velocity of the creeping rock-mass is proportional
to the velocity of subcritical crack growth. The 20% stress level has been related to a creep velocity of 1 mm/year. From this assumption and the 8th power law, it follows that at the 80% level, the velocity is 0.2 m/day.
– An essential condition for instability of the creeping
rock-mass is the concentration of deformation into a sliding surface. A progressive smoothing of the sliding surface is assumed. This process results in stress con-centrations at asperities which finally reach the critical value to generate dynamic crack growth at all asperities. The transition to rapid sliding takes place at this point.
– In order to keep the creep process stable, the
ef-fect of progressive smoothing of the sliding surface must be compensated for by decreasing the gravita-tional stresses. This compensation is more effective the smaller the radius of curvature of the sliding surface.
– Sensitivity to changing Coulomb stresses and pore
wa-ter pressure increases whilst seismic activity decreases, with progressive smoothing of the sliding surface.
The observable parameters describing the process of deep-seated creep have been summarized as:
– Geometric parameters of the creeping rock-mass,
espe-cially those which are equivalent to the sliding angle and the curvature of the sliding surface of the rotational slider block model; geophysical exploration can deliver the necessary information.
– Cumulative slip along the basal sliding plane; from
ge-omorphological mapping.
– Displacement rates; from terrestrial geodetic methods,
GPS, InSAR, photogrammetry.
– Existence of a completely developed basal sliding
sur-face; inclinometer measurements in several boreholes and/or a kinematic modelling of the whole mass-movement based on observations of the mass balance and the surface velocity (Br¨uckl et al., 2004a) can sup-ply this information.
– Pore water pressure at the basal sliding surface, from
piezometers and/or indirect geophysical methods.
– Seismic activity and its relationship to the total potential
energy release (seismic efficiency); from seismic moni-toring.
– The most important rock mechanical parameter is the
angle of internal friction. This parameter can be derived from the modelling of the initial phase of creep.
These observable features are sufficient to define the ro-tational slider block model described above. Furthermore, observing the seismic efficiency and especially monitoring the sensitivity of the creep velocity to variations in the pore water pressure can supply additional information about the smoothing of the sliding surface. These data could be used to some extent for a validation of the hypothesis inherent in the rotational slider block model and give additional informa-tion on the degree of smoothing of the basal sliding surface. The following predictions could be made:
– Long term prediction from the modelling of the
smooth-ing process in the past and an estimate of further smoothing and the expected change of gravitational stresses due to rotational sliding or other factors.
– Medium term prediction from the estimate of the actual
state of development and the predictions about precip-itation and expected changes of pore water pressure or other medium term changes of Coulomb stress (e.g. ero-sion).
– Short term warning from velocity monitoring; a
veloc-ity of ∼0.2 m/day corresponds to saturation of subcriti-cal crack growth and dynamic rupture could take place at any time. Evacuation or other emergency measures would then be necessary, if the velocity approached this limit. As can be seen from Figs. 10a, c and d, a sig-nificant acceleration will be a precursor of such high velocities.
The approach to prediction of a dynamic failure of a slope exhibiting deep-seated creep presented here is based on sev-eral hypotheses not thoroughly validated so far; sevsev-eral sim-plifications have also been made. No difference has been made between the values of internal friction and friction on sliding surfaces and this angle has been kept constant for the whole process. Only the apparent cohesion has been modelled by a smoothing of asperities. The mathematical description given for the smoothing process is very simple whilst the physical understanding of the process is poor. The influence of pore water has been considered only by the ef-fective stress, the effect of an inclined water table and the direct influence of water on material strength has been ne-glected. Nor are very high velocities during stick-slip mo-tion covered by the model presented here. Furthermore, the creep velocities have been treated as quasi-continuous. In re-ality, the main part of displacement will only occur during phases of high pore water pressure. It is not yet clear how the angle of internal friction, which has been derived from the modelling of the damage process, is related to the results
of creep experiments in the laboratory. In any case, the ap-proach to prediction presented here should be used only in parallel with methods based on the state and velocity depen-dent friction laws. Besides further theoretical work, appli-cation of the model to more field examples is required. An important next step would be the gathering of data about the relationships between changing pore water pressure, veloc-ity and seismic activveloc-ity. With this data, the hypotheses that subcritical crack growth and progressive smoothing of the sliding surface are controlling factors of deep-seated creep could be checked.
Appendix
A rotational slider block (Fig. 9) has been chosen to describe the following items:
– Change in gravitational stresses due to the movement
and smoothing of the sliding surface (Eqs. A6 and A7).
– Velocity of the centre of gravity as a function of
dis-placement and pore water pressure (A8).
– Sensitivity of velocity to smoothing and pore water
pressure (A11).
The variables and parameters necessary to describe the model are summarized below:
α. . . . Angle between the plumb line and the radius pointing from the axis of rotation to the centre of gravity of the slider block (Rg).
α0. . . . α at the begin of sliding.
α1. . . . α at rupture (KF) or at present day (LR, GB, HA). 8. . . . Angle of friction at the sliding surface.
τC0. . . . Coulomb stress at the sliding surface.
τC. . . . Coulomb stress at the asperities of the sliding surface. A. . . . Area of the sliding surface.
d. . . . Density of the sliding rock-mass. g. . . . Gravitational acceleration.
q. . . . Ratio between pore water and overburden pressure at the sliding plane.
p. . . . Pore water pressure.
Rg. . . . Radius pointing from the axis of rotation to the centre of gravity of the slider block.
Rs. . . . Radius of the sliding surface.
s. . . .Discontinuous displacement on sliding surface at rup-ture (KF) or at the present (LR, GB, HA).
s0. . . ... Characteristic length controlling the smoothing of the sliding surface.
SC. . . . Stress concentration factor. V. . . . Volume of the sliding rock–mass. V el. . . . Velocity of centre of gravity.
V el1. . . Vel at rupture (KF) or at the present (LR, GB, HA). The following moments determine the equilibrium of the rotational slider block:
Moment caused by gravitation:
Mg=d × g × V × sin(α)×Rg (A1)
Moment caused by friction:
Mf = (d × g × V ×cos(α) − p) × tan(8) × Rs (A2)
Moment caused by Coulomb stress:
Mc = τC0 × F / cos(α) × Rs (A3)
Equilibrium of moments:
Mg + Mf + Mc =0 (A4)
The stress concentration at asperities due to the smoothing of the sliding plane has been modelled by a stress concentra-tion factor SC:
τC =SC × τC0 SC =exp[(α0 − α) × Rs/s0] (A5)
The quantity s0 has the dimension of a length and is the pa-rameter controlling the smoothing of the sliding surface. The Coulomb stress at the asperities (A6) for an arbitrary α and qfollows from equations A1–A5. The quantity q is the ratio between pore water and overburden pressure at the sliding plane (A7).
τC(α, q) =exp[(α0 − α) × Rs/s0] × d × g × (V /F ) × cos(α) ×[(Rg/R) ×sin(α) − (cos(α) − q) × tan(8)] (A6)
q = p × F × (d × g × V ×cos(α))−1 (A7)
The creep velocity is given by Eq. (2) and has been formu-lated as a function of α and q in the following way:
V el(α, q) = V el1 × (τC(α, q)/τC(α1, q))8 (A8) The applied stress σA has been replaced by the Coulomb stress τC in (A8) as both quantities are identical for shear mode failures. The relative sensitivity of the Coulomb stress versus pore-pressure, represented by the factor q, has been found by differentiating (A6). The relative sensitivity of the velocity (A11) follows from Eqs. (2), (A9), and (A10).
dln(τC(α, q)) =
tan(8) × [sin(α) × (Rg/Rs) − (cos(α) − q) × tan(8)] × dq (A9)
dln(τC(α, q)) =
d × g × (V /F ) ×cos(α) × (tan(8)/τC0) × dq (A10)
dln(V el(α, q) = [dln(τC(α, q))]8=
[d × g × (V /F ) ×cos(α) × (tan(8)/τC0) × dq]8 (A11)
Acknowledgements. This paper is part of a research funded by the
Austrian Academy of Sciences within the Austrian contribution to IDNDR (International Decade of Natural Disaster Reduction) and ISDR (International Strategy for Disaster Reduction). We express our thanks to L. H. Blikra and W. Z. Savage for their thorough review and the valuable comments and suggestions. We further say our thanks to H. Rice for critically reading and correcting the paper. Edited by: G. B. Crosta
E. Br¨uckl and M. Parotidis: Prediction of slope instabilities 171
References
Attewell, P. B. and Farmer, I. W.: Principles of engineering geology, Chapman and Hall, London, 1045, 1976.
Ampferer, O.: ¨Uber einige Formen der Bergzerreissungen, Sitz. Ber. Akad. Wiss. Wien, m.-n. Kl. 148, 1–14, 1939.
Atkinson, B. and Meredith, P.: The theory of subcritical crack growth with applications to minerals and rocks, in: Fracture Me-chanics of Rock, edited by: Atkinson, B., Academic Press geol-ogy series, Great Britain, 111–166, 1987.
Bisci, C., Dramis, F., and Sorriso-Valvo, M.: Rock flow (sackung), in: Landslide Recognition, edited by: Dikau, R., Brunsden, D., Schrott, L., and Ibsen, M. L., John Wiley & Sons, England, 150– 160, 1996.
Br¨uckl, E.: Cause-effect models of large landslides, Nat. Haz., 23, 291–314, 2001.
Br¨uckl, E. and Scheidegger, A. E.: The rheology of spatially con-tinuous creep in rock, Rock Mech., 4, 237–250, 1972.
Br¨uckl, E. and Parotidis, M.: Seismic velocities of large rockslide masses, Proceedings of the 62nd EAGE Conference & Technical Exhibition, Glasgow, Scotland, 2000.
Br¨uckl, E., Br¨uckl, J., and Heuberger, H.: Present structure and pre-failure topographys of the giant rockslide of K¨ofels, Zeitschrift f. Gletscherkunde u. Glazialgeologie, 37/1, 49–79, 2001.
Br¨uckl, E. and Parotidis, M.: Estimation of large scale mechanical properties of a giant landslide on the basis of seismic results, Int. J. Rock Mech. Min. Sci., 38, 877–883, 2001.
Br¨uckl, E., Pregesbauer, M., and Ullrich, C.: Seismic and gravi-metric monitoring of deep creep in rock slopes, Geophys. Res. Abstr., Vol. 5, 07420, European Geophysical Society, 2003. Br¨uckl, E., Brunner, F. K., and Kraus, K.: The kinematics of a
deep-seated mass movement derived from geophysical, GPS and photogrammetric data, Poster Presentation at EGU, 1st General Assembly, Nice, France, 25–30 April 2004a.
Br¨uckl, E., Zangerl, Ch., and Tentschert, E.: Geometry and de-formation mechanisms of a deep-seated gravitational creep in crystalline rocks, in: Proceedings of the ISRM Regional Sym-posium EUROCK 2004 & 53rd Geomechanics Colloquy, edited by: Schubert, W., 229–232, 2004b.
Brunner, F. K., Zobl, F., and Gassner, G.: On the Capability of GPS for Landslide Monitoring, Felsbau, 21, 51–54, 2003.
Byerlee, J. D.: Friction of rocks, Pure Appl. Geophys., 116, 615– 626, 1978.
Castillo, E.: Untersuchung von Massenbewegungen mit geo-physikalischen Methoden und FE-Modellrechnungen, PhD The-sis, Vienna University of Technology, Austria, 2001, 1997. Dikau, R., Brunsden, D., Schrott, L., and Ibsen, M. L.: Introduction,
in: Landslide Recognition, edited by: Dikau, R., Brunsden, D., Schrott, L., Ibsen, M. L., John Wiley & Sons, England, 1–12, 1996.
Eberhardt, E., Stead, D., and Coggan, J. S.: Numerical analysis and progressive failure in natural rock slopes – the 1991 Randa rockslide, Int. J. Rock Mech. Min. Sci., 41, 69–87, 2004. Erismann, T. H.: Mechanisms of large landslides, Rock Mech., 12,
15–46, 1979.
Erismann, T. H. and Abele, G.: Dynamics of rockslides and rock-falls, Springer, Berlin, 316, 2001.
Erismann, T. H., Heuberger, H., and Preuss E.: Der Bimsstein von K¨ofels (Tirol), ein Bergsturz-“Friktionit”, Tschermaks Mineral-ogische und Petrographische Mitt., 24, 67–119, 1977.
Gassmann, F.: ¨Uber die Elastizit¨at por¨oser Medien, Vierteljahress-chr. d. Naturforsch. Ges. Z¨urich, 96, 1–22, 1951.
Gerber, E. K. and Scheidegger, A. E.: Stress-induced weathering of rock masses, Eclogae Geol. Helv., 62/2, 401–405, 1969. Gottschling, H.: Der Talzuschub Gradenbach – ein
geologisch-geotechnischer ¨Uberblick, Jb. Geol. B.-A., Wien, 141/4, 345– 367, 1999.
Hanks, T. C. and Kanamori, H.: A moment magnitude scale, J. Geophys. Res., 84, 2348–2350, 1979.
Hauswirth, E., Pirkl, H., Roch, K., and Scheidegger, A. E.: Unter-suchungen eines Talzuschubes bei Lesach (Kals, Osttirol), Verh. Geol. B.-A.,Wien, 2, 51–76, 1979.
Helmstetter, A., Sornette, D., Grasso, J.-R., Andersen, J. V., Gluz-man, S., and Pisarenko, V.: Slider-block friction model for land-slides: Application to Vaiont and La Clapiere landslides, J. Geo-phys. Res., 109, B02409, doi:10.1029/2002JB002160, 2004. Hendron, A. J.: Rock mechanics in engineering practice, edited by:
Stagg, K. G. and Zienkiewicz, O. C., John Wiley & Sons, Great Britain, 21–51, 1968.
Heuberger, H.: The giant landslide of K¨ofels, ¨Otztal, Tyrol, Moun-tain Research and Development, 14/4, 290–293, 1994.
Husen van, D.: Die Ostalpen und ihr Vorland in der letzten Eiszeit (W¨urm), Map 1: 500 000, Geologische Bundesanstalt, Wien, 1987.
Hutchinson, J. N.: General Report: Morphological and geotechni-cal parameters of landslides in relation to geology and hydrology, in: Proc., 5th International Symposium on Landslide, edited by: Bonnard, C. and Balkelma, A., Rotterdam, Netherlands, 1, 3–35, 1988.
Jaeger, Ch.: Rock mechanics and engineering, Cambridge Univer-sity Press, London, 417, 1972.
Kanamori, H. and Anderson, D. L.: Theoretical basis of some em-pirical relations in seismology, Bull. Seismological Soc. Am., 65/5, 1073–1095, 1975.
Kreuzer, E. and Hinteregger, E.: Sch¨aden an einem Tunnel zufolge Hangkriechens – Schadensbild, Ursachen, Sanierung, Felsbau, 1, 14–24, 2001.
Kronfellner-Kraus, G.: Neue Untersuchungen in Wildb¨achen – Der Talzuschub in Abh¨angigkeit von Niederschl¨agen, Int. Symp. In-terpraevent, Bad Ischl, 1, 179–192, 1980.
Lawn, B.: Fracture of brittle solids, second edition, Cambridge Uni-versity press, 378, 1993.
McGarr, A. and Bicknell, J.: Estimation of near-fault ground mo-tion of mining-induced tremors from locally recorded seismo-grams in South Africa. Rockbursts and seismicity in mines, ed-itor Fairhurst, Balkema, Rotterdam, ISBN 906191 1 45 1, 245– 248, 1990.
Moser, M. and Kiefer J.: Die hydrogeologischen Verh¨altnisse und ihre Beziehungen zur Kinematik im Bereich der Talzuschub-masse Gradenbach/K¨arnten, Steir. Beitr. z. Hydrogeologie, Graz, 39, 95–115, 1988.
Nemcok, A., Pasek, J., and Rybar J.: Classification of landslides and other mass movements, Rock Mech., 4, 71–78, 1972. Parotidis, M.: Geomechanische Modellierung von
Massenbewe-gungen, PhD Thesis, Vienna University of Technology, Austria, 2001.
Rao, Q., Stillborg, B., Sun, Z., Wang G., and Xu J.: Mode II fracture toughness testing of rock, 9th International Congress on Rock Mechanics, Paris, France, 731–734, 1999.
Savage, W. Z., Baum, R. L., Morrissey, M. M., and Arndt, B. P.: Finite-Element Analysis of the Woodway Landslide, Washing-ton, U.S. Geological Survey Bulletin 2180, 0nly available online at http://geology.cr.usgs.gov/pub/bulletins/2180/, 2000.
Savage, W. Z. and Varnes, D. J.: Mechanics of gravitational spread-ing of steep-sided ridges (“sackung”), International Assoc. of En-gineering Geologists Bulletin, 35, 31–36, 1987.
Scheidegger, A. E.: Theoretical Geomorphology, second rev. edi-tion, Springer Verlag, Berlin, 434, 1970.
Scholz, C. H.: The mechanics of earthquakes and faulting, Cam-bridge University Press, 439, 1990.
Segall, P.: Rate-dependent extensional deformation resulting from crack growth in rock, J. Geophys. Res., 89/6, 4185–4195, 1984. Stini, J.: Unsere T¨aler wachsen zu, Geol. U. Bauw., Wien, 13/ 3,
71–79, 1941.
Tentschert, E.: Das Langzeitverhalten der Sackungsh¨ange im Spe-icher Gepatsch (Tirol, ¨Osterreich), Feldbau, 16/3, 194–200, 1998.
Voight, B.: A method for prediction of volcanic eruptions, Nature, 332, 125–130, 1988.
Voight, B.: Material science laws applies to time forecast of slope failure, In: Proc., 5th International Symposium on Landslide, ed-itor C. Bonnard, A. Balkelma, Rotterdam, Netherlands, 3, 1471– 1472, 1990.
Watkins, J. S., Walters, L. A., and Godson, R. H.: Dependence of in-situ compressional wave velocity on porosity in unsaturated rocks, Geophys., 37/1, 29–35, 1972.
Weidner, S., Moser, M., and Lang, E.: Influence of hydrology on sagging of mountain slopes (”Talzusch¨ube”) – new results of time series analysis, 8th International IAEG Congress, Balkema, Rotterdam, ISBN 9054109904, 1259–1266, 1998.