HAL Id: hal-00301226
https://hal.archives-ouvertes.fr/hal-00301226
Submitted on 21 Aug 2003HAL is a multi-disciplinary open access
archive for the deposit and dissemination of sci-entific research documents, whether they are pub-lished or not. The documents may come from teaching and research institutions in France or abroad, or from public or private research centers.
L’archive ouverte pluridisciplinaire HAL, est destinée au dépôt et à la diffusion de documents scientifiques de niveau recherche, publiés ou non, émanant des établissements d’enseignement et de recherche français ou étrangers, des laboratoires publics ou privés.
Cloud thermodynamic phase and particle size estimation
using the 0.67 and 1.6 ?m channels from meteorological
satellites
D. Jolivet, A. J. Feijt
To cite this version:
D. Jolivet, A. J. Feijt. Cloud thermodynamic phase and particle size estimation using the 0.67 and 1.6 ?m channels from meteorological satellites. Atmospheric Chemistry and Physics Discussions, Eu-ropean Geosciences Union, 2003, 3 (4), pp.4461-4488. �hal-00301226�
ACPD
3, 4461–4488, 2003 Cloud particle classification from meteorological satellitesD. Jolivet and A. J. Feijt
Title Page Abstract Introduction Conclusions References Tables Figures J I J I Back Close Full Screen / Esc
Print Version Interactive Discussion
© EGU 2003
Atmos. Chem. Phys. Discuss., 3, 4461–4488, 2003 www.atmos-chem-phys.org/acpd/3/4461/
© European Geosciences Union 2003
Atmospheric Chemistry and Physics Discussions
Cloud thermodynamic phase and particle
size estimation using the 0.67 and 1.6 µm
channels from meteorological satellites
D. Jolivet and A. J. Feijt
Royal Netherlands Meteorological Institute, PO Box 201, NL-3730 AE De Bilt, The Netherlands
Received: 18 March 2003 – Accepted: 11 August 2003 – Published: 21 August 2003 Correspondence to: D. Jolivet ([email protected])
ACPD
3, 4461–4488, 2003 Cloud particle classification from meteorological satellitesD. Jolivet and A. J. Feijt
Title Page Abstract Introduction Conclusions References Tables Figures J I J I Back Close Full Screen / Esc
Print Version Interactive Discussion
© EGU 2003
Abstract
A robust method to estimate the cloud microphysical properties from visible (0.67 µm) and near infrared (1.6 µm) measurements of reflected sunlight is presented. The method does not determine cloud particle phase and size separately. Instead it as-signs a cloud particle type to every pixel that is most representative for the radiation
5
measurements. The corresponding radiative transfer model calculations will yield the most accurate values for optical thickness. Furthermore, an estimate of the particle size is obtained, which is used in estimates of liquid water path.
Radiative transfer calculations have been performed for eleven cloud particle models assuming a single, plane-parallel and homogeneous layer. Standard gamma
distribu-10
tions with varying effective radii have been chosen for liquid water droplet whereas imperfect hexagonal ice crystal with different aspect ratio and size were selected for ice particles. It is shown that the ratio of the visible reflectivity to the near infrared reflectivity as a function of the visible reflectivity allows a consistent classification of cloud particles with respect to size and phase over a large area. The method is tested
15
with measurements from the Along Track Scanning Radiometer instrument (ATSR-2) on board ERS-2 for a marine stratocumulus cloud and a cirrus cloud over the North Sea. For both cases, the variation of the measured ratio as a function of the measured visible reflectivity is well simulated by liquid water droplet distribution with an effective radius between 4 and 10 micrometers for the stratocumulus and by imperfect
hexago-20
nal ice crystal with a size of 60 µm for cirrus.
The method was used in the CLIWANET-project and will be the basis to the algo-rithm for AVHRR and SEVIRI radiances for EUMETSAT’s Sattelite Application facility on climate monitoring.
ACPD
3, 4461–4488, 2003 Cloud particle classification from meteorological satellitesD. Jolivet and A. J. Feijt
Title Page Abstract Introduction Conclusions References Tables Figures J I J I Back Close Full Screen / Esc
Print Version Interactive Discussion
© EGU 2003
1. Introduction
The atmospheric composition with respect to CO2, ozone, other trace gases and aerosols is changing. One of the largest uncertainties in the assessment of the re-sponse of the EarthAtmosphere system on to this change is in the cloud feedback (IPCC, 1995, 2001; Cess et al. 1989, 1990, 1996; Gates et al., 1999). Clouds have a
5
significant effect on the radiation balance (Wielicki et al, 1996; Mitchell, 1989) due to two competing effects. On one hand, clouds reflect the incoming solar radiation and thus cool the Earth-Atmosphere system. On the other hand, clouds absorb longwave thermal radiation coming from the surface and then re-emit at a lower temperature. This results in a warming of the Earth-Atmosphere system. In order to predict future
10
climate, we have to know how the distribution of clouds over the globe will change. The assessment of future climate is largely founded on climate models. Using cloud parameterizations the model calculates the amount of cloud particles and the radiation components. These parameterizations include assumptions with respect to cloud spa-tial distributions, cloud particle size and thermodynamic phase. The current state of the
15
art models do not represent cloud processes good enough to model current and future climate (IPCC, 2001). There are various reasons for this. Clouds form as a result of small variations in the amount of water vapor and thus the condensation and evapo-ration of cloud particles is sensitive to small variations in the water vapor field. Cloud processes include negative and positive feedbacks. Furthermore, cloud processes act
20
at a large range of scales, from radiative cooling at micrometer scale to large scale lifting in a frontal zone that extents over thousands of kilometers.
In order to improve the climate models, reference measurements of cloud properties are required (IPPC, 2001). This paper describes a robust method to obtain consistent information on the thermodynamic phase (ice or water) and size of both water and ice
25
cloud particles from passive imagery. In the framework of the Cloud Liquid Water Net-work project, CLIWANET, the method was used to derive spatial distributions of cloud liquid water contents for atmospheric model evaluation (Feijt et al., 2002; van
Meij-ACPD
3, 4461–4488, 2003 Cloud particle classification from meteorological satellitesD. Jolivet and A. J. Feijt
Title Page Abstract Introduction Conclusions References Tables Figures J I J I Back Close Full Screen / Esc
Print Version Interactive Discussion
© EGU 2003
gaard et al., 2001). The method will be the basis for the cloud analysis method used in the framework of EUMETSATs Satellite Application Facility on Climate Monitoring, CM SAF. This SAF aims to provide the climate research community with a consistent data set on radiation, clouds and ocean properties from future meteorological satellite measurements (Woick et al., 1997).
5
The determination of the cloud particle type allows for improvement of higher order cloud parameters such as optical thickness, emissivity and water content. Further-more, this information can be used as a reference to atmospheric models to improve the cloud parameterizations.
Methods to retrieve particle size and thermodynamic phase separately have been
10
reported in literature. They are based on the fact that the visible reflectance is primarily a function of the cloud optical thickness, whereas the reflectance at a cloud particle ab-sorption spectral band in the near infrared is primarily a function of cloud particle size. The most common near-infrared wavelengths studied are 1.6, 2.2 and 3.7 µm (Arking and Childs, 1985; Nakajima and King, 1990; Han et al, 1994; Nakajima and Nakajima,
15
1995; Watts, 1996). The 1.6 µm channel is also used to retrieve the thermodynamic phase (King et al, 1992, Baum et al, 2000).
The method described here enables simultaneous retrieval of cloud optical thick-ness and particle phase and size, which leads to consistent cloud property analysis. Instead of estimating the cloud particle phase and size separately eleven cloud
parti-20
cle models are defined. From statistical analysis of the 0.67 and 1.6 µm radiances the cloud particle model, which is most representative for the measured radiances, is se-lected. In Sect. 2, the method and the physical principles it is based on are presented. Some cases of cloud analysis using this method based on ATSR measurements are presented in Sect. 3. In Sect. 4, the results are summarized and discussed.
ACPD
3, 4461–4488, 2003 Cloud particle classification from meteorological satellitesD. Jolivet and A. J. Feijt
Title Page Abstract Introduction Conclusions References Tables Figures J I J I Back Close Full Screen / Esc
Print Version Interactive Discussion
© EGU 2003
2. Theoretical background
2.1. Cloud radiation interactions at 0.67 and 1.6 µm
In this paper, clouds are treated as plan-parallel and homogeneous layers. The cloud properties are vertically and horizontally constant within the model layer. Eleven dif-ferent cloud particle distributions are modeled. Liquid water clouds are composed of
5
spherical droplets. The size distribution of cloud droplets is modeled using the for-malism of the standard gamma distribution (Dermendjian, 1969). The two parameters describing the distribution are the effective radius re and the effective variance ve. The effective variance is assumed to be 0.15.
The modeling of ice clouds is more complicated, because they are composed of
crys-10
tal that may vary in shape and size considerably (Krupp et al, 1991; Liou, 1986). Two models have been chosen. One model considers ice particles as spherical particles following a gamma standard distribution and an effective variance of 0.25. This model is selected to represent a broad distribution of particle size. The second ice model represents the imperfect hexagonal ice crystal described by Hess et al (1998). Table 1
15
lists the dimension and aspect ratio of the three imperfect hexagonal ice crystals used in this study.
For spherical particles, the extinction coefficient, single scattering albedo and phase function are calculated using Mie theory. Table 2 gives the value of the single scattering albedo for different effective radii of liquid water droplet at the visible channel 0.67 µm
20
and the near infrared channel 1.6 µm.
The single scattering albedo is almost equal to 1 in the visible. The value does not vary significantly with the particle size. The absorption can be considered negligible. In contrast to the visible, the absorption is significant at 1.6 µm. The single scattering albedo is smaller than 0.997 for all cloud models. This implies that more than 3 out of
25
thousand photons are absorbed when interacting with a droplet. The single scattering albedo at 1.6 µm shows a clear correlation with particle size. The single scattering albedo decreases with particle size, thus absorption increases with particle size. The
ACPD
3, 4461–4488, 2003 Cloud particle classification from meteorological satellitesD. Jolivet and A. J. Feijt
Title Page Abstract Introduction Conclusions References Tables Figures J I J I Back Close Full Screen / Esc
Print Version Interactive Discussion
© EGU 2003
scattering properties of ice clouds are calculated with the ray-tracing method for im-perfect hexagonal ice crystals (Macke et al., 1996). Absorption is even more dominant at 1.6 µm for ice particles as is illustrated in Table 3. If the value of single scattering albedo of the ice model C1 is comparable to the value obtained for very large liquid wa-ter droplet (around 0.96), ice models C2 and more especially C3 have a considerable
5
lower value of the single scattering albedo.
In short, the radiative properties at the visible and the near-infrared channels differ mainly in term of absorption characteristics. In the two next paragraphs the relation between reflectivity and particle type will be studied in more detail.
2.2. Variation of reflectivity with the optical thickness and particle size
10
The signal measured by a radiometer on board a satellite depends strongly on the cloud properties, the viewing geometry and the surface radiative properties. The angu-lar distribution of reflected sunlight can be measured from space as was demonstrated for broadband radiometers with ERBE (Suttles et al. 1988a, 1988b; Taylor and Stowe, 1984) and for narrow spectral bands with POLDER (Deschamps et al., 1994). In the
15
present study radiative transfer calculations were performed with the doubling-adding KNMI (DAK) model (Stammes, 1994), which is based on the doubling-adding method (De Haan et al, 1987). The model consists of a plane-parallel multi-layered atmosphere over a lambertian reflecting surface. The energetic quantity under consideration is the reflectivity at the top of the Earth’s atmosphere (TOA), which is defined:
20
R(θ0, θv, ϕ)= L(θo, θv, ϕ)
F0cos θ0 (1)
where L is the radiance at the top of the atmosphere, θ0is the solar zenith angle, θvis the viewing zenith angle, ϕ is the relative azimuth angle and πF0 is the incident solar irradiance perpendicular to the solar beam.
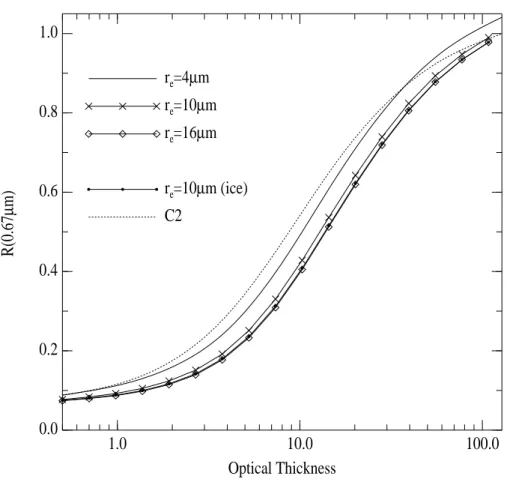
Figure 1 shows the values of the simulated reflectivity at 0.67 µm as a function of
25
ACPD
3, 4461–4488, 2003 Cloud particle classification from meteorological satellitesD. Jolivet and A. J. Feijt
Title Page Abstract Introduction Conclusions References Tables Figures J I J I Back Close Full Screen / Esc
Print Version Interactive Discussion
© EGU 2003
geometry is defined by a solar zenith angle of 43.3◦, a viewing zenith angle of 90 and a relative azimuth angle of 114◦. The reflectivity increases strongly with optical thickness. The difference between liquid water droplet distributions of different size is smaller than the difference between an ice and a water particle distribution. The relation with particle size is weak for liquid water droplet distributions. This statement is also valid for C1,
5
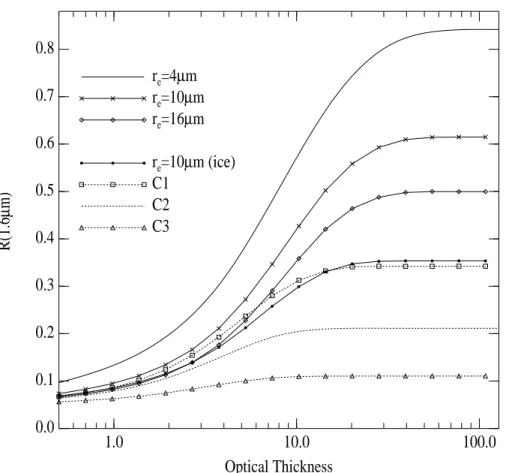
C2 and C3 (not shown), which give almost equal reflectivities (Knap et al., 1999). The reflectivity at 1.6 µm shows similar strong correlation with optical thickness as in the visible for low values (see Fig. 2). However, at 1.6 µm the lines for the different particle types and sizes are clearly separated. For higher values of the optical thickness the reflectivity does not vary with optical thickness, but depends on the particle size
10
distribution and type only. The optical thickness at which the maximum reflectivity is reached depends on the single scattering albedo.
The physical reason for the two distinct scattering regimes is the ratio of scattering versus absorption. Although the absorption is relatively strong at 1.6 µm, only about 1% of the light is absorbed per interaction. For thin clouds, and thus only a small
num-15
ber of scattering interactions, the reflectance depends mainly on the total number of particles. For thick clouds, the number of scattering events becomes large by multiple scattering. Therefore, the chance of absorption within the cloud increases (Watts et al., 1998; Feigelson 1984). The curves for the water clouds are well separated, because big particles have a low single scattering albedo and thus reflect less light than small
20
particles. Also, water and ice particles can easily be distinguished from Fig. 2.
2.3. Ratio of reflectivity at 0.67 over 1.6 µm
The 0.67 and 1.6 µm channels have been used to derive simultaneously the e ffec-tive radius and the optical thickness, because the reflectivity in a visible channel de-pends primarily on the optical thickness, whereas the reflectivity in a water absorbing
25
near infrared channel depends strongly on the particle size (Nakajima and King, 1990; Twomey and Cocks, 1989). The ratio of the reflectivity at 0.75 µm over the reflectivity at 1.6 µm was used by King et al. (1992) to determine the thermodynamic phase of
ACPD
3, 4461–4488, 2003 Cloud particle classification from meteorological satellitesD. Jolivet and A. J. Feijt
Title Page Abstract Introduction Conclusions References Tables Figures J I J I Back Close Full Screen / Esc
Print Version Interactive Discussion
© EGU 2003
cloud particles. Our method is based on the same physical foundation, but enables cloud particle classification with size and phase in one step. For clarity the King et al (1992) method is described here. In a scatter plot of the ratio 0.75 over 1.6 µm ratio versus the brightness temperature at 10.8 µm liquid water cloud are identified by the high brightness temperature at 10.8 µm together with a large value of the ratio 0.75
5
over 1.6 µm ratio. Ice clouds show up in the part of the scatter plot with low brightness temperatures and low value of the 0.75 over 1.6 µm ratio. The 10.8 µm channel signal contains two kinds of information: temperature and optical thickness. For optically thick clouds, the 10.8 µm channel represents the thermodynamic temperature of the cloud top. The temperature is an indicator for thermodynamic phase, but does not give the
10
phase unambiguously, because super cooled water drops have been observed even at temperatures as low as 245 K (Pruppacher and Klett, 1978). For optically thin clouds, the signal is the weighted average of contributions from the ground and the surface. The 10.8 µm brightness temperature that is measured from satellite is higher than the actual cloud thermodynamic temperature. The weighing factor is the emissivity, ε:
15
L= Lcl oud(T )∗ε+ (1ε)∗Lsurf ace (2)
Where, L stands for radiance (as in Eq. 1).
To obtain an estimate of the optical thickness from the 10.8 µm channel signal re-quires information on the surface temperature and cloud thermodynamic temperature. In the following, a method is presented that utilizes the 0.67 and 1.6 µm channels
20
reflectivities only to determine simultaneously the thermodynamic phase and size of cloud particles in the particle models that were presented in Sect. 2.
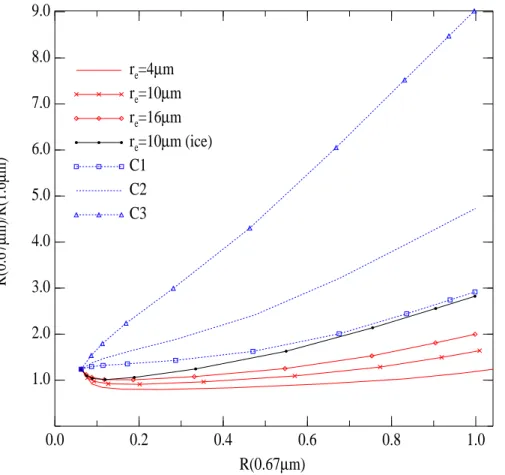
A scatter plot of the ratio of 0.67 over 1.6 µm of reflectivity versus the reflectivity at 0.67µm is presented in Fig. 3 for the three cloud particle models for one sun-satellite geometry (θ0=43.3◦, θv=9◦and ϕ=114◦). For all the numerical simulations the surface
25
albedo is equal to 0.05 for both visible and near infrared wavelength.
The ratio of the reflectivity at 0.67 µm over the reflectivity at 1.6 µm, Rvis/Rnir, in-creases with particle size for all particle types (not shown for ice spheres). All cloud
ACPD
3, 4461–4488, 2003 Cloud particle classification from meteorological satellitesD. Jolivet and A. J. Feijt
Title Page Abstract Introduction Conclusions References Tables Figures J I J I Back Close Full Screen / Esc
Print Version Interactive Discussion
© EGU 2003
particle types have distinctly different signature, except for the C1 and Re=10 µm ice spheres. For spherical particles of the same size, the ratio is higher for ice than for liquid. This was expected from the higher absorption by ice at 1.6 µm. For liquid water droplets the ratio never exceeds 2, whereas it can reach values greater than 3 for large ice spherical particles and imperfect hexagonal crystals. These values occur at high
5
values of the visible reflectivity that correspond to large optical thickness. Although the value of the ratio changes with the sun and satellite position, the difference between each cloud particle model will still subsist over the full range of reflectivity (Fig. 3a). For some viewing geometries there may be overlapping values for very small ice crystals and big liquid water droplet (Fig. 3b). This implies that the cloud phase discrimination
10
may be critical for a little range of cloud particle models. However, the scatter plot contains more information than thermodynamic phase alone. The shape of the line contains information on the particle thermodynamic phase and size. From the shape of the line the specific cloud type can be identified. This feature will be analyzed in depth in the following. In an operational scheme the comparison of the measured
ra-15
tio with simulated ratios allows the direct retrieval of the cloud microphysics (phase and size). The optical thickness is then retrieved using the adapted cloud model. Our method has the advantage to be straightforward and does not require the assumption of the phase before the retrieval procedure. No iteration scheme is needed to match the visible and the near reflectivity to the optical thickness and the particle size. Thus
20
this method appears to need lower computational costs.
Moreover, from the scatter plot the cloud model can be selected that is most rep-resentative for the sample. Therefore, the actual cloud-radiation interaction is best represented by the radiative transfer of the selected cloud model. Application of the correct look-up tables should improve the accuracy of the retrieved cloud properties
25
such as optical thickness, particle size and shape and cloud water. In the following this concept is applied for a number of cases with water and ice clouds.
ACPD
3, 4461–4488, 2003 Cloud particle classification from meteorological satellitesD. Jolivet and A. J. Feijt
Title Page Abstract Introduction Conclusions References Tables Figures J I J I Back Close Full Screen / Esc
Print Version Interactive Discussion
© EGU 2003
3. Case studies
3.1. ATSR-2
The Along Track Scanning Radiometer (ATSR) instruments, ATSR-1, ATSR-2 and Ad-vanced (AATSR), are second generation space radiometers built on the long heritage of the NOAA-AVHRR sensors. The ATSR-2, on board the ESA/ERS-2 satellite, is a
5
multi-channel instrument providing measurements at 0.67, 0.87, 1.6, 10.8 and 12 µm with a spatial resolution of about 700 m sub-satellite. The ATSR instruments have an in- flight calibration facility. Although ATSR instruments are able to provide measure-ments of the same scene at two different viewing angles (nadir and forward direction around 550), data used for this study comes from single view measurements performed
10
in 1996. The ATSR images analyzed cover a part of Great Britain, the North Sea and the Netherlands. Two days have been selected. 4 September 1996 (satellite overpass at 10:22 UTC) with stratocumulus over the North Sea and 19 November 1996 (satel-lite overpass at 10:33 UTC) with cirrus clouds over the North Sea and the Netherlands. Within these two images several areas of 49×49 pixels have been selected for analysis,
15
because they are representative for different cloudy types. 3.2. Marine Stratocumulus
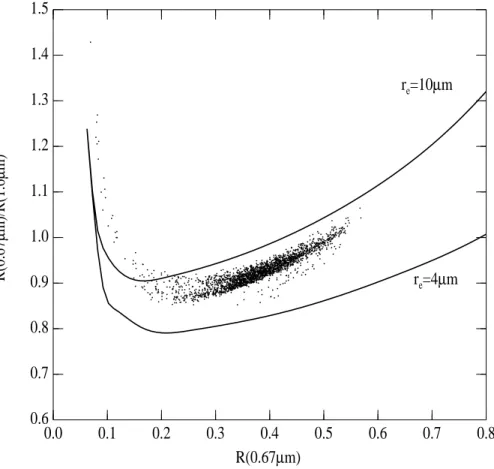
The stratocumulus field of 4 September 1996 is shown in Fig. 4. A rectangle indicates the selected area for analysis. This area is representative of the stratocumulus over sea. The brightness temperature measured at 10.8µm is between 278 and 284 Kelvin
20
and thus is representative of warm water clouds. Figure 5 shows the ratio of the reflec-tivity at 0.67 over that at 1.6 µm (Rvis/Rnir) versus the reflectivity at 0.67 µm. The ratio of reflectivities is between 0.8 and 1.45, which also indicates water clouds. The two lines in Fig. 5 indicate the precalculated values for water clouds model with respectively 4 and 10 µm effective radius. The measurements are better simulated with the cloud
25
ACPD
3, 4461–4488, 2003 Cloud particle classification from meteorological satellitesD. Jolivet and A. J. Feijt
Title Page Abstract Introduction Conclusions References Tables Figures J I J I Back Close Full Screen / Esc
Print Version Interactive Discussion
© EGU 2003
of optical properties this cloud model should be used to obtain the most accurate re-sults. For small values of reflectivity the similarity drops. This is probably due to the value of the surface reflectivity in the simulations that may be different from the actual value.
3.3. Cirrus
5
An extensive high level cloud layer was overlying the North Sea on 19 November 1996 (Fig. 6). From the ATSR-2 overpass at 10:33 UTC, two square of 49×49 pixels have been selected to be representative of an area with large visible reflectivity (centered at 52.20◦N and 2.60◦E, not drawn) and an area with highly variable visible reflectivity (centered at 52.55◦N and 3.38◦E). In the first zone the Rvis/Rnir-ratio values range
10
from 2.5 to 3.1 (not shown). According to the simulations these values can only be represented by the ice cloud models and the C2 ice crystals simulated very well the measured ratio. The very low brightness temperatures measured at 10.8 µm, which are between 219 K and 226 K, confirm the assumption of ice particles. This shows that for optically thick, very cold clouds the simple thresholding of Rvis/Rnir is expected to
15
give accurate results.
The scatter plot for the second zone is shown in Fig. 7. The observed cloudy scene reveals a broad range of visible reflectivity (between 0.18 and 0.62) for a significant variation of the ratio (between 1.25 and 2.35). The ratio increases with the visible re-flectivity. The signature of the scatter plot however, clearly shows that the 0.67 and
20
1.6 µm reflectances correlate best to the ice cloud models. In particular, measure-ments are distributed around values found with ice model C2. Thus, the imperfect hexagonal crystal model is able to explain the ATSR-2 measurements. This result is in agreement with the conclusion of Knap et al (1999) who found that ice model C2 was representative for gradually thickening anvil clouds over the Pacific Ocean. Of
25
course, this approach only holds if the cloud field extents over an area that is large enough to obtain sufficient statistics. In this case a 49×49 pixel area, corresponding to approximately 60×60 km2, was analyzed, so more than 2000 values were used to
ACPD
3, 4461–4488, 2003 Cloud particle classification from meteorological satellitesD. Jolivet and A. J. Feijt
Title Page Abstract Introduction Conclusions References Tables Figures J I J I Back Close Full Screen / Esc
Print Version Interactive Discussion
© EGU 2003
obtain the statistics. The scatter plot does not only provide us with phase information, but also gives an indication of the cloud type model that should be used for analysis of the radiances to obtain the most accurate values for optical thickness and cloud water. In Fig. 7 the brightness temperature as measured by the infrared 10.8 µm channel is also shown in gray tones in the scatter plot. The lowest value (230 K) occurs at
5
high reflectivity values. This is consistent with the relation between reflectivity, optical thickness and emissivity (Eq. 2). The high values (260 K) occur for areas with low reflectivity and thus non-unity emissivity. The measured radiance contains contribution from the relatively warm surface. For cases with semi-transparent cirrus, thresholding the brightness temperature gives ambiguous results.
10
We investigated the possibility of using the optical thickness as the ordinate instead of the reflectivity. This option has four drawbacks, because the optical thickness:
– can only be retrieved if a cloud model is assumed – is more sensitive to the viewing geometry
– is more sensitive to 3D radiative transfer effects
15
– is very sensitive to the calibration of the instrument
Especially, if the scattering angle is close to a specific feature in the phase function, such as the cloud bow, the relation between optical thickness and reflectivity varies strongly with viewing geometry. This causes additional spread in the scatter plot.
4. Discussion and Conclusion
20
A method was introduced to define and select the most representative cloud particle model for analysis of passive instrument radiances at a visible and near-infrared wave-length bands. In this study, eleven cloud particle models were used, that were different in thermodynamic phase and in particle size. The approach compares measured re-flectivity with values from tables of pre-calculated rere-flectivity at 0.67 and 1.6 µ. The
ACPD
3, 4461–4488, 2003 Cloud particle classification from meteorological satellitesD. Jolivet and A. J. Feijt
Title Page Abstract Introduction Conclusions References Tables Figures J I J I Back Close Full Screen / Esc
Print Version Interactive Discussion
© EGU 2003
ratio of reflectivity at 0.67 over 1.6 µ is plotted versus the reflectivity at 0.67 µ for a wide range of optical thickness, which results in a curve in the scatter plot. All cloud types show clearly different curves. Comparison of the measurements with the pre-calculated curves yields the identification of a cloud particle model that is most representative for the observed cloud field. The cloud type model contains information on the
thermody-5
namic phase and size of the cloud particles. The representative cloud model can be used to calculate accurately higher order cloud properties, such as optical thickness, emissivity and cloud water path.
The method was tested for two cases from ATSR measurements in 1996, which included low water clouds, thick cirrus and thin, semi-transparent cirrus, which were
10
clearly identified. This proves the principle of the approach.
The limitations of this study are mainly in the cloud model adopted for calculations. One single plane parallel and homogeneous layer was assumed while in-situ obser-vations have shown vertical variation of the particle size (Brenguier et al, 2000). The variations in particle density may cause 3D scattering effects like shadows and
tun-15
neling (Davies, 1984; Breon, 1992). Furthermore, there may be several cloud layers within the analysis area, which hampers our statistical approach.
The method that was presented in this paper can be applied to radiances from any passive imager that has sufficient spatial resolution and narrow spectral channels at a visible wavelength and one at 1.6 µ. Examples are the ATSR and the NOAA AVHRR
20
series from number 15 up. Application to the Spinning Enhanced Visible and Infrared Radiometer, SEVERI, onboard the Meteosat Second Generation geo-stationary plat-forms will yield information on cloud thermodynamic phase and particle size every 15 minutes at a 3×3 km2 spatial resolution. The method was used extensively in the CLIWANET-project and is the basis to the algorithm for AVHRR and SEVIRI radiances
25
ACPD
3, 4461–4488, 2003 Cloud particle classification from meteorological satellitesD. Jolivet and A. J. Feijt
Title Page Abstract Introduction Conclusions References Tables Figures J I J I Back Close Full Screen / Esc
Print Version Interactive Discussion
© EGU 2003
References
Arking, A. and Childs, J. D.: Retrieval of cloud cover parameters from multi-spectral satellite images, J. Climate Appl. Meterol., 24, 322–333, 1985.
Barkstrom, B. R. and Smith. G. L.: The Earth Radiation Budget Experiment: Science and implementation, Rev. Geophys. 24, 379–390, 1986.
5
Baum, B. A., Soulen, P. F., Strabala, K. I., King, M. D., Ackerman, S. A., Menzel, W. P., and Yang, P.: Remote sensing of cloud properties using MODIS Airborne Simulator imagery during SUCCESS. II. Cloud thermodynamic phase, J. Geophys. Res., 105 (D9), 11 781– 11 792, 2000.
Brenguier, J.-L., Pawlowska, H., Schuller, L., Preusker, R., Fischer, J., and Fouquart, Y.: Ra-10
diative properties of boundary layer clouds: Droplet effective radius versus number concen-tration, J. Atm. Sci., 57, 803–821, 2000.
Breon, F. M.: Reflectance of broken cloud fields: simulation and parameterization, J. Atm. Sci., 49, 1221–1232, 1992.
Cess, R. D., Potter, G. L., Blanchet, J.-P., Boer, G. J., DelGenio, A. D., Deque, M., Dymnikov, V., 15
Galin, V., Gates, W. L., Ghan, S. J., Kiehl, J. T., Lacis, A. A., Le Treut, H., Li, X., Liang, Z.-X., McAveney, B. J., Meleshko, V. P., Mitchell, J. F. B., Morcrette, J.-J., Randall, D. A, Rikus, L., Roekner, E., Royer, J.-F., Schlese, U., Scheinin, D. A., Slingo, A., Sokolov, A. P., Taylor, K. E., Washington, W. M., Wetherald, R. T., Yagai, I., and Zhang, M. H.: Intercomparison and interpretation of climate feedback processes in 19 general circulation models, J. Geophys. 20
Res., 95, 16 601–16 615, 1990.
Cess, R. D., Zhang, M.-H., Ingram, W. J., Potter, G. L., Alekseev, V., Barker, H. W., Cohen-Solal, E., Colman, R. A., Dazlich, D. A., DelGenio, A. D., Dix, M. R., Dymnikov, V., Esch, M., Fowler, L. D., Fraser, J. R., Galin, V., Gates, W. L., Jack, J. J., Kiehl, J. T., Le Treut, H., Lo, H. K.-W., McAveney, B. J., Meleshko, V. P., Morcrette, J.-J., Randall, D. A., Roeckner, E., Royer, 25
J.-F., Schlesinger, M. E., Sporyshev, P. V., Timbal, B., Volodin, E. M., Taylor, K. E., Wang, W., and Wetherald, R. T.: Cloud feedback in atmospheric general circulation models: An update, J. Geophys. Res., 101D, 12 791–12 794, 1996.
Davies, R.: Reflected solar radiances from nroken cloud scenes and the interpretation of scan-ner measurements, J. Geophys. Res., 89, 1259–1266, 1984.
30
Deirmendjian, D: Electromagnetic scattering on spherical polydispersions, American Elsevier Sci., New York, 290 pp., 1969.
ACPD
3, 4461–4488, 2003 Cloud particle classification from meteorological satellitesD. Jolivet and A. J. Feijt
Title Page Abstract Introduction Conclusions References Tables Figures J I J I Back Close Full Screen / Esc
Print Version Interactive Discussion
© EGU 2003
Deschamps, P. Y., Breon, F.-M., Leroy, M., Podaire, A., Bricaud, A., Buriez, J.-C. and Seze, G.: The POLDER mission: instrument characteristics and scientific objectives, IEEE Trans. Geosci. Remote Sensing, 32, 598–615, 1994.
Feigelson, E. M.: Radiation in a cloudy atmosphere, D. Reidel, Norwell, Mass., 293 pp, 1984. Feijt, A., Jolivet, D., and van Meijgaard, E.: Quantitative cloud analysis using AVHRR for CLI-5
WANET, Boreal Environment Research, 7, 265–271, 2002.
Gates, W. L., Boyle, J. S., Covey, C., Dease, C. G., Doutriaux, C. M., Drach, R. S., Fiorino, M., Gleckler, P. J., Hnilo, J. J., Marlais, S. M., Phillips, T. J., Potter, G. L., Santer, B. D., Sperber, K. R., Taylor, K. E., and Williams, D. N.: An overview of the results of the Atmospheric Model Intercomparison Project (AMIP I), Bull. Amer. Meteorol. Soc., 80, 29–56, 1999.
10
Haan, J. F. de, Bosma, P., and Hovenier, J. W.: The adding method for multiple scattering calculations of polarized light, Astron. Astrophys., 183, 371–391, 1987.
Han, Q., Rossow, W. B., and Lacis, A. A.: Near-global survey of effective droplet radii in liquid water clouds using ISCCP data, J. Climate, 7, 465–497, 1994.
Hess, M., Koelemeijer, R. B. A., and Stammes, P.: Scattering matrices of imperfect hexagonal 15
ice crystals, J. Quant. Spectrosc. Radiat. Transfer, 60(3), 301–308, 1998.
Intergovernmental Panel on Climate Change (IPCC): IPCC Second Scientific Assesment of Climate Change, Houghton, J. T., Meira Filho, L. G., Callander, B. A., Harris, N., Katenberg, A., and Marskell, K. (Eds), Cambridge Univ. Press, Cambrige, UK, 572 pp., 1995.
King, M. D., Kaufman, Y. J., Menzel, W. P., and Tanre, D.: Remote sensing of cloud aerosol 20
and water vapor properties from the MODerate Resolution Imaging Spectrometer (MODIS), IEEE, Trans. Geosci. Remote Sensing, 30, 2–27, 1992.
Knap, W. H., Hess, M., Stammes, P., Koelemeijer, R. B. A., and Watts, P. D.: Cirrus optical thick-ness and crystal size retrieval from ATSR-2 data using phase function of imperfect hexagonal ice crystals, J. Geophys. Res., 104, 31 721–31 730, 1999.
25
Krupp, C.: Holographic measurements of ice crystals in cirrus clouds during ICE 89. Report of the 4th ICE/EUCREX Workshop, 1991.
Liou, K. N.: Influence of cirrus clouds on weather and climate processes: a global perspective, Mon. Wea. Rev., 29, 524–536, 1986.
Macke, A., Mueller, J., and Raschke, E., Single scattering properties of atmospheric ice crys-30
tals, Journal of Atmosp. Sciences, 53, 2813–2825, 1996
Meijgaard E. van, Konings, J. A., Feijt, A. J., and van Lammeren, A. C. A. P.: Comparison of model predicted cloud cover profiles with observations from ground and satellite,
Meteorolo-ACPD
3, 4461–4488, 2003 Cloud particle classification from meteorological satellitesD. Jolivet and A. J. Feijt
Title Page Abstract Introduction Conclusions References Tables Figures J I J I Back Close Full Screen / Esc
Print Version Interactive Discussion
© EGU 2003
gische Zeitschrift, 9.1, 21–30, 2000.
Mitchell, J. F. B.: The “greenhouse” effect and climate change, Rev. Geophysic., 27, 115–139, 1989.
Nakajima, T. Y. and King, M. D.: Determination of the optical thickness and effective particle radius of clouds from reflected solar measurements. Part. I: Theory, J. Atm. Sci., 47, 1878– 5
1893, 1990.
Nakajima T. Y. and Nakajima, T.: Wide area determination of cloud microphysical properties from NOAA-AVHRR measurements for FIRE and ASTEX regions, J. Atm. Sci., 52, 4043– 4059, 1995.
Pruppacher, H. R. and Klett, J. D.: Microphysics of clouds and precipitation, D. Reichel Publ. 10
Co, Dordrecht, Holland, 714pp, 1978.
Ramanathan, V., Cess, R. D., Harrison, E. F., Minnis, P., Barkstrom, B. R., Ahmad, E., and Hartmann, D.: Cloud radiative forcing and climate: results of the Earth Radiation Budget Experiment, Science, 243, 57–63, 1989.
Rossow, W. B. and Schiffer, R. A.: ISCCP cloud data products, Bull. Amer. Meteorol. Soc., 72, 15
2–20, 1991.
Stammes, P.: Errors in UV reflectivity and albedo calculations due to neglecting polarisation, Proc. SPIE Int. Soc. Opt. Eng., 2311, 227–235, 1994.
Suttles, J. T., Green, R. N., Minnis, P., Smith, G. L., Staylor, W. F., Wielicki, B. A., Walker, I. J., Young, D. F., Taylor, V. R., and Stowe, L. L.: Angular Radiation Models for Earth-Atmosphere 20
systems. Volume I-Shortwave Radiation, NASA RP-1184, Vol. I., 147pp, 1988a.
Suttles, J. T., Green, R. N., Smith, G. L., Wielicki, B. A., Walker, I. J., Taylor, V. R., and Stowe, L. L.: Angular Radiation Models for Earth-Atmosphere systems. Volume II-Longwave Radiation, NASA RP-1184, Vol. II., 87 pp, 1988b.
Taylor, V. and Stowe, L. L.: Atlas of reflectance patterns for uniform earth and cloud Surfaces 25
from Nimbus-7 ERB, J. Geophys. Res., 89, 5345–5363, 1984.
Twomey, S. and Cocks, T.: Remote sensing of cloud parameters from spectral reflectances in the near-infrared, Beitr. Phys. Atmos., 62, 172–179, 1989.
World Climate Research Program: International Satellite Cloud Climatology Project (ISCCP) documentation of cloud data, WMO/TD-No. 266, 76 pp, 1988.
30
Watts, P. D.: Estimation of cloud droplet size, optical thickness and phase from the ATSR, IRS’96 Current problems in atmospheric radiation, Deepak. 578–582, 1996.
de-ACPD
3, 4461–4488, 2003 Cloud particle classification from meteorological satellitesD. Jolivet and A. J. Feijt
Title Page Abstract Introduction Conclusions References Tables Figures J I J I Back Close Full Screen / Esc
Print Version Interactive Discussion
© EGU 2003
rived from Meteosat Second Generation observations, EUMETSAT ITT-97/181, EUMETSAT, Darmstadt, 1998.
Wielicki, B. A., Barkstrom, B. R., Harrison, E. F., Lee III, R. B., Smith, G. L., and Cooper, J. E.: Clouds and the Earth’s Radiant Energy System (CERES); An Earth observing system experiment, Bull. Amer. Meteorol. Soc., 77, 853–868, 1996.
5
Woick, H., Schmetz, J., and Tjemkes, S.: An introduction to Meteosat Second Generation imagery and products, Proc. of the 1997 EUTMETSAT Meteorological Satellite Data Users Conference, Brussels, EUTMETSAT, Darmstad, 395–400, 1997.
ACPD
3, 4461–4488, 2003 Cloud particle classification from meteorological satellitesD. Jolivet and A. J. Feijt
Title Page Abstract Introduction Conclusions References Tables Figures J I J I Back Close Full Screen / Esc
Print Version Interactive Discussion
© EGU 2003
Table 1. Dimensions and aspect ratios of hexagonal ice crystals used in the present study. Symbols a and c indicate the half-length of the a axis and c axis, respectively. C/2a is the aspect ratio and D is the maximum crystal dimension. All sizes are in micrometers
C1 C2 C3
a 10 22 41
c 30 60 130
D 30 60 130
ACPD
3, 4461–4488, 2003 Cloud particle classification from meteorological satellitesD. Jolivet and A. J. Feijt
Title Page Abstract Introduction Conclusions References Tables Figures J I J I Back Close Full Screen / Esc
Print Version Interactive Discussion
© EGU 2003
Table 2. Value of the single scattering albedo for four values of the effective radius (the effective variance is equal to 0.15) of liquid water droplets distribution at two wavelengths (0.67 and 1.6 µm) Effective radius re ω0(λ=0.67 µm) ω0(λ=1.6 µm) 5 0.999998 0.996371 10 0.999997 0.992896 15 0.999996 0.989713 20 0.999996 0.986740
ACPD
3, 4461–4488, 2003 Cloud particle classification from meteorological satellitesD. Jolivet and A. J. Feijt
Title Page Abstract Introduction Conclusions References Tables Figures J I J I Back Close Full Screen / Esc
Print Version Interactive Discussion
© EGU 2003
Table 3. Value of the single scattering albedo for spherical ice particles (with varying effective radius and an effective variance of 0.25) and imperfect hexagonal ice crystals (C1, C2 and C3) at 0.67 µm and 1.6 µm ω0(0.67 µm) ω0(1.6 µm) re=5 µm 0.999998 0.987916 re=10 µm 0.999997 0.975811 re=15 µm 0.999997 0.965038 re=20 µm 0.999996 0.956151 C1 1.0 0.9698231 C2 1.0 0.9290541 C3 1.0 0.8255315
ACPD
3, 4461–4488, 2003 Cloud particle classification from meteorological satellitesD. Jolivet and A. J. Feijt
Title Page Abstract Introduction Conclusions References Tables Figures J I J I Back Close Full Screen / Esc
Print Version Interactive Discussion © EGU 2003 0.0 0.2 0.4 0.6 0.8 1.0 R(0.67 µ m) 1.0 10.0 100.0 Optical Thickness re=4µm re=10µm re=16µm re=10µm (ice) C2
Fig. 1. Reflectivity at 0.67 µm versus the optical thickness for different value of the liquid water effective radius, for an ice sphere (re=10 µm) and the ice model C2. Calculations are made for
a zenith solar angle of 43.3◦, a viewing zenith angle of 90 and a relative azimuth angle of 114◦. The surface reflectivity is assumed to be lambertian and is equal to 5%.
ACPD
3, 4461–4488, 2003 Cloud particle classification from meteorological satellitesD. Jolivet and A. J. Feijt
Title Page Abstract Introduction Conclusions References Tables Figures J I J I Back Close Full Screen / Esc
Print Version Interactive Discussion © EGU 2003 0.0 0.1 0.2 0.3 0.4 0.5 0.6 0.7 0.8 R(1.6 µ m) 1.0 10.0 100.0 Optical Thickness re=4µm re=10µm re=16µm re=10µm (ice) C1 C2 C3
Fig. 2. Reflectivity at 1.6 µm versus the optical thickness for three values of the effective ra-dius of the liquid water droplet, three different sizes of the imperfect hexagonal crystal and an ice sphere (re=10 µm). The surface is assumed to be lambertian and its reflectance is 5%. Calculations are made for the same geometry as Fig. 1.
ACPD
3, 4461–4488, 2003 Cloud particle classification from meteorological satellitesD. Jolivet and A. J. Feijt
Title Page Abstract Introduction Conclusions References Tables Figures J I J I Back Close Full Screen / Esc
Print Version Interactive Discussion © EGU 2003 1.0 2.0 3.0 4.0 5.0 6.0 7.0 8.0 9.0 R(0.67 µ m)/R(1.6 µ m) 0.0 0.2 0.4 0.6 0.8 1.0 R(0.67µm) re=4µm re=10µm re=16µm re=10µm (ice) C1 C2 C3
Fig. 3a. Variation of the ratio of the reflectivity at 0.67 µm to that at 1.6 µm (also noted Rvis/Rnir) versus the reflectivity at 0.67 µm for the different models of cloud particle. The surface reflec-tivity is assumed to be equal at 5% for both wavelengths. Calculations are made for the same geometry as Fig. 1.
ACPD
3, 4461–4488, 2003 Cloud particle classification from meteorological satellitesD. Jolivet and A. J. Feijt
Title Page Abstract Introduction Conclusions References Tables Figures J I J I Back Close Full Screen / Esc
Print Version Interactive Discussion © EGU 2003 1.0 1.5 2.0 2.5 3.0 3.5 4.0 4.5 5.0 R(0.67 µ m)/R(1.60 µ m) 0.0 0.1 0.2 0.3 0.4 0.5 0.6 0.7 R(0.67µm) re=4µm re=10µm re=16µm re=10µm (ice) C1 C2 C3
Fig. 3b. Variation of the ratio of the reflectivity at 0.67 µm to that at 1.6 µm (also noted Rvis/Rnir) versus the reflectivity at 0.67 µm for the different models of cloud particle. The surface reflec-tivity is assumed to be equal at 5% for both wavelengths. Calculations are made for a solar zenith angle is 72.0◦, a viewing zenith angle is 10.5◦, and a relative azimuth angle is 52.0◦.
ACPD
3, 4461–4488, 2003 Cloud particle classification from meteorological satellitesD. Jolivet and A. J. Feijt
Title Page Abstract Introduction Conclusions References Tables Figures J I J I Back Close Full Screen / Esc
Print Version Interactive Discussion
© EGU 2003
Fig. 4. ATSR-2 image over the Netherlands and the North Sea on 4 September 1996. The white square indicates the area of interest, which consists on a marine stratocumulus (52.05◦N, 3.75◦E).
ACPD
3, 4461–4488, 2003 Cloud particle classification from meteorological satellitesD. Jolivet and A. J. Feijt
Title Page Abstract Introduction Conclusions References Tables Figures J I J I Back Close Full Screen / Esc
Print Version Interactive Discussion © EGU 2003 0.6 0.7 0.8 0.9 1.0 1.1 1.2 1.3 1.4 1.5 R(0.67 µ m)/R(1.6 µ m) 0.0 0.1 0.2 0.3 0.4 0.5 0.6 0.7 0.8 R(0.67µm) re=4µm re=10µm
Fig. 5. Measured ratio of the reflectivity at 0.67 µm to that at 1.6 µm (Rvis/Rnir) versus the reflectivity at 0.67 µm (in black crosses). Solid lines are calculations for two different effective radii of liquid water particle. Viewing geometry is the same as for Fig. 1.
ACPD
3, 4461–4488, 2003 Cloud particle classification from meteorological satellitesD. Jolivet and A. J. Feijt
Title Page Abstract Introduction Conclusions References Tables Figures J I J I Back Close Full Screen / Esc
Print Version Interactive Discussion
© EGU 2003
Fig. 6. ATSR-2 image of cirrus clouds over the North Sea on 19 November 1996. The white square indicates the area of interest (52.55◦N, 3.38◦E).
ACPD
3, 4461–4488, 2003 Cloud particle classification from meteorological satellitesD. Jolivet and A. J. Feijt
Title Page Abstract Introduction Conclusions References Tables Figures J I J I Back Close Full Screen / Esc
Print Version Interactive Discussion © EGU 2003 240 250 260 1.0 1.4 1.8 2.2 2.6 3.0 3.4 R(0.67 µ m)/R(1.6 µ m) 0.0 0.1 0.2 0.3 0.4 0.5 0.6 0.7 R(0.67µm) re=16µm (liquid) C1 C2 C3 BT(10.8µm) in K
Fig. 7. Measured ratio of the reflectivity at 0.67 µm to that at 1.6 µm (Rvis/Rnir) versus the
reflectivity at 0.67 µm. Brightness temperature as measured with the 10.8 µm is in gray tones. Dashed curves are calculations for imperfect hexagonal ice crystals C1, C2 and C3. Solid curve is calculation for a liquid water droplet distribution with an effective radius of 10 µm At the center of the selected area, the solar zenith angle is 72.0◦, the viewing zenith angle is 10.5◦, and the relative azimuth angle is 52.0◦.