HAL Id: hal-00302696
https://hal.archives-ouvertes.fr/hal-00302696
Submitted on 24 Mar 2006
HAL is a multi-disciplinary open access
archive for the deposit and dissemination of
sci-entific research documents, whether they are
pub-lished or not. The documents may come from
teaching and research institutions in France or
abroad, or from public or private research centers.
L’archive ouverte pluridisciplinaire HAL, est
destinée au dépôt et à la diffusion de documents
scientifiques de niveau recherche, publiés ou non,
émanant des établissements d’enseignement et de
recherche français ou étrangers, des laboratoires
publics ou privés.
Precipitation Forecasting (QPF) in Southern Italy: a
preliminary study
S. Federico, E. Avolio, C. Bellecci, M. Colacino, R. L. Walko
To cite this version:
S. Federico, E. Avolio, C. Bellecci, M. Colacino, R. L. Walko. Application of the LEPS technique
for Quantitative Precipitation Forecasting (QPF) in Southern Italy: a preliminary study. Nonlinear
Processes in Geophysics, European Geosciences Union (EGU), 2006, 13 (1), pp.53-66. �hal-00302696�
www.nonlin-processes-geophys.net/13/53/2006/ © Author(s) 2006. This work is licensed under a Creative Commons License.
Nonlinear Processes
in Geophysics
Application of the LEPS technique for Quantitative Precipitation
Forecasting (QPF) in Southern Italy: a preliminary study
S. Federico1,2, E. Avolio1,3, C. Bellecci1,3, M. Colacino2, and R. L. Walko4
1CRATI Scrl, c/o University of Calabria, 87036 Rende (CS), Italy 2CNR-ISAC, via del Fosso del Cavaliere, 100, 00133 Rome, Italy
3University of Rome “Tor Vergata” Dept. STFE, via del Politecnico, 1, 00133 Rome, Italy 4Pratt School of Engineering, Duke University, Durham, NC, USA
Received: 7 June 2005 – Revised: 30 January 2006 – Accepted: 30 January 2006 – Published: 24 March 2006
Abstract. This paper reports preliminary results for a
Lim-ited area model Ensemble Prediction System (LEPS), based on RAMS (Regional Atmospheric Modelling System), for eight case studies of moderate-intense precipitation over Cal-abria, the southernmost tip of the Italian peninsula. LEPS aims to transfer the benefits of a probabilistic forecast from global to regional scales in countries where local orographic forcing is a key factor to force convection.
To accomplish this task and to limit computational time in an operational implementation of LEPS, we perform a cluster analysis of ECMWF-EPS runs. Starting from the 51 members that form the ECMWF-EPS we generate five clusters. For each cluster a representative member is selected and used to provide initial and dynamic boundary conditions to RAMS, whose integrations generate LEPS. RAMS runs have 12-km horizontal resolution.
To analyze the impact of enhanced horizontal resolution on quantitative precipitation forecasts, LEPS forecasts are compared to a full Brute Force (BF) ensemble. This ensem-ble is based on RAMS, has 36 km horizontal resolution and is generated by 51 members, nested in each ECMWF-EPS member.
LEPS and BF results are compared subjectively and by objective scores. Subjective analysis is based on precipita-tion and probability maps of case studies whereas objective analysis is made by deterministic and probabilistic scores. Scores and maps are calculated by comparing ensemble pre-cipitation forecasts against reports from the Calabria regional raingauge network.
Results show that LEPS provided better rainfall predic-tions than BF for all case studies selected. This strongly suggests the importance of the enhanced horizontal resolu-tion, compared to ensemble popularesolu-tion, for Calabria for these cases.
Correspondence to: S. Federico
To further explore the impact of local physiographic fea-tures on QPF (Quantitative Precipitation Forecasting), LEPS results are also compared with a 6-km horizontal resolution deterministic forecast. Due to local and mesoscale forcing, the high resolution forecast (Hi-Res) has better performance compared to the ensemble mean for rainfall thresholds larger than 10 mm but it tends to overestimate precipitation for lower amounts. This yields larger false alarms that have a detrimental effect on objective scores for lower thresholds.
To exploit the advantages of a probabilistic forecast com-pared to a deterministic one, the relation between the ECMWF-EPS 700 hPa geopotential height spread and LEPS performance is analyzed. Results are promising even if addi-tional studies are required.
1 Introduction
Numerical Weather Prediction (NWP) model performance has noticeably improved in the last 15 years due to several reasons such as increased computer power, more detailed physical and numerical parameterizations, better processes formulation, and improvements in data assimilation. In ad-dition, the increase of computer power has enabled the use of a General Circulation Model (GCM) Ensemble Prediction System (EPS) in several meteorological centers around the world (Molteni et al., 1996; Houtemaker et al. 1996; Toth and Kalnay, 1994).
Despite these improvements, forecasting of highly local-ized and severe events is still a challenging problem in many areas, particularly where orographic features and mesoscale structures cannot be properly represented by GCM-EPS be-cause of its coarse horizontal resolution. At the time of this study, the ECMWF-EPS uses a T255L40 configuration that corresponds, for mid latitudes, to about 80-km horizontal res-olution. This resolution is not enough to represent orographic
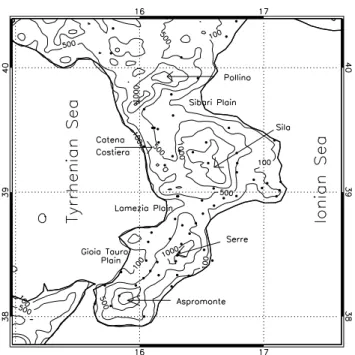
Fig. 1. Topography of Calabria averaged over 10 km2. Main features are also reported. Contours: 100 m, 500 m, 1000 m and 1400 m. Dots show raingauge locations.
forcing and mesoscale structures of Calabria, the southern-most tip of the Italian boot, where this study is focused.
Calabria ranges from 37◦550 to 40◦ North latitude and
15◦300to 17◦150East longitude (Fig. 1). The average width
of the region is about 300 km north to south and 50 km west to east. The Apennines run North to South and are char-acterized by five main topographical features that reach 1.5– 2.0 km in elevation: Pollino, Catena Costiera, Sila, Serre, and Aspromonte. The west coast of Calabria is bounded by the Tyrrhenian Sea. The east and south coasts are bounded by the Ionian Sea. Three main valleys are located near the sea: the Larnezia Plain and the Gioia Tauro Plain on the west, and the Sibari Plain on the east. Most of the region’s agricultural and industrial sites are located in these valleys.
There are three main goals of EPS: (a) improve forecast skill by averaging unpredictable components, thereby reduc-ing the impact of non-linear error growth; (b) evaluate fore-cast skill by relating it to the agreement among ensemble members; (c) provide an objective basis for casting the fore-cast in a probabilistic form.
In order to gain the advantages of EPS in a region like Cal-abria, the Limited area model Ensemble Prediction System (LEPS) approach is investigated for eight case studies. LEPS (Marsigli et al., 2001; Montani et al., 2003) aims to transport advantages of the ECMWF-EPS forecast at the mesoscale-regional scale by a limited area model to produce probabilis-tic forecasts. Nevertheless, currently-available computer re-sources are not sufficient to implement it in an operational framework. To reduce computing time, LEPS uses a cluster
technique (Molteni et al., 2001). In our study a hierarchical cluster analysis is implemented and used to reduce the whole ECMWF-EPS to five clusters. For each of them, a repre-sentative member (RM) is selected to force the multiscale, multipurpose meteorological model RAMS (Regional Atmo-spheric Modelling System, Pielke et al., 1992; Cotton et al., 2003). Distance between ensemble members is computed by considering four meteorological variables on three pres-sure levels. These meteorological discriminating variables are zonal and meridional wind components (u, v), relative humidity (RH) and geopotential height (Z) for pressure lev-els 850 hPa, 700 hPa and 500 hPa. Variables and levlev-els were selected by trial and error in order to transfer key synoptic scale features from cluster elements to representative mem-bers. This system is tested for eight storms that produced moderate-intense rainfall over Calabria.
The paper is organized as follows: Sect. 2 describes the methodology followed to generate clusters and RMs, Sect. 3 introduces model set-up, Sect. 4 presents the results along with the methodology followed to verify forecasts, and Sect. 5 gives conclusions.
2 The cluster methodology and LEPS approach
The methodology adopted to cluster the ECMWF-EPS mem-bers and to select the RM from each cluster was proposed by Molteni et al. (2001) and was adapted and used in Marsigli et al. (2001) and in Montani et al. (2003). In this study, we make minor changes to this methodology in order to better focus on the study area, which is the central Mediterranean basin, and to account for event duration. Our approach is as follows:
1. We begin with 51 clusters where each ECMWF-EPS member belongs to one cluster.
2. From t0+60 h to t0+84 h, where t0is the initial
simula-tion time, we compute the standardized anomalies of the discriminating variables (u, v, RH, Z) for three pressure levels (850 hPa, 700 hPa, 500 hPa).
3. We calculate the space-averaged quadratic distances be-tween all ECMWF-EPS members for each discrim-inating variable standardized anomaly and for each level. Distances are computed over a target area that, in our case, spans the central Mediterranean basin (5◦E–20◦E; 35◦N–45◦N).
4. Next, we calculate distances between different clus-ter elements, averaging standardized anomaly distances over all discriminating variables and levels. Distance between clusters is computed by averaging distances be-tween all cluster members.
5. The two clusters having the minimum distance are grouped together.
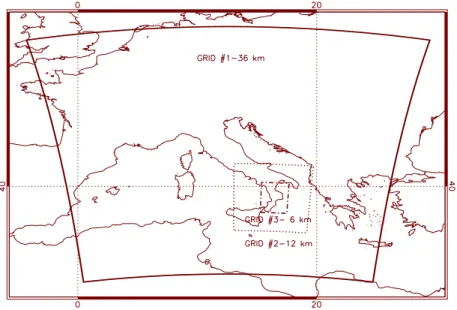
Fig. 2. Simulation domains. Horizontal grid resolutions are 36 km, 12 km, 6 km for first, second and third domain, respectively. We use first
domain for BF ensemble forecasts, first and second domains for LEPS simulations and all domains for Hi-Res forecasts.
6. Steps 4 and 5 are repeated until only five clusters re-main.
7. One RM is selected for each of the five clusters by mini-mizing the ratio between the distance from its own clus-ter members and the distance from members belonging to other clusters.
8. Finally, RAMS simulations are performed using RMs as initial and dynamic boundary conditions.
Compared to previous works (Molteni et al., 2001; Marsigli et al., 2001; Montani et al., 2003) this paper does not contain a new methodology. Nevertheless it presents new data for a different geographical area, using different horizontal resolu-tions and a different Limited Area Model (LAM). The effects of ensemble size reduction and enhanced horizontal resolu-tion are assessed for all case studies selected comparing the Brute Force (BF) and LEPS outputs, an experiment that has not been assessed so much in referenced works. Moreover the topic is of considerable current interest and there is a ten-dency in the NWP community toward very high horizontal resolution (<10 km). The value of very high horizontal res-olution modelling compared to LEPS has not been assessed and this paper adds new data and results by comparison be-tween High Resolution (Hi-Res) deterministic forecasts and LEPS results.
3 Model configuration and experimental procedure
In this paper we use RAMS 4.3 in its non-hydrostatic com-pressible form (Pielke et al., 1992; Cotton et al., 2003).
Figure 2 shows three domains which are used in this paper. Hereafter we will refer to these as domains #1, #2, and #3 and to their associated grids as the first, second and third grids.
The LEPS configuration has two nested grids with hori-zontal resolutions of 36 km and 12 km. They cover the two outermost domains of Fig. 2. Nested grids use a two-way communication method described in Walko et al. (1994), which scheme works as follows. Communication from the parent to the nested grid is accomplished immediately fol-lowing a time step on the parent grid which updates the prog-nostic fields. The updated coarse grid values are interpo-lated sequentially in the coordinate directions to the locations where they are defined on the boundaries of the nested grid. The nested grid boundary values are replaced by these inter-polated values. A nested grid usually runs with a shorter time step than the parent grid. Thus, its boundary values are also interpolated linearly in time from the coarse for intermedi-ate nested grid time steps. The nested grid is then updintermedi-ated in a series of smaller time steps until it has caught up to the simulation time of the parent grid. At this time the reverse communication is accomplished by averaging the prognos-tic variables over each set of nested grid cells which occupy a single parent grid cell and replacing the parent grid cell value with that average. This two-way communication en-sures a continuous balance between parent and nested mete-orological fields. Apart from specific differences in interpo-lating functions, the basic difference between one-way and two-way nesting is in the reverse communication which is not performed for the one-way nesting. Several numerical experiments performed with RAMS and other atmospheric models (Walko et al., 1994) show a significant improvement in the solution when two-way nesting is applied.
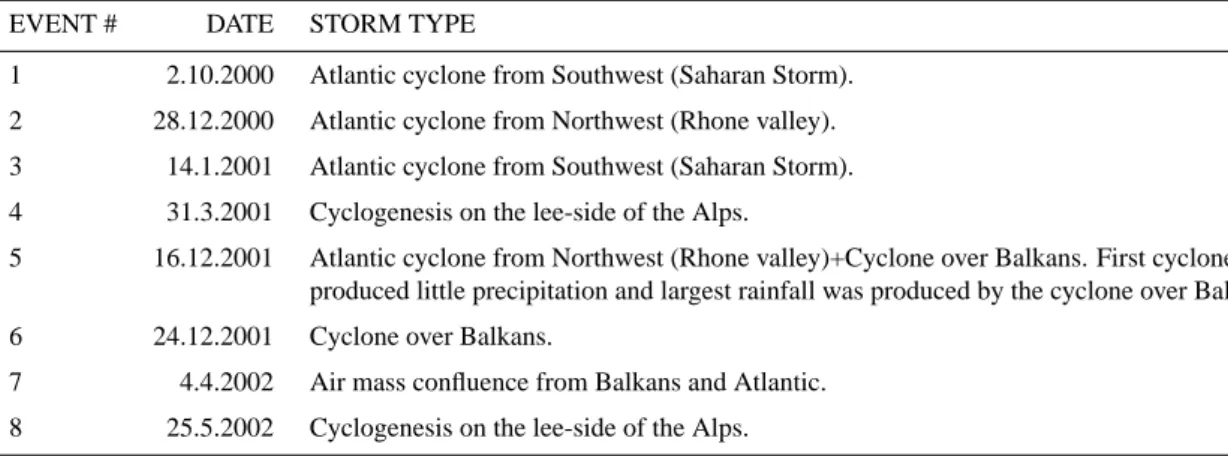
Table 1. Selected case studies.
EVENT # DATE STORM TYPE
1 2.10.2000 Atlantic cyclone from Southwest (Saharan Storm). 2 28.12.2000 Atlantic cyclone from Northwest (Rhone valley). 3 14.1.2001 Atlantic cyclone from Southwest (Saharan Storm). 4 31.3.2001 Cyclogenesis on the lee-side of the Alps.
5 16.12.2001 Atlantic cyclone from Northwest (Rhone valley)+Cyclone over Balkans. First cyclone produced little precipitation and largest rainfall was produced by the cyclone over Balkans. 6 24.12.2001 Cyclone over Balkans.
7 4.4.2002 Air mass confluence from Balkans and Atlantic. 8 25.5.2002 Cyclogenesis on the lee-side of the Alps.
In order to assess the improvements introduced by LEPS higher horizontal resolution, we compare its performance with the BF for all case studies selected in this paper. For BF, RAMS simulations have 36 km horizontal grid spacing and are nested in all 51 ECMWF-EPS runs. The BF domain is the same as the LEPS first grid. Even if LEPS accounts for cluster population, there is a large reduction of ECMWF-EPS members with this technique, so these simulations give an assessment of the relative impact on Quantitative Precipi-tation Forecasts (QPF) of enhanced horizontal resolution and ensemble size reduction.
Our definition of BF differs slightly from that adopted in previous papers where BF resolution is the same as LEPS. In our case BF uses the first LEPS grid only and the acronym BF refers to the fact that we are dealing with a full 51-member ensemble rather than to its resolution.
In addition to BF and LEPS forecasts, for each case study, we perform a high horizontal resolution deterministic run us-ing all domains shown in Fig. 2. Horizontal resolution for the third grid is 6 km.
We use thirty vertical levels up to 16 000 m in the ter-rain following coordinate system. Levels are not equally spaced: within the PBL (Planetary Boundary Layer) layers run about 50–200 m thick, whereas in the middle and upper troposphere they are 1000 m thick.
Parameterization of the surface water and energy budgets and fluxes with the atmosphere are described in Walko et al. (2000).
Non-convective precipitation is computed from explicit prognostic equations for eight water categories: total water, cloud particles, rain, pristine ice, snow, aggregates, graupel, and hail. Convective precipitation is parameterized following Molinari and Corsetti (1985) who proposed a simplified form of the Kuo scheme that accounts for updrafts and downdrafts. Convection parameterization is applied to the first grid only for BF, LEPS and Hi-Res.
Acceptable numerical resolution of deep convection re-quires a grid spacing not coarser than about 1 km, which im-plies that on coarser grids, such as used in the present study, some form of convective pameterization is needed. How-ever, existing convective parameterization schemes are de-signed for grid spacing larger than about 10 or 20 km and do not perform properly on meshes finer than this. The RAMS bulk microphysics parameterisation is designed to emphasize individual microphysical processes rather than the statistical end result of atmospheric systems and is intended to be ap-plicable to any atmospheric system (e.g. stratiform or con-vective clouds, tropical or arctic clouds etc.). However, for it to perform correctly for deep convection, the host dynamic model must adequately resolve the convective motion. As a consequence, a deficiency exists for adequately representing deep convection in this and other numerical models whose grid spacing is between about 1 and 10 to 20 km. For this rea-son, we did not activate convective parameterization on the second grid, and have instead relied on orographic lifting and vertical motion in resolved larger-scale systems to provide dynamic support for precipitating systems. This choice may limit the applicability of the results presented in this work to situations in which deep convective-scale motion is signifi-cant.
To verify forecasts, we use a subjective analysis and ob-jective scores. Subob-jective evaluation is done by a qualitative comparison, for selected case studies, of probability maps and total precipitation maps with raw data from the rain-gauge regional network. This is discussed in Sect. 4.1. Ob-jective verification is done computing obOb-jective probabilistic and deterministic scores from model output and raingauge measurements for all case studies. The methodology adopted to compute scores is discussed in Sect. 4.2.
Not all raingauges were working for all events, and the number of reporting stations ranges from 35 to 75 depending on the case study. Figure 1 shows raingauge locations.
Case studies are selected by requesting that at least 10 sta-tions reported more than 30 mm/day. The Calabria climate is rather dry, and from October 2000 to May 2002, the time frame covered by our database, we found eight case studies. They are reported in Table 1 and are associated with typical storms that produce large and widespread rainfall over Cal-abria.
In summary three kinds of RAMS simulations are per-formed for each case study: (a) BF that has one domain with 36 km horizontal resolution; (b) LEPS that has two two-way nested domains with 12 km maximum horizontal resolution; (c) Hi-Res that has three two-way nested domains and 6 km maximum horizontal resolution.
4 Results
4.1 Subjective analysis
In order to evaluate enhanced performance of LEPS due to its horizontal resolution, we use a subjective analysis for LEPS and BF for two case studies. These are an Atlantic cyclone from the southwest on 14 January 2001 (Event #3) and cyclo-genesis on the lee side of the Alps on 25 May 2002 (Event #8). The first case study is well represented by BF and by LEPS, while the second event is less satisfactory. These case studies are representative of the performance spread that is obtained for the events selected.
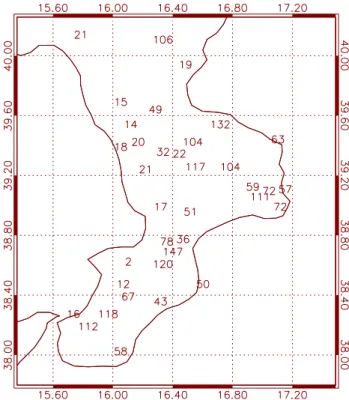
Figure 3 shows raingauge measurements for the 14 Jan-uary 2001 case study. Several stations reported more than 100 mm, and the maximum rainfall recorded is about 150 mm. There are two main effects produced by local orog-raphy on precipitation. First, rainfall is higher over elevated peaks as a consequence of the orographic uplift. Second, it is larger over the eastern half of Calabria due to the orographic shield. Indeed, for this storm, air masses crossed Calabria from South-East leaving more abundant rainfall on the up-wind slope of mountains. It is worth noting that almost all raingauges on the East side of Calabria reported more than 50 mm.
Figure 4a shows total precipitation simulated by BF con-sidering the whole event duration. This map reports the en-semble mean (EM). Because EM averages out small scale unpredictable detail, it does not show extreme precipitation totals. There is a large area where rainfall is greater than 10 mm. This area reflects the storm path that entered from the Strait of Gibraltar and then moved from west to east leaving a precipitation swath. During this kind of synoptic pattern evo-lution, a low pressure centre is well developed over the south-western Mediterranean basin and this configuration forces advection of warm and moist air masses from the south-east toward Calabrian Ionian coasts. This basic situation and the humid-warm advection are a rather common pattern in cases of intense and abundant precipitation over the Ionian Calabrian coast (Federico et al., 2003). Forecast rainfall is
Fig. 3. Raingauge measurements (mm) for 14 January 2001
(cu-mulated rainfall from 12 January – 23:00 UTC to 14 January – 22:00 UTC).
greater than 30 mm over eastern Calabria with some areas exceeding 50 mm.
Figure 4b shows precipitation for the same area as Fig. 4a but for the LEPS first grid and it shows EM too. For con-sistency we use the first LEPS grid output to derive precip-itation and probability fields and to plot these fields on the same BF subdomain. The effects of the inner LEPS grid are transferred to the parent grid by the two-way interactive nesting. Figure 4b shows the LEPS weighted mean precipi-tation and the weights are assigned according to RM cluster population. Due to the higher horizontal resolution and the two-way nesting, orographic forcing is better represented in LEPS, compared to BF, and a larger precipitation amount is simulated over eastern Calabria. In particular, for the second LEPS grid (not shown), rainfall is larger than 90 mm over the main peaks and in large areas of eastern Calabria.
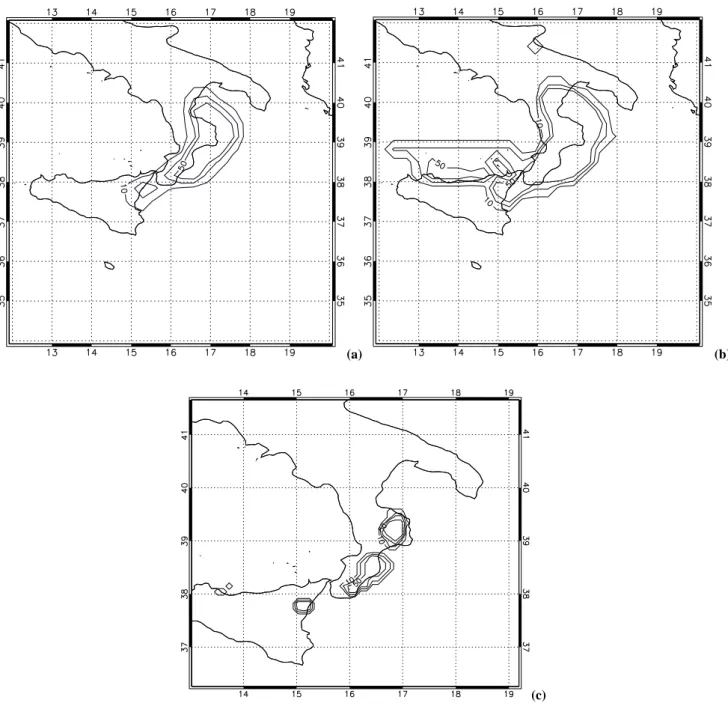
One of the key issues with EPS is to cast the forecast in a probabilistic form. Figures 5a and b show, respectively, the probability of precipitation larger than 50 mm for the BF and LEPS first grid, respectively. The LEPS probability is ob-tained weighting RM probabilities (0 or 1) according to clus-ter population. From Fig. 5a there are hints of large rainfall; probability larger than 50% is forecast for eastern Calabria and there is a clear suggestion of large precipitation amounts associated with this storm. Due to the higher horizontal res-olution and to the two-way nesting used in RAMS, the LEPS
(a)
(b)
Fig. 4. (a) BF EM precipitation for 14 January 2001 (cumulated
from 12 January – 23:00 UTC to 14 January – 22:00 UTC). Con-tours are for 10 mm, 30 mm and 50 mm. Simulations start on 11 Jan-uary 2001, 12:00 UTC. The map is plotted for a subdomain centred in Southern Italy for clarity. (b) As in Fig. 4a but for LEPS first grid ensemble weighted mean precipitation. Weights are assigned according to RM cluster population. The map is for LEPS first do-main and it is plotted for a subdodo-main centred in Southern Italy for clarity.
first grid, Fig. 5b, shows a probability larger than 50% over all eastern Calabria and LEPS gives an even clearer sugges-tion of the storm severity compared to BF.
To better appreciate the effects of enhanced horizontal res-olution on QPF for this severe event, we plot the probability of more than 100 mm rainfall for the LEPS second grid in Fig. 5c. Values greater than 50% and 80% are shown over Serre and Sila, respectively (see Fig. 1). Results compare well with measurements (Fig. 3) and give a good forecast of the storm severity. The BF forecast (not shown) over the same area gives values less than 10% everywhere. This re-sult highlights the role of local physiographic features and horizontal grid resolution for QPF over Calabria.
Even if, for this case study, there are evident signals of intense and abundant rainfall from BF, LEPS highlights bet-ter precipitation field features over Calabria, both in bet-terms of probability and total precipitation. Comparing Figs. 4a/5a and Figs. 4b/5b it is noticeable that LEPS gives significant precipitation around the North coast of Sicily. Unfortunately, data are not available to us to verify this point.
Figure 6 shows raingauge measurements for 25 May 2002. Larger amounts were recorded in eastern and southern Cal-abria and over two of the five mountainous areas (Serre and Aspromonte). This reflects again the shield effect due to oro-graphic barriers and rainfall uplift enhancement. Indeed, dur-ing the storm evolution, air masses crossed Calabria mainly from the southeast so larger precipitation was recorded on the upwind side of the mountains and over the main peaks.
Despite the storm intensity, BF and LEPS performances are unsatisfactory for this event. In particular the BF-EM precipitation map (not shown) has values less than 10 mm over Calabria. Probabilities of rainfall larger than 10 mm and 20 mm are, respectively, less than 20% and 10% over the peninsula, so the BF approach gives no signal for this severe case study.
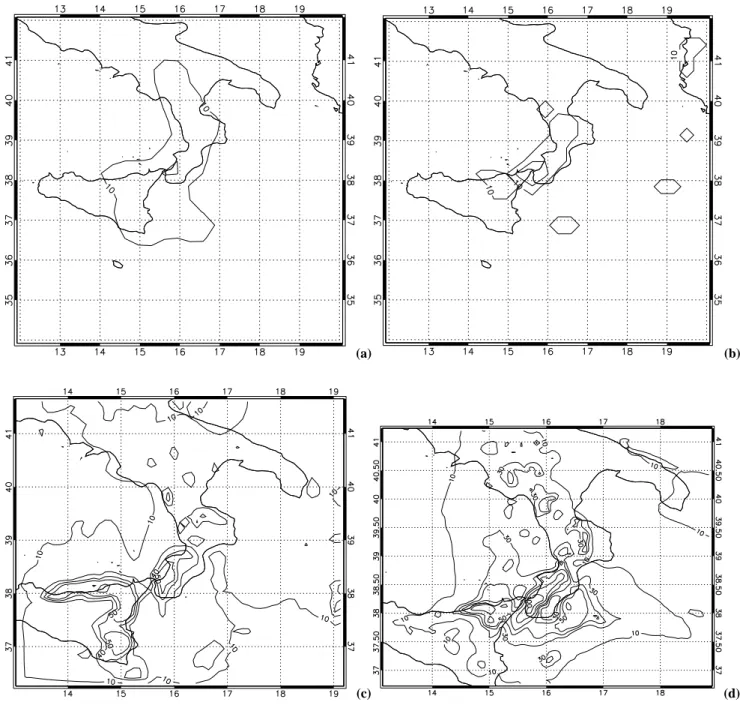
LEPS results are also unsatisfactory, but there are im-provements due to the enhanced horizontal resolution. Fig-ure 7a shows the LEPS first grid cumulated precipitation. Contours are for 10 mm and 30 mm. Values larger than 30 mm are forecast over southern Calabria and values larger than 10 mm are predicted almost everywhere over the penin-sula. Hints for a moderate storm come also from Fig. 7b that reports the probability of precipitation larger than 30 mm. Values greater than 30% are forecast for southern Calabria.
It is worth noting that the LEPS second grid has clearer and more defined signals for a moderate-intense event. In particular, the probability of more than 30 mm (not shown) is larger than 50% over southern Calabria and Sila; moreover, for the LEPS second grid, the probability map for 50 mm threshold (not shown) indicates values greater than 10% over southern Calabria. Apart from larger values simulated by the LEPS second grid, it is also important to note that structures and mesoscale patterns are more refined for the LEPS second grid, information that would be useful to the forecaster.
(a) (b)
(c)
Fig. 5. (a) BF probability of more than 50 mm rainfall for 14 January 2001. Contours are reported for 10%, 30% and 50%. Precipitation
has been cumulated from 12 January – 23:00 UTC to 14 January – 22:00 UTC. Simulations start on 11 January 2001 – 12:00 UTC. The map is plotted for a subdomain centred in Southern Italy for clarity. (b) As in Fig. 5a but for LEPS first grid. RM precipitation has been cumulated from 12 January – 23:00 UTC to 14 January – 22:00 UTC. Weights are assigned to RM probability fields (0 or 1) according to cluster population. Simulations start on 11 January – 12:00 UTC. The map is for LEPS first domain and is plotted for a subdomain centred in Southern Italy for clarity. (c) As in Fig. 5b but for LEPS second grid and for 100 mm threshold. Contours: 10%, 30%, 50%, 80%.
To further explore the role of enhanced horizontal reso-lution for this case study and to make better use of LEPS simulations when severe events are suspected to occur, we show the maximum for the LEPS second grid in Fig. 7c. This map can be useful to the skilled forecaster but must be used carefully because in operations it can lead to overestimation.
Precipitation larger than 50 mm is forecast over southern Calabria where the map is much more representative of storm severity compared to Fig. 7a. At the same time this result shows that LEPS-EM cannot be expected to repre-sent extreme precipitation totals because EM averages out small scale unpredictable components. This point must be
Fig. 6. Raingauge measurements (mm) for 25 May 2002
(cumu-lated from 23 May – 23:00 UTC to 25 May – 22:00 UTC).
considered when comparing LEPS-EM and Hi-Res objective scores in the next subsection. Despite the better representa-tion of storm severity there is still an evident rainfall under-estimation.
Comparison of LEPS results and raingauge measurements shows that simulated precipitation is underestimated, mainly for higher thresholds. However, compared to BF, LEPS gives suggestion of a moderate-intense event.
Precipitation amounts and the convective environment are better forecast by Hi-Res. Figure 7d shows total rainfall for this simulation. Precipitation is larger than 70 mm over south-western Calabria, mainly due to orographic uplift of Serre and Aspromonte, and more than 100 mm are forecast on the North-West side of Aspromonte. Performance is less satisfactory for the northern half of Calabria where rainfall is lower than 50 mm. For this area performance is compa-rable with LEPS maximum precipitation. Note that with its enhanced horizontal resolution, Hi-Res captures better than LEPS the mesoscale and finer scale structures, such as the shielding effect of Serre and Aspromonte and the precipita-tion pattern over Sila and Catena Costiera, giving results that are closer to observations.
The behaviour discussed for the above two case studies is obtained for all events; i.e. there is a clear improvement of rainfall forecast fields when LEPS is compared to BF, both in terms of probability maps and total precipitation. Consid-ering also that CPU time required to run LEPS is less than for
Table 2. Contingency table of possible events.
OBSERVED
YES NO
YES a b
FORECAST NO c d
BF, we conclude that, for our case studies, it is better to run a high resolution ensemble with fewer members than the whole BF. For cases with larger spread and for which local forcing is less important, BF performance should improve compared to LEPS and the impact of reduction of members should be larger. Our cases are limited to intense and abundant precip-itation where mesoscale and local scale play a fundamental role and horizontal grid resolution is a key factor for improv-ing the forecast.
4.2 Objective deterministic and probabilistic scores Although Calabria has a relatively dense raingauge network, the number of reporting stations and the terrain complexity do not allow for a reliable objective analysis of raingauge data. Therefore, we use the following methodology for the objective verification. First, remapping is performed for all RAMS configurations on a common 0.1◦×0.1◦grid follow-ing the procedure proposed by Baldwin (2000) and used at NCEP (National Centers for Environmental Prediction). The advantage of this method is that it can conserve precipitation to any degree of accuracy. Once remapped, the precipitation forecast is compared with raingauge measurements. Only grid boxes containing one or more raingauges are considered for the comparison. If more than one raingauge is located in a grid box, their average is considered for the comparison. All scores presented in this paper refer to the whole event, i.e. considering the total rainfall cumulated since the end of spin up time which is 11 h.
Objective scores for LEPS can be calculated starting from the precipitation field on the first or second grid; similarly, scores for Hi-Res can be calculated starting from the first, second or third grid outputs. In order to better represent the effect of enhanced horizontal resolution, we compute objec-tive scores reported in this subsection from the highest res-olution outputs, i.e., the second grid for LEPS and the third grid for Hi-Res. However, the two-way interactive nesting transfers local and mesoscale features from the inner to the parent grid and results are qualitatively similar for scores de-rived from different grids of the same model configuration.
An ensemble system can provide both deterministic and probabilistic forecasts. Indeed each ensemble member repre-sents a deterministic forecast but the whole ensemble can be used to compute probabilities and can be validated in terms
(a) (b)
(c) (d)
Fig. 7. (a) LEPS first grid ensemble weighted mean precipitation for 25 May 2002 (cumulated from 23 May – 23:00 UTC to 25 May –
22:00 UTC). Contours are for 10 mm and 30 mm. Simulations start on 22 May 2002, 12:00 UTC. The map refers to LEPS first domain and is plotted for a subdomain centred in Southern Italy for clarity. (b) LEPS first grid probability of more than 30 mm rainfall for 25 May 2002. Contours are reported for 10% and 30%. Precipitation has been cumulated from 23 May – 23:00 UTC to 25 May – 22:00 UTC. Weights are assigned to RM probability fields according to cluster population. Simulations start on 22 May 2002 – 12:00 UTC. The map refers to the LEPS first domain and is plotted for a subdomain centred in Southern Italy for clarity. (c) Maximum total rainfall for LEPS second grid for 25 May 2002. Precipitation has been cumulated from 23 May – 23:00 UTC to 25 May – 22:00 UTC and for each grid point the maximum among RMs has been selected. Contours are for 10, 30, 40 and 50 mm. (d) Hi-Res third grid precipitation forecast for 25 May 2002 (cumulated from 23 May – 23:00 UTC to 25 May – 22:00 UTC). Contours are reported for 10, 30, 40, 50, 70 and 100 mm.
of probabilistic scores. A thorough review of scores used in this paper can be found in Wilks (1995), Mason and Graham (1999) and Stanski et al. (1989).
Deterministic scores analyzed are the bias (BIA) and eq-uitable threat score (ETS). To compute these scores, precip-itation space is divided in four mutually exclusive and ex-haustive sets (contingency table, Table 2): hits (a) represent
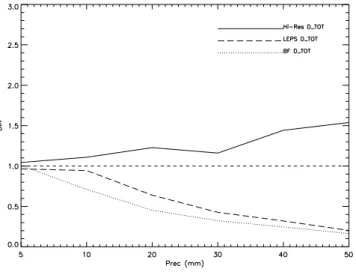
Fig. 8. BIA score for Hi-Res (solid line), LEPS (dashed line) and
BF (dotted line) as a function of rainfall threshold and averaged over all case studies. LEPS results are derived starting from second grid output, Hi-Res results are derived starting from third grid output. LEPS and BF are ensemble weighted means.
occasions where both rain forecasts and measurements are greater than or equal to a threshold; false alarms (b) rep-resent the number of locations where the model is above a threshold whereas measurement is under the same thresh-old; misses (c) represent occasions where the measurement is above a threshold and forecast is under the same thresh-old; correct no forecasts (d) represent occasions where the model and measurements are both under the threshold.
Starting from the contingency table we define BIA:
BI A = a + b a + c
BIA measures if the model over-forecasts or under-forecasts precipitation frequency over an area for a selected threshold. If BIA>1 the model overestimates the precipitation area, and if BIA<1 the model underestimates this area. For a perfect forecast BIA=1.
The most widely used score is Equitable Threat Score (ETS) defined as:
ET S = a − ar a + b + c − ar
where aris the expected number of correct forecasts
above the threshold in a random forecast where fore-cast occurrence/non-occurrence is independent from observation/non-observation. It is defined as:
ar =
(a + b)(a + c) a + b + c + d
For a perfect forecast ETS is equal to 1, while it is less than or equal to zero for a useless forecast.
Probabilistic scores used in this paper are relative operat-ing characteristic (ROC) area (Mason and Graham 1999) and
Brier score (Stanski et al., 1989; Wilks 1995). From con-tingency Table 2 we define HR (Hit Rate) and FAR (False Alarm Rate) as follows:
H R = (a+c)a F AR = (b+d)b
They represent, respectively, the proportion of events that were actually forecast and the proportion of non-events that were incorrectly forecast to occur. A useful measure for as-sessing the ability of probabilistic scores to discriminate di-chotomous events, and which has been proposed to compare deterministic and probabilistic systems, is the ROC that uti-lizes information from the contingency Table 2. For a prob-abilistic forecast, a set of contingency tables can be con-structed for a fixed threshold using different probabilities as decision criteria, ranging from 0% (i.e. an event is always forecast) to 100% (i.e. an event is never forecast). Plotting HR against FAR over the range of decision criteria forms the ROC. A perfect forecast system yields HR=1 and FAR=0, represented by the upper left corner of the ROC diagram. A completely unskillful forecast system is unable to distin-guish between event occurrence/non-occurrence (HR=FAR) and ROC lies along the diagonal from the point (0,0) to (1,1). Forecast quality is often summarized in terms of the area (A) under the ROC curve, with a skilful system having A significantly greater than 0.5.
The Brier score is defined as the average of squared differ-ences between forecast probabilities and the corresponding binary values representing occurrence/non-occurrence of the event. It is a negatively oriented score: for a perfect forecast BS is equal to zero.
It is not straightforward to summarize the performance of LEPS for the eight cases study considered in this paper by objective scores. The whole experimental setup is not large enough for a reliable statistical evaluation, and cases span sit-uations with different predictability. A statistical evaluation of the model setups utilized in this work will be the subject of future studies. Nevertheless, objective scores can be used to compare the relative performance of different model con-figurations reported in this paper. They are presented as av-erages over all case studies. Even if there is a spread among different cases, objective score averages give a summary of the performance of model setups and are useful to quantify their differences. However, results of this paper are drawn from individual cases and may not be applicable in different circumstances.
The reader should also be aware that scores presented in this paper refer to selected events characterized by moderate-intense precipitation that are not representative of the model general behaviour. Federico et al. (2004) reports perfor-mance for RAMS Hi-Res deterministic forecasts for a two year period. Nevertheless, objective scores reported for se-lected cases, such as moderate-intense precipitation, are use-ful to evaluate model setups under those conditions and help
Fig. 9. As in Fig. 8 for ETS. LEPS and BF are ensemble weighted
means.
to isolate key issues to be changed for a better forecast. The skilled forecaster has useful hints about the behaviour of a model setup from objective scores when a particular event (such as moderate-intense precipitation) is likely to occur. Thus, objective scores can be a valid tool to exploit in order to issue a better forecast even when they are computed for selected cases.
Figure 8 reports the BIA score for different rainfall thresh-olds for Hi-Res, LEPS and BF. With respect to this compar-ison for BIA and ETS (Figs. 8 and 9), notice that LEPS and BF curves do not show extreme precipitation totals because EM averages out small scale unpredictable components, and it is expected that the Hi-Res forecast will perform better at least for the largest thresholds. Figure 8 does indicate that Hi-Res has the best performance for thresholds larger than 20 mm, but LEPS-EM performs better for a 10 mm threshold. LEPS-EM underestimates precipitation amounts and this be-haviour is evident for precipitation larger than 10 mm. Hi-Res has the opposite behaviour, i.e. it overestimates precip-itation areas, mainly for larger thresholds. BF-EM has the worst performance and BIA values reflect the absence of lo-cal slo-cale and mesoslo-cale forcing that enhance rainfall through several mechanisms (Smith 1979; Federico et al., 2003).
Figure 9 shows results for the ETS score. We note that Hi-Res and LEPS-EM are useful (ETS>0) for all thresholds considered in this paper, and BF-EM has the worst perfor-mance. This confirms BIA results and shows that BF hori-zontal resolution is too coarse to represent regional physio-graphic features properly. Comparing Hi-Res and LEPS-EM, the former performs better for thresholds larger than 10 mm while LEPS-EM has a better score for the 10 mm threshold.
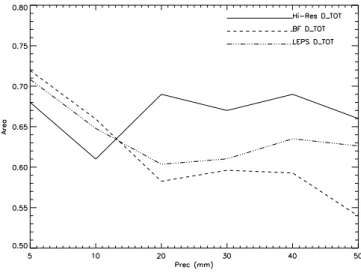
Figure 10 shows results for the ROC area. Main conclu-sions are similar to those discussed for ETS and BIA. In-deed BF horizontal resolution is too coarse to represent lo-cal physiographic forcing, and performance decreases with
Fig. 10. As in Fig. 8 for the ROC area. Results for LEPS are derived
from the second grid output. Hi-Res results are derived from the third grid output.
increasing rainfall. LEPS and BF have a comparable ROC area up to a 10 mm threshold. For larger thresholds LEPS outperforms BF. LEPS performs better than Hi-Res up to a 10 mm threshold, then its performance decreases and the score is better for Hi-Res.
Figure 11 shows the Brier Score for BF and LEPS as a function of rainfall threshold. LEPS always performs better than BF, and differences are larger for intermediate rainfall thresholds.
Previous results for objective scores confirm the need of higher resolution compared to currently available EPS for Calabria, in order to better represent mesoscale and local scale forcing.
We conclude this discussion on LEPS by considering the relationship between ensemble spread, quantified by the 700 hPa geopotential height, and LEPS performance. In-deed, one of the appealing EPS feature is its ability to relate forecast skill to the ensemble spread. Figure 12 shows the 700 hPa geopotential spread, i.e. the standard deviation from EM, averaged over all EPS members, versus forecast time. Spread is computed from ECMWF-EPS members and little CPU time is required to quantify this parameter. Figure 12 suggests that case studies can be combined in three groups. The first one has the lowest spread and contains two cases: 28 December 2000 and 14 January 2001. The second group has the highest spread and contains the 16 December 2001 case study. The third group contains the remaining cases and has an intermediate spread.
The 14 January 2001 case was discussed in Sect. 4.1 and was classified as one of the best forecasts. It belongs to the first group. The 25 May 2002 case was also discussed in Sect. 4.1 and was considered less satisfactory. It belongs to the third group. A detailed analysis of contingency ta-bles and objective scores reveals that the best results are for
Fig. 11. Brier score for BF (dot-dashed line) and LEPS (solid line)
as a function of rainfall threshold and averaged over all case studies. Results for LEPS are derived from the second grid output.
Fig. 12. 700 hPa geopotential height spread for case studies as a
function of forecast time. Spread is derived from ECMWF-EPS members and is averaged over the LEPS target area: 5◦E–20◦E; 35◦N–45◦N.
28 December 2000 and 14 January 2001 cases, i.e. for the first group, while the worst forecast is for the 16 December 2001 case, i.e. the second group. For other cases, scores are similar. It follows that, for storms selected in this study, there is a clear relationship between ECMWF-EPS 700 hPa geopo-tential spreads and objective scores. This relationship will be investigated further in future studies.
4.3 Hi-Res and LEPS-EM intercomparison
Although there is a trend toward higher resolution numer-ical weather prediction, the value of very high-resolution modelling (here defined as <10 km grid spacing) compared
to other forecasting methodology as LEPS, has not been as-sessed. High resolution forecasting appears to be most useful for strongly forced convection (associated with fronts, topog-raphy, etc.) but without such forcing it can result in worse scores than a comparatively lower resolution forecast as re-ported in several studies (Brooks et al., 1992; Colle et al. 2000; Mass et al. 2002). Indeed, the use of high horizontal resolution forecasting usually improves structural definition of mesoscale and local scale features. Nevertheless objec-tive scores can be worse due to spatial and timing errors that are always present. In addition model performance can be reduced, as horizontal resolution increases, due to rainfall overprediction.
Considering objective scores reported in the previous sub-section, we can divide performance in two parts: for thresh-olds ≤10 mm, LEPS-EM performs better than Hi-Res, while for larger thresholds, Hi-Res is better.
For rainfall larger than 10 mm LEPS-EM gives too-low precipitation, and an inspection of the contingency table (not shown) shows that: a) hits are less for LEPS-EM than for Hi-Res; b) false alarms are less for LEPS-EM than Hi-Hi-Res; and c) misses are greater for LEPS-EM than for Hi-Res. Also more (less) hits results in higher (lower) objective scores whereas more (less) misses or false alarms results in lower (higher) objective scores. Indeed, scores are a “summary” of variations in contingency tables stated above. Compared to Hi-Res, for thresholds larger than 10 mm, hits decrease and misses increase, which has a negative impact on LEPS-EM objective scores that exceeds the benefits gained by the decrease in false alarms. This indicates that the precipitation forecast by LEPS-EM is too low for these thresholds and sug-gests that 12 km grid spacing, currently used by LEPS-EM, is too coarse to represent some important Calabria topographi-cal features.
For thresholds ≤10 mm, BIA and ETS results are better for LEPS-EM than for Hi-Res. Inspection of the contingency ta-ble (not shown) shows that this is related to Hi-Res rainfall overprediction. The Hi-Res forecast has more false alarms, fewer misses and more hits than LEPS-EM, however the in-crease in false alarms has a larger impact on scores even though the convective environment is better represented by the Hi-Res forecast.
In summary, with respect to LEPS-EM and Hi-Res fore-casts, we conclude that Hi-Res has better objective scores and gives a better representation of the convective environ-ment than LEPS-EM. Nevertheless, unavoidable timing and position errors can have a detrimental effect on scores for lower thresholds.
5 Conclusions
We investigated the possibility of forecasting severe weather events by the LEPS methodology over the Calabria Peninsula in southern Italy.
The aim of LEPS is to transfer advantages of probabilistic forecasting from global to regional scale where localized me-teorological systems can produce severe weather and dam-age. In order to accomplish this task, LEPS uses a limited area model with a much higher horizontal resolution com-pared to currently available global circulation model EPS.
To save computer time required to run the ensemble, LEPS uses a cluster methodology that, in our case, reduces the whole ECMWF-EPS to five RMs using a hierarchical cluster analysis. Post-processed maps and scores are computed by weighting RM fields according to their own cluster popula-tion.
The LEPS methodology, based on RAMS 4.3, was tested for eight case studies. Although we cannot draw any general conclusion due to the limited extent of our database, there are valuable suggestions for future work and for a LEPS opera-tional set-up.
Because of the higher spatial horizontal resolution, LEPS rainfall patterns are closer to the observations compared to the BF approach. This is due to a better representation of lo-cal slo-cale and mesoslo-cale forcing. Better LEPS performance is evident by subjective analysis and objective scores. Sub-jective analysis shows that when large scale forcing is prop-erly represented by ECMWF-EPS, both BF and LEPS per-formance are satisfactory. Nevertheless LEPS gives more detailed patterns, and precipitation amounts are closer to ob-servations. When large-scale forcing is not well forecast by ECMWF-EPS, BF and LEPS perform poorly. However, LEPS outperforms BF in this case because of the higher hori-zontal resolution, and it gives indications of moderate-severe weather, at least for case studies selected.
Objective scores, both deterministic and probabilistic, re-veal that LEPS outperforms BF for almost all thresholds and for all events. In particular, BF is inadequate to represent local scale and mesoscale forcing, and simulated rainfall is too low. This result poses questions on the utilization of global scale model EPS in regions such as Calabria where local scale and mesoscale forcing is associated with strongly forced convection, and the results of this work suggest that the use of limited area model EPS could be used to tackle this issue.
The relation between ensemble spread, quantified by the 700 hPa geopotential height and computed from ECMWF-EPS members to require little additional computational time, is strictly related to LEPS performance. Objective and sub-jective analyses reveal that case studies with lower spread have better QPFs, whereas events with comparatively larger spread are less satisfactory.
Hi-Res and LEPS-EM comparison shows that Hi-Res tends to overestimate rainfall, while LEPS-EM underesti-mates precipitation. LEPS-EM scores better for rainfall
≤10 mm but is worse for larger thresholds. For the cases of moderate-intense precipitation considered in this study, we conclude that Hi-Res has better performance. Thus, the use of a high resolution forecast, with grid spacing less than
10 km, is strongly recommended for Calabria and LEPS. Even higher resolution than used in the present study would be desirable since some mesoscale features were not properly represented.
On the other hand, LEPS gives additional information compared to Hi-Res that is very useful to forecasters. First, it casts the forecast in a probabilistic form, and second, it is able to relate forecast performance to the ensemble spread. We conclude that the optimal approach to forecasting for Cal-abria would be a hybrid in which LEPS forecasts provide probabilistic forecasts about large-scale evolution and fore-cast reliability, and a limited number of Hi-Res forefore-casts give a better representation for the largest precipitation amounts.
Despite the above conclusions, this study is preliminary and work is in progress to acquire data for other case studies in order to compute more reliable statistics.
Other aspects of the LEPS methodology need to be as-sessed. LEPS reduces ECMWF-EPS from 51 members to 5 RMs, although it takes into account the cluster population in the post processing stage. The impact of ensemble size re-duction needs to be carefully assessed for first and higher or-der moments. Previous studies with GCMs (Toth and Kalnay, 1997; Leith, 1974; Houtemaker and Derome, 1995) show that only minor improvement in forecast skill is obtained be-yond 10 members, but the spatial and temporal relationship between spread and error improves well beyond this limit. This is an open question in LEPS.
Our LEPS horizontal resolution is 12 km mainly to limit computational requirements for operational purposes. How-ever, the Hi-Res forecast has better objective scores and re-veals more detailed and defined mesoscale structures when a subjective analysis is performed. As computer power contin-ues to increase, LEPS with horizontal grid spacing less than 10 km will become feasible in the near future, and additional work will be required to find the best compromise between performance, LEPS RMs number, and horizontal resolution.
Acknowledgements. This work was realized in the framework of the project “Sviluppo di Distretti Industriali per le Osservazioni della Terra” funded by “Ministero dell’Universit`a e della Ricera Scientifica”. We are grateful to APAT – Dipartimento Tutela delle Acque Interne e Marine for raingauge data. We are grateful to the Italian Air Force and ECMWF for MARS database account. We are grateful to the reviewers for their thoughtful suggestions. Edited by: O. Talagrand
Reviewed by: K. Mylne and another referee
References
Baldwin, M. E.: QPF verification system documentation, http://www.emc.ncep.noaa.gov/mmb/ylin/pcpverif/scores/docs/ mbdoc/pptmethod.html, 2000.
Brooks, H. E., Doswell, C. A., and Maddox, R. A.: On the use of mesoscale and cloud-scale model in operational forecasting, Wea. Forecasting, 7, 120–132, 1992.
Colle, B. A., Mass, C. F., and Westrick, K. J.: MM5 precipitation verification over the Pacific Northwest during the 1997-99 cool seasons, Wea. Forecasting, 15, 137–154, 2000.
Cotton, W. R., Pielke, R. A. Sr., Walko, R. L., Liston, G. E., Tremback, C. J., Jiang, H., McAnelly, R. L., Harrington, J. Y., Nicholls, M. E., Carrio, G. G., and McFadden, J. P.: RAMS 2001: Current status and future directions, Meteor. Atm., 82, 5– 29, 2003.
Federico, S., Bellecci, C., and Colacino, M.: Quantitative precip-itation of the Soverato flood: the role of orography and surface fluxes. Nuov. Cim. C , 26 C, 7–22, 2003.
Federico, S., Avolio, E., Bellecci, C., Colacino, M., Lavagnini, A., Accadia C., Mariani, S., and Casaioli, M.: Three model inter-comparison for quantitative precipitation forecast over Calabria. Nuov. Cim. C, 26 C, 627–647, 2004.
Houtemaker, P. L. and Derome, J.: Methods for ensemble predic-tion, Mon. Wea. Rev., 123, 2181–2196, 1995.
Houtemaker, P. L., Derome, J., Ritchie, H., and Mitchell, H. L.: A systematic simulation approach to ensemble prediction, Mon. Wea. Rev., 118, 1429–1443, 1996.
Leith, C. E.: Theoretical skill of Monte Carlo forecasts, Mon. Wea. Rev., 102, 409–418, 1974.
Marsigli, C., Montani, A., Nerozzi, F., Paccagnella, T., Tibaldi, S., Molteni, F., and Buizza, R.: A strategy for high-resolution ensemble prediction, Part II: limited-area model experiments in four Alpine flood events, Quart. J. Roy. Meteor. Soc., 127, 2095– 2115, 2001.
Mason, S. J. and Graham, N. E.: Conditional probabilities, rela-tive operating characteristics and relarela-tive operating levels, Wea. Forecasting, 14, 713–725, 1999.
Mass, C. F., Ovens, D., Westrick, K., and Colle, B. A.: Does in-creasing horizontal resolution produce more skilful forecast ? Bull. Am. Met. Soc., 83, 407–430, 2002.
Molinari, J. and Corsetti, T.: Incorporation of cloud-scale and mesoscale down-drafts into a cumulus parametrization: results of one and three-dimensional integrations, Mon. Wea. Rev., 113, 485–501, 1985.
Molteni, F., Buizza, R., Marsigli, C., Montani, A., Nerozzi, F., and Paccagnella, T.: The ECMWF Ensemble Prediction System: Methodology and validation, Quart. J. Roy. Meteor. Soc., 122, 73–119, 1996.
Molteni, F., Buizza, R., Marsigli, C., Montani, A., Nerozzi, F., and Paccagnella, T.: A strategy for high-resolution ensemble pre-diction, Part I: definition of representative members and global model experiments, Quart. J. Roy. Meteor. Soc., 127, 2069– 2094, 2001.
Montani, A., Marsigli, C., Nerozzi, F., Paccagnella, T., Tibaldi, S., and Buizza, R.: The Soverato flood in Southern Italy: perfor-mance of a global and limited-area ensemble forecasts, Nonlin. Proc. Geophys., 10, 261–274, 2003.
Pielke, R. A., Cotton, W. R., Walko, R. L., Tremback, C. J., Lyons, W. A., Grasso, L. D., Nicholls, M. E., Murran, M. D., Wesley, D. A., Lee, T. H., and Copeland, J. H.: A comprehensive meteo-rological modelling system-RAMS, Meteorol. Atmos. Phys., 49, 69–91, 1992.
Smith, R. B.: The influence of mountains on the atmosphere, Ad-vances in Geophysics, 21, Academic Press, 87–230, 1979. Stanski, H. R., Wilson, L. J., and Burrows, W. R.: Survey of
com-mon verification methods in meteorology. WMO World Weather Watch Tech. Report, 8, 1989.
Toth, Z. and Kalnay, E.: Ensemble forecasting at NMC: the gen-eration of perturbations, Bull. Am. Met. Soc., 125, 2317–2330, 1994.
Toth, Z. and Kalnay, E.: Ensemble forecasting at NCEP and the breeding method, Mon. Wea. Rev., 125, 3297–3319, 1997. Walko, R. L., Tremback, C. J., Pielke, R. A., and Cotton, W. R: An
interactive nesting algorithm for stretched and variable nesting ratio, J. Appl. Met., 34, 994–999, 1994.
Walko, R. L., Cotton, W. R., Meyers, M. P., and Harrington, J. Y.: New RAMS cloud microphysics parameterization part I: the single-moment scheme, Atmos. Research, 38, 29–62, 1995. Walko, R. L., Band, L. E., Baron, J., Kittel, T. G., Lammers, R., Lee,
T. J., Ojima, D., Pielke, R. A. Sr., Taylor, C., Tague, C., Trem-back, C. J., and Vidale, P. L.: Coupled Atmosphere-Biosphere-Hydrology Models for environmental prediction, J. Appl. Met., 39, 931–944, 2000.
Wilks, D. S.: Statistical methods in the atmospheric sciences, Aca-demic Press, San Diego, CA, USA, 1995.