HAL Id: hal-00297796
https://hal.archives-ouvertes.fr/hal-00297796
Submitted on 30 Nov 2005HAL is a multi-disciplinary open access
archive for the deposit and dissemination of sci-entific research documents, whether they are pub-lished or not. The documents may come from teaching and research institutions in France or abroad, or from public or private research centers.
L’archive ouverte pluridisciplinaire HAL, est destinée au dépôt et à la diffusion de documents scientifiques de niveau recherche, publiés ou non, émanant des établissements d’enseignement et de recherche français ou étrangers, des laboratoires publics ou privés.
Methane emission and consumption at a North Sea gas
seep (Tommeliten area)
H. Niemann, M. Elvert, M. Hovland, B. Orcutt, A. Judd, I. Suck, J. Gutt, S.
Joye, E. Damm, K. Finster, et al.
To cite this version:
H. Niemann, M. Elvert, M. Hovland, B. Orcutt, A. Judd, et al.. Methane emission and consumption at a North Sea gas seep (Tommeliten area). Biogeosciences Discussions, European Geosciences Union, 2005, 2 (4), pp.1197-1241. �hal-00297796�
BGD
2, 1197–1241, 2005 Control of methane efflux at the Tommeliten seep area H. Niemann et al. Title Page Abstract Introduction Conclusions References Tables Figures J I J I Back Close Full Screen / EscPrint Version Interactive Discussion EGU Biogeosciences Discussions, 2, 1197–1241, 2005 www.biogeosciences.net/bgd/2/1197/ SRef-ID: 1810-6285/bgd/2005-2-1197 European Geosciences Union
Biogeosciences Discussions
Biogeosciences Discussions is the access reviewed discussion forum of Biogeosciences
Methane emission and consumption at a
North Sea gas seep (Tommeliten area)
H. Niemann1,2, M. Elvert3, M. Hovland4, B. Orcutt5, A. Judd6, I. Suck2, J. Gutt2, S. Joye5, E. Damm2, K. Finster7, and A. Boetius1,8
1
Max Planck Institute for Marine Microbiology, 28359 Bremen, Germany 2
Alfred Wegener Institute for Polar and Marine Research, 27515 Bremerhaven, Germany 3
Research Center Ocean Margins, University of Bremen, 28334 Bremen, Germany 4
Statoil, 4001 Stavanger, Norway 5
University of Georgia, Athens, Georgia 30602-3636, USA 6
Wilderspool House, High Mickley, Stocksfield, Northumberland, NE43 7LU, UK 7
University of Aarhus, 8000 Aarhus, Denmark 8
International University Bremen, 28759 Bremen, Germany
Received: 1 August 2005 – Accepted: 16 August 2005 – Published: 30 August 2005 Correspondence to: H. Niemann ([email protected])
BGD
2, 1197–1241, 2005 Control of methane efflux at the Tommeliten seep area H. Niemann et al. Title Page Abstract Introduction Conclusions References Tables Figures J I J I Back Close Full Screen / EscPrint Version Interactive Discussion
EGU
Abstract
The North Sea hosts large coal, oil and gas reservoirs of commercial value. Natural leakage pathways of subsurface gas to the hydrosphere have been recognized during geological surveys (Hovland and Judd, 1988). The Tommeliten seepage area is part of the Greater Ekofisk area, which is situated above the Tommeliten Delta salt diapir
5
in the central North Sea. In this study, we report of an active seep site (56◦29.900N, 2◦59.800E) located in the Tommeliten area, Norwegian Block 1/9, at 75 m water depth. Here, cracks in a buried marl horizon allow methane to migrate into overlying clay-silt and sandy sediments. Hydroacoustic sediment echosounding showed several vent-ing spots coincidvent-ing with the apex of marl domes where methane is released into the
10
water column and potentially to the atmosphere during deep mixing situations. In the vicinity of the gas seeps, sea floor observations showed small mats of giant sulphide-oxidizing bacteria above patches of black sediments and carbonate crusts, which are exposed 10 to 50 cm above seafloor forming small reefs. These Methane-Derived Au-thigenic Carbonates (MDACs) contain13C-depleted, archaeal lipids indicating previous
15
gas seepage and AOM activity. High amounts of sn2-hydroxyarchaeol relative to ar-chaeol and low abundances of biphytanes in the crusts give evidence that ANaerobic MEthane-oxidising archaea (ANME) of the phylogenetic cluster ANME-2 were the po-tential mediators of Anaerobic Oxidation of Methane (AOM) at the time of carbonate formation. Small pieces of MDACs were also found subsurface at about 1.7 m
sedi-20
ment depth, associated with the Sulphate-Methane Transition Zone (SMTZ). The SMTZ of Tommeliten is characterized by elevated AOM and Sulphate Reduction (SR) rates, increased concentrations of13C-depleted tetraether derived biphytanes, and specific bacterial Fatty Acids (FA). Further biomarker and 16S rDNA based analyses give ev-idence that AOM at the Tommeliten SMTZ is mediated by archaea belonging to the
25
ANME-1b group and Sulphate Reducing Bacteria (SRB) most likely belonging to the Seep-SRB1 cluster. The zone of active methane consumption was restricted to a dis-tinct horizon of about 20 cm. Concentrations of13C-depleted lipid biomarkers (e.g. 500
BGD
2, 1197–1241, 2005 Control of methane efflux at the Tommeliten seep area H. Niemann et al. Title Page Abstract Introduction Conclusions References Tables Figures J I J I Back Close Full Screen / EscPrint Version Interactive Discussion
EGU ng g-dw−1biphythanes, 140 ng g-dw−1fatty acid ai-C15:0), cell numbers (1.5×10⁸cells
cm−3), AOM and SR rates (3 nmol cm−3d−1) in the SMTZ are 2–3 orders of magnitude lower compared to AOM zones of highly active cold seeps such as Hydrate Ridge or the Gulf of Mexico.
1. Introduction
5
Hydrocarbon seepage in the ocean has been known for more than thirty years, but the contribution of this process to the global methane budget and the carbon cycle are not well constrained. Upwelling of hydrocarbon-rich geofluids from subsurface reservoirs to the hydro- and atmosphere could be a relevant process in the global carbon cycle, especially with regard to emissions of the greenhouse gas methane. Gas seepage
10
from temperate shallow shelf seas is likely to contribute to methane emissions to the atmosphere, because of the seasonal deep mixing of the water column reaching the gas plumes above active seeps. The main challenge in constraining methane emission from the ocean is the need for quantitative estimates of the abundance and activity of cold seeps of ocean margins. As part of the OMARC cluster (Ocean Margin
Deep-15
Water Research Consortium) of the 5th framework program of the European Commis-sion, the project METROL (Methane flux control in ocean margin sediments) has been investigating methane fluxes from seep systems of the central and northern North Sea. Here we present results from biogeochemical and microbiological investigations of the Tommeliten seep area (56◦29.900N, 2◦59.800E) in the central North Sea. This and
20
other active cold seeps have been detected during pipeline route and site surveys by oil companies (Hovland and Sommerville, 1985). Cold seeps have been reported from various geographic and geological settings (Judd, 2003). Once initiated, cold seeps may continuously emit gas, but they become inactive if subsurface gas and fluids are depleted, or undergo phases of dormancy where the shallow reservoir is recharged
25
and none or little seepage occurs (C¸ ifc¸i et al., 2003; Hovland and Judd, 1988). In the particular case of the central North Sea, thermogenic methane is produced in Jurassic
BGD
2, 1197–1241, 2005 Control of methane efflux at the Tommeliten seep area H. Niemann et al. Title Page Abstract Introduction Conclusions References Tables Figures J I J I Back Close Full Screen / EscPrint Version Interactive Discussion
EGU sediments (Hovland and Judd, 1988). In the Tommeliten area, the enclosing
sedimen-tary rocks have been pierced by a buried salt diapir, the so called Delta Structure, at about 1 km depth below sea floor (b.s.f.). As a result, the methane reservoir lacks a proper seal and disturbances on seismic profiles indicate that free gas migrates in sediments above the diapir to the sea floor (Hovland, 2002; Hovland and Judd, 1988).
5
Previous expeditions to the Tommeliten seepage area with remotely operated vehi-cles (ROVs) documented streams of single methane bubbles of a thermogenic origin (−45.6‰ vs. Pee Dee Belemnite), small patches of filamentous, microbial mats and MDACs that outcrop on the sea floor (Hovland and Judd, 1988; Hovland and Som-merville, 1985; Thrasher et al., 1996). Such observations are typical for active seep
10
systems, which have been found at passive and active continental margins.
High fluxes of methane usually lead to the development of methanotrophic microbial communities. Anaerobic methanotrophic archaea dominate submarine seep communi-ties, because they profit from the abundance of sulphate utilised as an electron accep-tor for AOM (Hinrichs and Boetius, 2002; Reeburgh, 1996). High AOM activities lead
15
to high fluxes of sulphide and the development of microbial mats of giant sulphide-oxidizing bacteria (e.g. Beggiatoa sp.) and other thiotrophic organisms (Boetius and Suess, 2004; and literature therein). Furthermore, methane venting at various cold seeps is associated with the precipitation of MDACs which often contain lipid biomark-ers of AOM communities (Bohrmann et al., 1998; Diaz-del-Rio et al., 2003; Hovland et
20
al., 1985, 1987; Michaelis et al., 2002; Peckmann et al., 1999; Roberts and Aharon, 1994; Thiel et al., 2001). The phylogenetic origin of methanotrophic communities has been determined using combinations of lipid analysis and 16S rDNA methods in sev-eral methane seep environments (Boetius et al., 2000; Elvert et al., 1999; Hinrichs et al., 1999; Hoehler and Alperin, 1996; Knittel et al., 2003, 2005; Michaelis et al., 2002;
25
Orphan et al., 2001b). Previous works identified two groups of ANME-archaea, which are phylogenetically related to methanogens (Methanosarcina sp.). Both ANME-1 and ANME-2 occur in consortia with relatives of a SRB cluster (Seep-SRB1) within the
BGD
2, 1197–1241, 2005 Control of methane efflux at the Tommeliten seep area H. Niemann et al. Title Page Abstract Introduction Conclusions References Tables Figures J I J I Back Close Full Screen / EscPrint Version Interactive Discussion
EGU biology of a variety of shallow water cold seeps have been well investigated, there is
still very little known on the biogeochemistry and relevance of microbial methane con-sumption (Barry et al., 1996, 1997; Bian et al., 2001; Bussmann et al., 1999; Dando and Hovland, 1992; Garcia-Garcia et al., 2003; Thomsen et al., 2001). The aim of this investigation was to study microbial processes related to methane seepage in shelf
5
sediments. The main tasks were to reveal the distribution and identity of methan-otrophic microorganisms, the zonation and magnitude of methane oxidation and to analyse the impact of methane venting on a sandy benthic habitat of the North Sea.
2. Materials and methods
2.1. Field observations
10
Visual observations of the Tommeliten sea floor were carried out with a Remotely Op-erated Vehicle (ROV “Sprint 103” of the Alfred Wegener Institute of Polar and Marine Research) during a cruise with R/V Heincke in June 2002 (HE-169) and with a towed video camera in October 2002 (HE-180). Gas flares in the water column were detected with a SES-2000 echosounder operated at different frequencies in the range of 10 to
15
100 kHz. The same parametric echosounder was used for high-resolution sub-bottom profiling at frequencies between 8 and 15 kHz. Video and echosounder images were used to select positions for sediment sampling.
2.2. Sample collection and storage
Sediment samples were collected by vibrocoring (Institute of Baltic Sea Research)
20
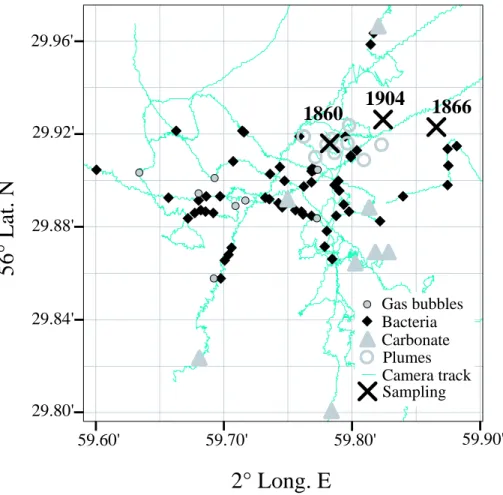
during the cruise HE180 in October 2002. Three cores were recovered from seep areas (core 1860, 1866, 1904, Fig. 1) and one from a reference station (core 1867). Upon recovery, cores were sectioned in 1 m pieces and kept in their plastic bags during subsampling of porewater constituents (methane, sulphate, sulphide) and turnover rate
BGD
2, 1197–1241, 2005 Control of methane efflux at the Tommeliten seep area H. Niemann et al. Title Page Abstract Introduction Conclusions References Tables Figures J I J I Back Close Full Screen / EscPrint Version Interactive Discussion
EGU measurements of methane and sulphate. Replicate subsamples were obtained from
a 10 cm section every 10 (cores 1866 and 1904) or 20 cm (core 1860). Samples for lipid biomarkers, cell counts and DNA were collected from the same 10 cm sections of core 1904. Sediment samples for lipid analysis were transferred into pre-cleaned glass vials and stored at −25◦C until extraction. Sediments for microbiological analysis were
5
fixed for Fluorescent In Situ Hybridisation (FISH) or frozen for DNA extraction. Pieces of MDACs were collected from the SMTZ at station 1904 and stored at −25◦C until extraction. MDACs from the surface of the sea floor were collected earlier during a ROV expedition in 1998 (Hovland, 2002). Detailed protocols for the following methods can be obtained fromhttp://www.metrol.org.
10
2.3. Methane concentrations
Methane concentrations from selected sediment horizons were determined according to the “head space” method from 5 ml sediment fixed with 25 ml NaOH (2.5%, w/v) in gas-tight glass vials as described previously (Treude et al., 2003). Immediately after sub-sampling, methane concentrations were determined on board using a gas
15
chromatograph as described elsewhere (Treude et al., 2003). 2.4. Sulphate concentrations
5ml of wet sediment were fixed in 50 ml corning vials with 25 ml zinc acetate solution (20%, w/v). After vigorous shaking, sediment particles were separated by centrifu-gation and filtration. Sulphate concentrations were determined from an aliquot of the
20
supernatant using a Waters HPLC system (Waters 512 HPLC pump, I.C.-Pak anion-column (Waters; WAT007355) 4.6×50 mm, Waters 730 conductivity detector). Isoph-talic acid (1 mM) was used as a solvent at a constant flow rate of 1 ml min−1. Sulphate concentrations were corrected for porosity, which was determined according to Treude et al. (2003).
BGD
2, 1197–1241, 2005 Control of methane efflux at the Tommeliten seep area H. Niemann et al. Title Page Abstract Introduction Conclusions References Tables Figures J I J I Back Close Full Screen / EscPrint Version Interactive Discussion
EGU 2.5. Sulphide concentrations
Total sulphide concentrations were determined using a combination of a WTW Mul-tiline P4 multi meter equipped with a WTW pH/ION 340i ion meter with two coupled electrodes (WTW Ag 500/WTW Ag/S 5001) for S2− concentration measurements and a WTW SenTix 41-3 electrode for pH measurements. The S2−measuring section was
5
calibrated against standards of H2S/HS−/S2−at pHs of 6, 7, 8 and 9. 2.6. Ex situ AOM and SR measurements
Subsamples for turnover rate measurements were collected from core 1904 by plug-ging glass tubes (1×6 cm) into a defined sediment horizon of ca. 10 cm (n=5 for AOM and SR, respectively) as described previously (Treude et al., 2005 and references
10
therein). To prevent gas exchange, the tubes were sealed with butyl rubber stoppers and only briefly opened for radiotracer injection, i.e. 50 µl14C-labelled methane and 5 µl35S-labelled sulphate (tracer dissolved in water, 10 kBq and 50 kBq, respectively). Sediment samples were incubated on board at in situ temperature (4◦C) for 24 h in the dark. After incubation, AOM and SR samples were fixed like the methane and sulphate
15
samples (see above). Further processing of AOM and SR samples was performed ac-cording to Treude et al. (2003) and references therein. Turnover rates were calculated according to the following equations:
AOM= 14 CO2 14CH 4+ 14CO2 × conc. CH4 i ncubat. T i me (1) SRR= TRI 35 S 35SO2− 4 + TRI 35S × conc. SO2−4 i ncubat. T i me (2) 20
Here, 14CO2, 35SO2−4 and TRI35S are the activities (Bq) of carbon dioxide, sulphate and total reduced sulphur species, respectively, whereas conc. CH4and conc. SO2−4
BGD
2, 1197–1241, 2005 Control of methane efflux at the Tommeliten seep area H. Niemann et al. Title Page Abstract Introduction Conclusions References Tables Figures J I J I Back Close Full Screen / EscPrint Version Interactive Discussion
EGU are the concentrations of methane and sulphate at the beginning of the incubation.
2.7. In vitro potential rates
The applied subsampling techniques of this work have been proven useful for muddy sediments (Treude et al., 2003). To test the suitability for sandy sediments, we com-pared short-term AOM and SR measurements with long-term in vitro measurements
5
(1 wk) of sediments collected from three horizons (surface, at the sulphide peak, and deep horizons) according to a modified method of Nauhaus et al. (2002). For this study, 20 ml sediment slurries were incubated with radio-labelled methane and sulphate (n=5 for AOM and SR, respectively). The slurries consisted of 1 cm3 fresh sediment and methane saturated (1.4 mM), artificial sea water media with 28 mM sulphate (Widdel
10
and Bak, 1992). As a control, slurries from one horizon (100-150 cm, core 1904) were incubated without methane. After incubation, sediment slurries were processed like those from short-term incubations.
2.8. Extraction of sediment and MDAC samples and preparation of derivatives The extraction procedure and preparation of Fatty Acid Methyl Esters (FAMEs) was
15
carried out according to Elvert et al. (2003). Briefly, total lipid extracts (TLE) were ob-tained from ca. 25 g of wet sediment collected from core 1904 and from two MDAC pieces (one collected from the surface of the sea floor and one from the SMTZ in core 1904). Prior to extraction, the MDAC pieces were disintegrated with HCL (2M). The TLE was extracted by subsequent ultrasonification using organic solvents of
decreas-20
ing polarity. Internal standards of known concentration and carbon isotopic composi-tions were added prior to extraction. Esterified Fatty Acids (FAs) present in glyco- and phospholipids were cleaved by saponification with methanolic KOH-solution. After ex-traction of the neutral lipid fraction from this mixture, FAs were methylated for analysis with BF3in methanol yielding FAMEs.
25
BGD
2, 1197–1241, 2005 Control of methane efflux at the Tommeliten seep area H. Niemann et al. Title Page Abstract Introduction Conclusions References Tables Figures J I J I Back Close Full Screen / EscPrint Version Interactive Discussion
EGU a SPE silica glass cartridge (0.5 g packing). Prior to separation, the column was
rinsed with 15 ml n-hexane/dichloromethane (95:5, v/v). After application of the neutral fraction, solvent mixtures of increasing polarity were subsequently added: (I) 5 ml n-hexane/dichloromethane (95:5, v/v), (II) 5 ml n-n-hexane/dichloromethane (2:1, v/v) and (III) 5 ml dichloromethane/acetone (9:1, v/v). Neutral lipid fractions (hydrocarbons (I),
5
ketones (II) and alcohols (III), respectively) were collected and concentrated to 100 µl using rotary evaporation. Finally, neutral lipid fractions were stored at −20◦C until fur-ther processing and/or analysis. Alcohols were analysed as trimethylsilyl (TMS) efur-thers. Shortly before analysis (<1 wk), aliquots from selected alcohol fractions were dried un-der a stream of nitrogen. 100 µl pyridine and 50 µl bis(trimethylsilyl)triflouracetamid
10
were added and the reaction was carried out for 1 h at 70◦C. After cooling, excess sol-vent was evaporated and the remaining TMS adducts were re-suspended in 50 µl of
n-hexane. TMS adducts were stored at −20◦C until Gas Chromatography (GC) and Gas Chromatography-Mass Spectrometry (GC-MS) analysis.
Sediments and the two MDAC pieces were additionally analysed for the content of
15
tetraether lipids. Tetraether lipids, which are contained in the alcohol fractions, were subjected to ether cleavage through HI treatment as reported previously yielding phy-tanes and biphyphy-tanes which can be analysed by GC, GC-MS and GC Isotope Ra-tio Mass Spectrometry (GC-IRMS) analysis (Blumenberg et al., 2004; Kohnen et al., 1992). Briefly, 500 µl HI (57%) and 500 µl acetic acid (100%) were added to a dried
20
alcohol fraction and iodisation of ether bonds was promoted at 110◦C for 4 h. After cool-ing, alkyl iodides were extracted with n−hexane. Excess iodine was removed by adding sodium thiosulphate solution (5%, w/v in water). Subsequently, the hexane phase was removed and dried. Alkyl iodides were reduced to alkanes in 0.5 ml of tetrahydrofu-rane (THF) by adding lithium-aluminium hydride (2 spatula tips). Reduction of iodides
25
was carried out at 110◦C for 3 h. After cooling, excess lithium-aluminium hydride was deactivated by the addition of deionised water. The supernatant solvent phase was removed, dried and stored at −20◦C.
BGD
2, 1197–1241, 2005 Control of methane efflux at the Tommeliten seep area H. Niemann et al. Title Page Abstract Introduction Conclusions References Tables Figures J I J I Back Close Full Screen / EscPrint Version Interactive Discussion
EGU 2.9. Preparation of Dimethyl Disulphide (DMDS) adducts
Double bond positions of monoenoic FAs were determined by analysis as DMDS adducts according to previously reported methods (Moss and Lambert-Fair, 1989; Nichols et al., 1986). Briefly, an aliquot of a selected sample (dissolved in 50 µl
n−hexane) was treated with DMDS (100 µl) and iodine-diethyl ether solution (20µl,
5
6% w/v). Formation of DMDS adducts was carried out at 50◦C for 48 h. After cooling, excess iodine was reduced with sodium thiosulphate (5% w/v in water). The organic phase was removed, dried and stored at −20◦C.
2.10. Gas Chromatography, Gas Chromatography-Mass Spectrometry, Gas Chromatography-Isotope Ratio Mass Spectrometry
10
Concentrations, identities and stable carbon isotope ratios of individual compounds were determined by GC, GC-MS and GC-IRMS analyses, respectively. Instrument specifications and operation modes of the GC, GC-MS and GC-IRMS systems were set according to Elvert et al. (2003). Concentrations were calculated against internal standards. Identities of acquired mass spectra were compared to known standards
15
and published data. The chemical structure of biphytanes are reviewed in Schouten et al. (1998): monocyclic biphytane reported here equals compound IV and bicyclic biphytane compound V. Stable carpon isotope ratios are given in the δ-notation against PDB. δ13C-values of FAs and alcohols were corrected for the introduction of additional carbon atoms during derivatisation. Internal standards were used to monitor precision
20
and reproducibility during measurements. Reported δ13C-values have an analytical error of 1–2‰.
2.11. Cell counts and fluorescence in situ hybridisation
Selected sediment samples from core 1904 were fixed with 2% formaldehyde and stored at 4◦C until further analysis. Total cell numbers were quantified with the aid
BGD
2, 1197–1241, 2005 Control of methane efflux at the Tommeliten seep area H. Niemann et al. Title Page Abstract Introduction Conclusions References Tables Figures J I J I Back Close Full Screen / EscPrint Version Interactive Discussion
EGU of epifluorescence microscopy after staining the cells with Acridine Orange according
to Knittel et al. (2003). Sediments from above, below and within the SMTZ were anal-ysed for the presence of archaea and bacteria by FISH with Horseradish Peroxidase (HRP)-labelled oligonucleotide probes and tyramide signal amplification (CARD-FISH) according to the method of Pernthaler et al. (2002). The CARD-FISH probes used
5
in this study were EUB338, ARCH915 and ANME1-350, purchased from biomers.net GmbH, Ulm, Germany. Oligonucleotide probes and instrument specification are pre-sented in Knittel et al. (2005). Briefly, after 2 hours fixation at 4◦C, formaldehyde fixed sediments were washed with 1×PBS (10 mM sodium phosphate, 130 mM NaCl) and stored in 1×PBS/EtOH (1:1) at −20◦C. These samples were diluted 1:10, treated by
10
sonification and filtered on 0.2 µm GTTP polycarbonate filters. Prior to filtration, filters were coated with agarose to prevent cell loss. In addition to ultrasonification, cells were permeabilised with lysozyme solution for 1 h at 37◦C and subsequently hybridised with HRP labelled probe for 2 h at 35◦C. Finally, filters were incubated for 15 min in tyramide solution labelled with the fluorochrome Cy-3.
15
2.12. DNA extraction and clone library construction
Total community DNA was directly extracted from ca. 5 g of wet sediment from the SMTZ of core 1904 according to Zhou et al. (1996). Crude DNA was purified with the Wizard DNA Clean-Up Kit (Promega, Madison, WI). Almost full-length archaeal and bacterial 16S rRNA genes from the extracted chromosomal DNAs were amplified
us-20
ing primers 20f (Massana et al., 1997) and Uni1392R (Lane et al., 1985) for archaea and GM3F (Muyzer et al., 1995) and GM4R (Kane et al., 1993) for bacteria. Poly-merase chain reactions (PCRs) were performed with a Mastercycler Gradient (Eppen-dorf, Hamburg, Germany) as described previously (Ravenschlag et al., 1999), except that the annealing temperature was 58◦C and 42◦C for archaea and bacteria,
respec-25
tively. PCR products of several reactions were combined and purified with the QiaQuick PCR Purification Kit (Qiagen, Hilden, Germany). DNA was ligated in the pGEM T-Easy vector (Promega, Madison, WI) and transformed into E. coli TOP10 cells (Invitrogen,
BGD
2, 1197–1241, 2005 Control of methane efflux at the Tommeliten seep area H. Niemann et al. Title Page Abstract Introduction Conclusions References Tables Figures J I J I Back Close Full Screen / EscPrint Version Interactive Discussion
EGU Carlsbad, CA) according to the manufacturer’s recommendations. Sequencing was
performed by Taq cycle sequencing with a model ABI1377 sequencer (Applied Biosys-tems) with insert-specific and vector primers. The absence of chimeric sequences in the clone libraries was verified with the CHIMERA CHECK program of the Ribo-somal Database Project II (http://rdp.cme.msu.edu/html/analyses.html). A total of 57
5
archaeal and 54 bacterial clones were partially sequenced (∼0.5 kb). Using the ARB software package, these sequences were calculated into existing phylogenetic trees by parsimony without allowing changes in the tree topology. Representative sequences of each cluster were then fully sequenced (∼1.3 kb) and matched against the NCBI data base (http://www.ncbi.nlm.nih.gov/BLAST). The sequence data reported here will
10
appear in the EMBL, GenBank, and DDBJ nucleotide sequence databases under the accession numbers DQ007532 to DQ007540.
3. Results
3.1. Field observations
Echosounder transects revealed several gas flares reaching from the sea floor to the
15
sea surface (transducer depth) at 6◦29.920N, 2◦59.800E in an area of ca. 3500 m2 (Figs. 1 and 2). A small area with 4 single plumes was also found at 6◦29.560N, 2◦59.250E. No plumes were detected outside of the seep areas within a larger area of 12 km2. Echosounder guided sampling of the gas flares and subsequent gas ex-traction showed high concentrations of methane within the plumes (500 nM), which
20
were up to 2 orders of magnitude above the background concentration (5 nM, data not shown). Similar to earlier findings (Hovland, 2002; Hovland and Judd, 1988), sea bot-tom observations with the ROV and the towed camera showed the presence of bubble streams emanating from small point sources of a few cm in diameter (Fig. 3a). White bacterial mats, most likely formed by giant sulphide oxidizing bacteria with a patch size
25
BGD
2, 1197–1241, 2005 Control of methane efflux at the Tommeliten seep area H. Niemann et al. Title Page Abstract Introduction Conclusions References Tables Figures J I J I Back Close Full Screen / EscPrint Version Interactive Discussion
EGU was observed directly from bacterial mats. At various locations mostly situated north
of the plume cluster, carbonate crusts with diameters ranging from decimetres to me-tres were exposed 10–50 cm above the sea floor (Figs. 1 and 3c). These crusts were densely covered by several species of anthozoa and other sessile macrofauna typical of hard grounds (Fig. 3c). These animals were not found in the surrounding area
char-5
acterized by sandy sediments. Furthermore, a comparably high density of demersal fish was observed in the vicinity of the crusts.
3.2. Sediment layers and geochemical profiles
The echosounder profiles showed several dome like structures in the seep area with a distinct sequence of layers narrowing towards the apex of each dome where the gas
10
plumes were situated (Fig. 2). Station 1904 was furthest away from the plume, and station 1860 was closest. All cores obtained from the Tommeliten seep area (1904, 1866 and 1860, Fig. 1) contained four different horizons of sediments (Figs. 4a–6a): (1) the lowest (350–240 cm b.s.f. in core 1904; 300–200 cm b.s.f. in core 1860) consisted of stiff marl followed by (2) a gassy layer of clay-silt (Fig. 3d) (240–175,cm b.s.f. in
15
core 1904; 230–160 cm b.s.f. in core 1866; 200–125 cm b.s.f. in core 1860). (3) 10 to 40 cm of sand comprising MDACs (Fig. 3e) were overlying the clay-silt in cores 1904 and 1860. The presence of gas bubbles of ca 0.1–1 cm in diameter in the clay-silt (2), MDAC bearing sediments (3) and the first 10 to 20 cm just above the carbonate bearing sections gave the sediments a spongy appearance (Fig. 3d). (4) The upper
20
most sediment layer consisted of carbonate-free sand (165–0 cm b.s.f. in core 1904; 85–0 cm b.s.f. in core 1860). Hence, the narrowing of layers towards the apex of the dome visualized by echosounder images (Fig. 2) was reflected in the sedimentology (Figs. 4a and 6a). The sediment layering at station 1866 was different from station 1904 and 1860 as the (3) horizon containing MDACs was found at ca. 75 to 85 cm
25
b.s.f. within the (4) sandy sediments (Fig. 5a). No. (1) marl section was recovered from core 1866, which was 230 cm long. Sediments at the reference station (recovered ca. 5 km away from the seep area) consisted of (4) a sandy surface horizon (0 to 100 cm
BGD
2, 1197–1241, 2005 Control of methane efflux at the Tommeliten seep area H. Niemann et al. Title Page Abstract Introduction Conclusions References Tables Figures J I J I Back Close Full Screen / EscPrint Version Interactive Discussion
EGU b.s.f.) and an underlying (3) clay-silt horizon (100–400 cm b.s.f.). No gas bubbles or
carbonates were observed at this station (data not shown).
The methane, sulphate and sulphide gradients in the cores from the Tommeliten seep area were influenced by their proximity to the gas plume and by the sediment layering. Because of the artefacts introduced by vibrocoring and subsequent
sam-5
pling of the gassy and sandy sediments, fluxes of methane and sulphate cannot be calculated from the profiles. Nevertheless, the data indicate a distinct zonation of the processes of anaerobic methane consumption and associated sulphide production. At the reference station away from the seep, sediments contained methane concentra-tions <0.1 µM (quantification limit) throughout the core. In contrast, within the seep
10
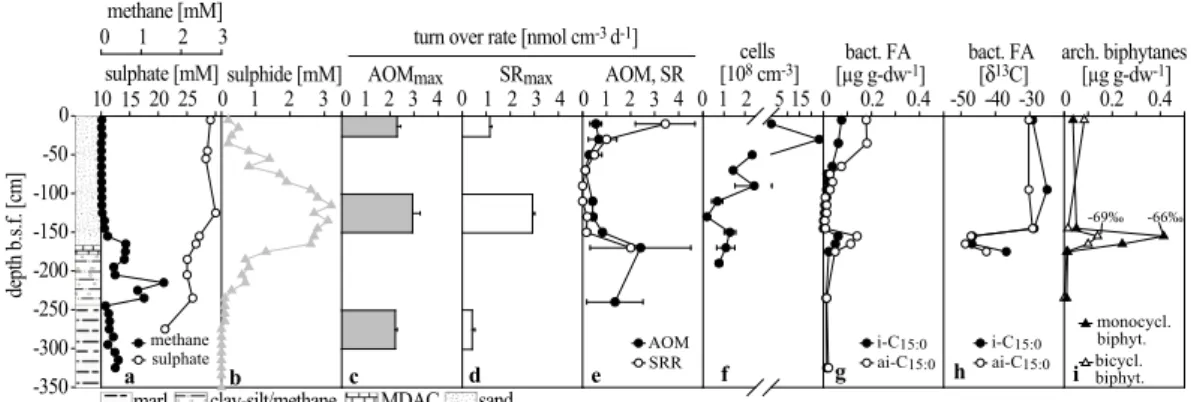
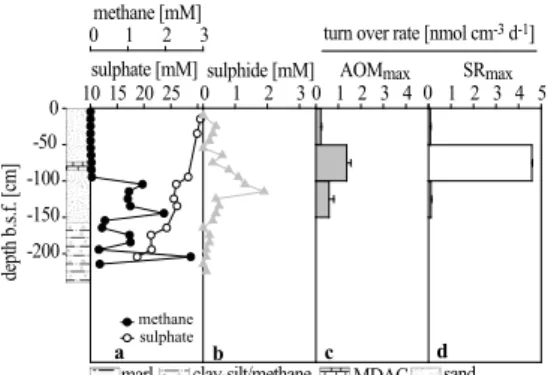
area, methane concentrations reached supersaturation in the (1) clay horizon and the (3) MDAC-bearing sediments (core 1860=2.5, 1866=1.4, 1904=1.6 mM). Within the stiff marl sediments (1), the methane concentration was comparably low (<0.2 mM) (Fig. 4a–6a). The sulphate-methane transition zone (SMTZ) is defined here as the horizon with a distinct dip in methane and sulphate concentrations as well as a peak
15
in sulphide concentrations. This was located between the (3) MDAC-bearing sedi-ments and (4) the overlying sandy sedisedi-ments in cores 1904 and 1860, and in the lower sand section in core 1866. In contrast to a typical SMTZ, sulphate was not depleted in the methane-rich zone. However, this is most likely a result of sampling artefacts. Above the SMTZ, methane concentrations declined to values <0.04 mM. In core 1860,
20
methane concentrations remained comparably high above the carbonate-bearing hori-zon (>0.25 mM) but declined to <0.04 mM in the top sediment horihori-zon. At station 1904 and 1866, methane concentrations were below 0.01 mM in the top 40 cm of the seabed (Figs. 4a and 5a). Sulphate concentrations declined slightly at the methane transition zone (SMTZ) from seawater values (28 mM) to values between 23 (core 1904, 1866;
25
Figs. 4a and 5a) and 15 mM (core 1860; Fig. 6a). In each core, a distinct sulphide peak was measured just above the horizon in which methane declined with concen-trations of 3.1 mM (core 1904, 135 cm b.s.f.), 1.9 mM (core 1866, 115 cm b.s.f.) and 2.1 mM (core 1860, 55 cm b.s.f.), respectively (Figs. 4b–6b). Sulphide concentrations
BGD
2, 1197–1241, 2005 Control of methane efflux at the Tommeliten seep area H. Niemann et al. Title Page Abstract Introduction Conclusions References Tables Figures J I J I Back Close Full Screen / EscPrint Version Interactive Discussion
EGU declined to values below detection limit in surface and bottom horizons. Sediments
of the reference station did not show any detectable sulphide concentrations (data not shown).
3.3. Ex situ AOM and SR
In short-term ex situ incubations, AOM reached a maximum rate of 2.4 nmol cm−3
5
d−1 at 170 cm b.s.f. in core 1904 within the SMTZ. Sulphate Reduction Rates (SRR) were also elevated at the SMTZ reaching 2 nmol cm−3 d−1. Unfortunately, no SRR could be measured below this horizon due to sample loss. Rates in overlying horizons decreased to values ranging between 0.8 and 0.1 nmol cm−3 (Fig. 4e). Highest SR were detected in the surface horizon (3.5 nmol cm−3 d−1). AOM and SR rates were
10
highly variable between replicate subsamples within one horizon leading to standard errors of up to 83% of the mean (Fig. 4e).
3.4. In vitro rates at methane saturation
Potential AOM and SR rates (AOMmax, SRmax) measured in long-term incubations were highest in sediments collected from the SMTZ with 1.4 to 3 and 2.9 to 4.6 nmol cm−3
15
d−1, respectively (Figs. 4c, 4d–6c and d). In these incubations, the ratio of AOM to SR was 1:1 in core 1904, 0.3:1 in core 1866 and 0.5:1 core 1860. In sediment slurries from the SMTZ at station 1904, SR without methane was 70% lower compared to incubations with methane. This indicates a close coupling between AOM and SR. AOMmax and SRmaxwere substantially lower in slurries obtained from horizons above
20
BGD
2, 1197–1241, 2005 Control of methane efflux at the Tommeliten seep area H. Niemann et al. Title Page Abstract Introduction Conclusions References Tables Figures J I J I Back Close Full Screen / EscPrint Version Interactive Discussion
EGU 3.5. Biomarker signatures
3.5.1. Sediments
Concentration measurements of single lipid compounds showed maxima of specific bacterial FAs and archaeal isoprenoidal lipids in sediments from the SMTZ of core 1904 (150–180 cm b.s.f.; Figs. 4g and 4i, Table 1). At this horizon, stable carbon
iso-5
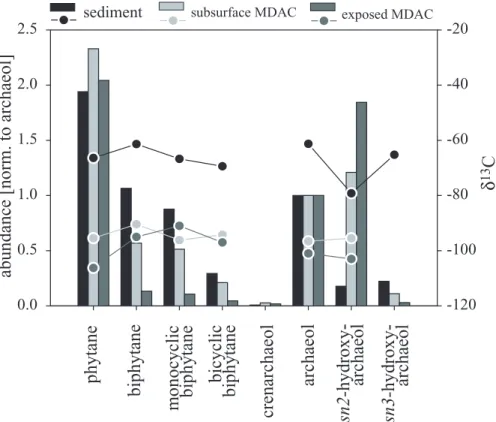
tope analysis revealed the highest depletion in13C with minimum values of –79 (sn2-hydroxyarchaeol) in archaeal diether lipids (Fig. 7) and −50‰ (ai-C15:0) in bacterial FAs (Figs. 4h and 9). The concentration of both archaeal and bacterial lipids decreased just above and below the SMTZ where these biomarkers were also less depleted. Ar-chaeal lipids found at the SMTZ were dominated by the glycerol diether archaeol and
10
the decomposition products of both diether and tetraether lipids, i.e. phytane and bi-phytanes with δ13C-values ranging from −60‰ to −70‰ (Table 1, Fig 7). sn2- and
sn3-hydroxyarchaeol (Σhydroxyarchaeol) were less abundant relative to archaeol with
a ratio of 0.4:1. Concentrations of the biphytanes decreased with increasing degree of cyclisation (Fig. 7). Compared to the di- and tetraethers, archaeal isoprenoidal
hydro-15
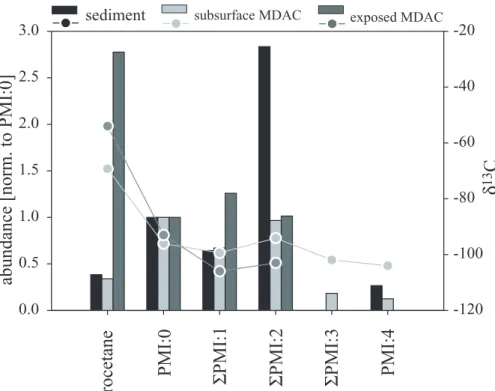
carbons were approximately one order of magnitude lower in concentration (Table 1). As a result, the stable carbon isotope composition of these compounds could not be measured (required minimum concentration: ∼100 ng g-dw−1). Isoprenoidal hydro-carbons were dominated by 2,6,10,15,19-pentamethylicosenes with two double bonds (ΣPMI:2; 3 isomers) followed by PMI:0 and PMI:1 (Fig. 8). The FA fraction in sediments
20
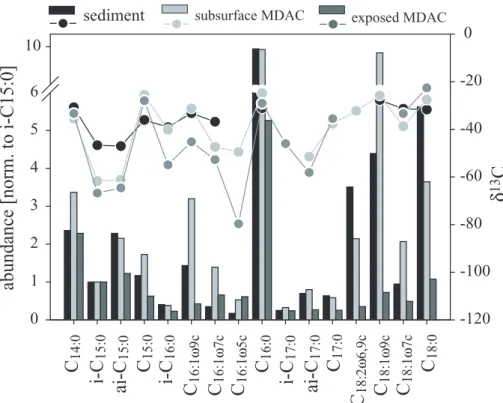
of the SMTZ was dominated by C16:0, followed by C18:1ω9, C18:0 and C18:2. FAs that are putatively specific for SRB involved in AOM such as C16:1ω5, i-C15:0 and ai-C15:0 (Blumenberg et al., 2004; Elvert et al., 2003), were approximately 5 to 50 times lower in concentration compared to C16:0 in Tommeliten sediments (Table 1). However, in contrast to abundant FAs, stable carbon isotope compositions of i-C15:0 and ai-C15:0
25
BGD
2, 1197–1241, 2005 Control of methane efflux at the Tommeliten seep area H. Niemann et al. Title Page Abstract Introduction Conclusions References Tables Figures J I J I Back Close Full Screen / EscPrint Version Interactive Discussion
EGU 3.5.2. Methane derived authigenic carbonates
Lipid analysis revealed that MDACs from the Tommeliten seep contained specific ar-chaeal and bacterial lipids. δ13C-values of these compounds were 20–30‰-lower in comparison to those extracted from sediment at the SMTZ of station 1904 (Figs. 7–9). In contrast to the SMTZ sediments, the di- and tetraether fraction in the subsurface
5
MDACs was dominated by sn2-hydroxyarchaeol, which was slightly more abundant than archaeol (archaeol:Σhydroxyarchaeol=1:1.6). The surface MDACs even reached a ratio of archaeol toΣhydroxyarchaeol of 1:1.9 (Fig. 7). The suite of biphytanes found in sediments of the SMTZ was also present in the subsurface and surface MDACs. Furthermore, the biphytanes in the MDACs and in sediments of the SMTZ showed a
10
similar abundance pattern. I.e. concentrations of the biphytanes decreased with higher degrees of cyclisation. However, in contrast to sediments of the SMTZ, the abundance of biphytanes relative to archaeol and phytane was lower in the subsurface MDACs and lowest in surface MDACs (Fig. 7). Furthermore, PMIs in the MDACs showed higher degrees of saturation (Fig. 8) and a higher number of isomers compared to sediments
15
of the SMTZ. ΣPMI:1 comprised 4, ΣPMI:2 5 and ΣPMI:3 2 isomers. Notably, sur-face MDACs contained very high amounts of crocetane. Stable carbon isotope com-positions of diethers, tetraethers and isoprenoid hydrocarbons were uniformly <-90 , both in the subsurface and the surface MDACs. An exception was crocetane showing
δ13C values of −70 and −55‰ in the subsurface and the surface MDACs, respectively
20
(Fig. 8). Variations in δ13C-values among the PMI isomers were small with a max-imum of ±2‰. As with the biphytanes, the FA abundance pattern of the subsurface MDACs showed comparably high similarities to the pattern found in sediments of the SMTZ, whereas the abundance pattern of the surface MDACs showed lower similari-ties (Fig. 9). Subsurface MDACs contained roughly twice as much i-C15:0 than ai-C15:0
25
while this ratio was almost 1:1 in surface carbonates. In the subsurface MDACs, i-C15:0 and ai-C15:0 were the most 13C-depleted FAs with values down to -62‰. In contrast, the most13C-depleted FA found in the surface MDACs was C16:1ω5 with a δ13C-value
BGD
2, 1197–1241, 2005 Control of methane efflux at the Tommeliten seep area H. Niemann et al. Title Page Abstract Introduction Conclusions References Tables Figures J I J I Back Close Full Screen / EscPrint Version Interactive Discussion
EGU of −80‰ while i-C15:0 and ai-C15:0 showed values of −67‰ and −65‰, respectively
(Fig. 9).
3.6. Archaeal and bacterial clone libraries
One archaeal and one bacterial clone library were constructed from a sediment sam-ple from the SMTZ of station 1904 to study the microbial diversity in the AOM zone. A
5
total of 57 archaeal and 54 bacterial clones were partially sequenced (∼0.5 kb). From each phylogenetic group, one representative sequence was almost fully (∼1.5 kb) se-quenced. The obtained 16S rDNA archaeal clone library showed a low diversity in comparison to previous publications of methane seep systems (Mills et al., 2003; Or-phan et al., 2002; Teske et al., 2002). Two different phylogentic groups of archaea were
10
detected (Table 2). The ANME-1b cluster (Methanosarcinales) accounted for 98% of obtained sequences. The second group comprised a single clone sequence, which belongs to the Marine Benthic Group D (Thermoplamatales). Other ANME groups or methanogens were not detected.
The bacterial clone library consisted of seven uncultivated, methane seep-related
lin-15
eages. The next relatives to all sequences obtained are commonly found in marine cold seep sediments (Table 2). Most abundant were clones of the δ-Proteobacteria com-prising sequences of the putative bacterial partner for AOM (26% of bacterial clone sequences), i.e. the Seep-SRB1 cluster (Knittel et al., 2003). One other abundant group among the δ-Proteobacteria were the Desulfoarculaceae (26%). 38% of
bac-20
terial sequences were distantly related to the Haloanaerobiales, which belong to the Firmicutes.
3.7. Total cell counts and ANME-1 abundance
Direct cell counts showed highest numbers in surface sediment horizons (23.2×10⁸ cells cm−3 at 30 cm b.s.f.). Cell counts decreased below this horizon to values
25
BGD
2, 1197–1241, 2005 Control of methane efflux at the Tommeliten seep area H. Niemann et al. Title Page Abstract Introduction Conclusions References Tables Figures J I J I Back Close Full Screen / EscPrint Version Interactive Discussion
EGU (1.1–1.3×10⁸ cells cm−3 at 150–170 cm b.s.f.). In this horizon, probing with
CARD-FISH targeting ANME-1 cells resulted in positive signals (Fig. 10). Only single cells or chains of up to three cells were observed. Bacterial partners physically attached to ANME-1 were not observed. Specific CARD-FISH counts resulted in 1.45×10⁷ ANME-1 cells cm−3 sediment. The overlying horizon (110 cm b.s.f.) contained very low
num-5
bers of ANME-1 cells (<3×10⁵cells cm−3), whereas ANME-1 could not be detected in an underlying horizon (190 cm b.s.f.).
4. Discussion
4.1. Methane emission from the Tommeliten seep area
Two decades after the discovery of gas seeps in the Tommeliten area by Hovland and
10
Judd (1988), we revisited this area for video and biogeochemical surveys. The Tom-meliten area is located in the central North Sea (56◦29.900N, 2◦59.800E) above three salt diapiers. Here, the so-called Delta structure has pierced the enclosing sedimentary rocks allowing methane to migrate to surface sediments. During ROV surveys, Hovland and Judd (1988) identified several small gas vents emitting single streams of methane
15
bubbles from the sandy seabed into the hydrosphere. High reflective, small patches (<5 m across, ∼0.5 m deep) noted on short-range side-scan sonar records, which the authors termed “eyed pockmarks”, were found to comprise MDAC crusts serving as a hard substrate for a variety of anthozoa such as sea-anemones and sea pens. Further-more, it was estimated that the flux of gas from the wider seep area of 6500 m2 was
20
47 g CH4m−2yr−1(Hovland and Judd, 1992; Hovland et al., 1993). Two decades later, our observations provide evidence that the Tommeliten seep area is still active. Here, several gas flares reaching almost to the sea surface were recorded by hydroacoustic profiling (Fig. 2) and video surveys provided evidence for bubble streams being emitted from the sandy sea floor (Fig. 3a). From these observations it can be concluded that
25
dur-BGD
2, 1197–1241, 2005 Control of methane efflux at the Tommeliten seep area H. Niemann et al. Title Page Abstract Introduction Conclusions References Tables Figures J I J I Back Close Full Screen / EscPrint Version Interactive Discussion
EGU ing deep mixing situations in the North Sea. Video observations also showed microbial
mats of filamentous, presumably thiotrophic bacteria (Fig. 3b) and reef like structures of MDACs as already described by Hovland and Judd (1988).
Such features as observed at Tommeliten are typical for active cold seeps on conti-nental margins and generally indicate high methane fluxes and turnover rates (Boetius
5
and Suess, 2004; Joye et al., 2004; Michaelis et al., 2002; Orphan et al., 2004; Treude et al., 2003). However, we found only few highly focused point sources in the sandy seabed and very patchy, small microbial mats pointing to very restricted AOM zones close to the sea floor.
4.2. Control of methane efflux from seep sediments
10
Our study provides evidence that methane flux at the Tommeliten seeps is controlled by a combination of geological and microbial processes as illustrated in Fig. 11. The shallow seismic profiles show strong, ascending reflectors in the sediment (Fig. 2). Moreover, ascending and discontinuous reflectors on seismic plots of deep sediment layers (Hovland, 2002; Hovland and Judd, 1988) indicate that the process of local gas
15
venting may have occurred several times in the history of Tommeliten. At present, the position of the methane plumes together with direct observations of methane bubbles (Figs. 1 and 3a) give evidence for seepage pathways at the crest of the marl domes that allow for emission of free gas, circumventing microbial consumption (Fig. 11-II). Our observations from vibrocorer sampling indicate that the marl sediments represent
20
a barrier to gas flow. A shallower depth and narrowing of the marl boundary in the vicinity of plumes as observed previously (Hovland and Judd, 1988) and in this study (Figs. 4a and 6a) suggests that subsurface gas pressure lifts sediments (Fig. 11-I). As a consequence, the marl may locally crack, allowing an advection of methane into and within the overlying clay-silt sediments. At the station 1860 closest to the gas
25
plume, the marl horizon was missing. It is possible that the position of the gas vents is connected to the distribution of sands, which facilitate the passage of free gas bubbles compared to clays.
BGD
2, 1197–1241, 2005 Control of methane efflux at the Tommeliten seep area H. Niemann et al. Title Page Abstract Introduction Conclusions References Tables Figures J I J I Back Close Full Screen / EscPrint Version Interactive Discussion
EGU Within the sediments, methane is most likely advecting horizontally in the clay-silt
layer above the marl. Here, it is partially consumed in a very distinct subsurface hori-zon of no more than 20 cm located at the SMTZ between the MDACs (horihori-zon 3) and the sandy sediments (horizon 4) (Fig. 11-III). The decline of methane concentrations in this sediment layer coincided with increased concentrations of 13C-depleted lipid
5
biomarkers, cell abundances as well as with relatively elevated rates of AOM and SR measured by in vitro and ex situ incubations.
The ex situ and in vitro AOM and SR rates at the Tommeliten seep SMTZ are 2 to 3 orders of magnitude lower in comparison to highly active cold seeps such as Hydrate Ridge and the Gulf of Mexico (Boetius et al., 2000; Joye et al., 2004; Treude et al.,
10
2003). Nevertheless, AOM apparently consumes all the methane diffusing into the sands. With respect to the abundance of ANME-1 cells (1.5×10⁷ cells cm−3) and the average AOM rate in sediments at the SMTZ (2.4 nmol cm−3 d−1), the cell-specific AOM rate at Tommeliten was ∼0.17 fmol d−1. This value is comparable to highly active seeps. At Hydrate Ridge, ex situ measurements of AOM showed near surface peaks
15
with average values of 1.1 and 1.3 µmol cm−3 d−1, respectively (Treude et al., 2003; study site Beggiatoa field 2 at 2.5 and 6.5 cm b.s.f.). In these horizons, ca. 0.9×10⁸and 0.6×10⁸ANME-2/Seep-SRB1 aggregates per cm3were detected, respectively (Treude et al., 2003). An average aggregate at Hydrate Ridge was found to consist of ca. 100 archaeal and 200 SRB cells (Boetius et al., 2000). Hence, cell-specific AOM rates are
20
ranging between 0.13 and 0.21 fmol d−1. These values are in good agreement with in vitro measurements from Hydrate Ridge. Nauhaus et al. (2005) measured in vitro AOM rates of 2.5 µmol g-dw−1d−1in sediments from a Beggiatoa site, which contained 0.9×10⁸ aggregates g-dw−1. This corresponds to a cell specific rate of 0.28 fmol d−1. Other AOM systems such as the ANME-1 dominated microbial mats from the Black Sea
25
were found to contain ca. 4×10¹⁰ ANME-1 cells cm−3 (Knittel et al., 2005). Corrected for porosity (∼87%, Treude pers. com.), in vitro AOM at the Black Sea microbial mats was ca. 5.3 µmol cm−3d−1(Nauhaus et al., 2005) which corresponds to a cell-specific rate of 0.13 fmol d−1. In conclusion, the capacity for AOM at methane seep systems
BGD
2, 1197–1241, 2005 Control of methane efflux at the Tommeliten seep area H. Niemann et al. Title Page Abstract Introduction Conclusions References Tables Figures J I J I Back Close Full Screen / EscPrint Version Interactive Discussion
EGU appears to be mainly related to the biomass and distribution of the AOM community,
which is in turn regulated by the availability of methane and sulphate.
The sea floor observations of patches of presumably thiotrophic mats, above black-ish, reduced sediments (Figs. 6b and 11-IV), give evidence for another type of patchy hot spot of microbial activity just beneath the sea floor, possibly AOM as indicated
5
by previous observations of free methane trapped below microbial mats (Hovland, 2002). However, we were not able to sample these sediments with our tools during the R/V Heincke expeditions. The imprint of13C-depleted archaeal and bacterial lipids in MDACs exposed at the sea floor also provide evidence of AOM activity and resulting carbonate precipitation in near surface sediments at Tommeliten. However, at present,
10
no seepage was observed at the crusts (Hovland, 2002; Hovland and Judd 1988; this work). It is possible that the precipitation of carbonates in the AOM zone leads to a self-sealing of gas leakage pathways (Hovland, 2002). The surface MDAC crusts found at the Tommmeliten site may have formed in near-surface horizons just like the MDAC pieces found in the SMTZ, and may have been exposed due to sediment erosion.
To-15
day they are providing a niche for sessile hard substrate fauna, which is unusual for the sandy seabed of the central North Sea (Figs. 3c and 11-V). Furthermore, the crusts also attract demersal fish. Hence, these observations indicate that seepage related carbonates, which outcrop the sea floor have a stimulating effect on the abundance of mega fauna.
20
4.3. Distribution and identity of methanotrophic communities
Specific lipid biomarkers with typically low δ13C-values in sediments and MDACs of the Tommeliten seep area provide evidence for anaerobic methanotrophic communities associated with gas seepage. The differences in the biomarker patterns in sediments at the SMTZ and in the surface and subsurface MDACs indicate the presence of different
25
groups of methanotrophs. Sediments of the SMTZ host a methanotrophic community dominated by ANME-1. MDAC pieces at the SMTZ show a lipid pattern indicative of a mixed ANME-1/ANME-2 community whereas the exposed MDAC crusts contain a
BGD
2, 1197–1241, 2005 Control of methane efflux at the Tommeliten seep area H. Niemann et al. Title Page Abstract Introduction Conclusions References Tables Figures J I J I Back Close Full Screen / EscPrint Version Interactive Discussion
EGU biomarker signature typical of ANME-2 communities, as discussed in the following:
4.3.1. ANME-1 community in sediments of the SMTZ 13
C-depleted acyclic and cyclic biphytanes were found in relatively high abundances in sediments at the SMTZ (Fig. 7). Biphytanes are present in various methanogenic archaea and planktonic crenarchaeota (De Rosa and Gambacorta, 1988; Koga et al.,
5
1993; Schouten et al., 2002). However, a substantial δ13C-depletion as observed here and in other seep environments points to methanotrophic organisms. A similar lipid pattern as in the Tommeliten SMTZ was found in microbial mats from the Black Sea. These mats were dominated by ANME-1, as shown by microscopic observation based on FISH (Blumenberg et al., 2004; Knittel et al., 2005; Michaelis et al., 2002).
Blumen-10
berg et al. (2004) also showed that biphytanes are absent or rare in ANME-2 dominated microbial mats and proposed to use biphytanes as specific indicators for ANME-1 com-munities. Furthermore, in sediments of the SMTZ, the low ratio of sn2-hydroxyarchaeol relative to archaeol (0.2:1, Fig. 7), both of which are 13C-depleted, matches typical ANME-1 signatures known from other cold seep sediments and MDACs (Aloisi et al.,
15
2002; Blumenberg et al., 2004; Hinrichs et al., 1999; Hinrichs et al., 2000; Teske et al., 2002). In contrast, a ratio of 2:1 or higher was found in ANME-2 dominated sys-tems (Elvert et al., 20051; Blumenberg et al., 2004; Hinrichs et al., 2000; Orphan et al., 2001a). The predominance of ANME-1 in the SMTZ of Tommeliten seeps is confirmed by 16S rDNA and FISH analysis. We found a very low diversity of archaeal 16S rDNA
20
clone sequences, which belonged almost entirely to the ANME-1b sub-cluster (98% of the retrieved archaeal sequences, Table 2). Epifluorescence microscopy of CARD-FISH targeted cells detected ANME-1 in the SMTZ zone (Fig. 10). In contrast, probes targeting ANME-2a, ANME-2c or ANME-3 gave no positive results in sediments from
1
Elvert, M., Hopmans E. C., Boetius A., and Hinrichs K.-U.: Spatial variatons of archaeal-bacterial assambladges in gas hydrate bearing sediments at a cold seep: Implications from a high resolution molecular and isotopic approach, submitted, 2005.
BGD
2, 1197–1241, 2005 Control of methane efflux at the Tommeliten seep area H. Niemann et al. Title Page Abstract Introduction Conclusions References Tables Figures J I J I Back Close Full Screen / EscPrint Version Interactive Discussion
EGU the SMTZ or around it.
Usually, ANME cells are found physically associated with SRB in samples from AOM zones of most seep systems. It is generally assumed that these SRB are syntrophic partners of ANME, however, so far, the mechanistic nature of their interaction remains unknown (Boetius et al., 2000; Hoehler et al., 1994; Nauhaus et al., 2002; Orphan et
5
al., 2001b). Fingerprints of13C-depleted bacterial FAs and microscopic observations using FISH showed, that the most common partners of ANME-1 and ANME-2 commu-nities are SRB of the Seep-SRB1 cluster (Blumenberg et al., 2004; Elvert et al., 2003; Knittel et al., 2003). Accordingly, the 16S rDNA clone library from sediments of the SMTZ contained high abundances of Seep-SRB1 sequences. Although sequences of
10
the Seep-SRB1 in ANME-1 and ANME-2 dominated habitats form one cluster, FA lipid patterns suggest the existence of two distinct ecotypes of Seep-SRB1 with different FA fingerprints when associated to ANME-1 or ANME-2 (Blumenberg et al., 2004; Elvert et al., 2003). In the Tommeliten SMTZ sediments, the high content of ai-C15:0 relative to i-C15:0 and the lack of abundant amounts of C16:1ω5 suggest the presence of the
15
Seep-SRB1 type associated to ANME-1 (Blumenberg et al., 2004). 4.3.2. ANME-1/ANME-2 communities in MDACs
Previous investigations showed that biomarker patterns in MDACs may be derived from living biomass or represent fossilized materials, or a mixture of both (Aloisi et al., 2002; Peckmann et al., 2002; Thiel et al., 2001). The presence of 13C-depleted archaeal
20
lipids in subsurface and exposed MDACs indicate that carbonate precipitation at Tom-meliten is associated with processes of seepage and AOM. The shapes of subsurface MDACs suggest that these were precipitated in pore spaces and channels formed by gas bubble streams. It is interesting to note that the subsurface and exposed MDACs contained different biomarker patterns. The subsurface MDACs were found to
con-25
tain archaeal lipids which indicate a mixed ANME-1/ANME-2 community. Compared to sediments at the SMTZ, the relative abundance of ANME-1 specific biphytanes was low (Fig. 7). The ratio of sn2-hydroxyarchaeol relative to archaeol was comparable
BGD
2, 1197–1241, 2005 Control of methane efflux at the Tommeliten seep area H. Niemann et al. Title Page Abstract Introduction Conclusions References Tables Figures J I J I Back Close Full Screen / EscPrint Version Interactive Discussion
EGU to available values from settings comprising a mixed community consisting of
ANME-1/ANME-2 or dominated by ANME-2 (Blumenberg et al., 2004; Elvert et al., submitted; Hinrichs et al., 1999; Hinrichs et al., 2000; Orphan et al., 2001a). In contrast to the sub-surface MDACs, the MDACs exposed at the seafloor contained a biomarker signature typical for ANME-2 communities. Low amounts of biphytanes and high amounts of
sn2-5
hydroxyarchaeol relative to archaeol (1:1.9, Fig. 7) as well as substantial amounts of 13
C-depleted crocetane (Fig. 8) are in good agreement with published data for ANME-2 dominated systems (Blumenberg et al., 2004; Elvert et al., 2001; Elvert et al., 1999, 2005; Orphan et al., 2001a). The subsurface as well as the exposed MDACs also contained lipid signatures typical of the Seep-SRB1 cluster commonly associated with
10
ANME-1 or ANME-2. High amounts of ai-C15:0 relative to i-C15:0 (2.1:1, Fig. 9) in sub-surface MDACs are indicative of Seep-SRB1 associated with ANME-1, whereas in exposed MDACs, a ratio of nearly 1:1 and substantial amounts of C16:1ω5 point to the Seep-SRB1 ecotype associated to ANME-2 (Blumenberg et al., 2004; Elvert et al., 2003). It is possible that the MDACs found at Tommeliten preserve signatures of
pre-15
vious ANME-2 communities once populating the surface sediments of this seep. At present, such a niche could exist in the reduced patches covered by bacterial mats, which we unfortunately were not able to sample because of their small size and patchy distribution. Previous studies at the cold seep systems of Hydrate Ridge showed a similar trend in the distribution of ANME-1 and ANME-2 communities. Here, surface
20
sediments are dominated by ANME-2 whereas the abundance of ANME-1 was found to increase subsurface (Knittel et al., 2003, 2005). However, the environmental fac-tors selecting for these different phylogenetic groups and their bacterial partner remain unknown.
5. Conclusions
25
So far, only very little is known on the identity, activity and distribution of AOM communi-ties of shallow water cold seeps. In this investigation we revisited the Tommeliten area,
BGD
2, 1197–1241, 2005 Control of methane efflux at the Tommeliten seep area H. Niemann et al. Title Page Abstract Introduction Conclusions References Tables Figures J I J I Back Close Full Screen / EscPrint Version Interactive Discussion
EGU a seepage site of the central North Sea. Here, an impermeable horizon of stiff marl
sediments represents a natural barrier for methane rising from a deep gas reservoir. Methane pressure lifts this horizon forming dome-like subsurface structures. As a con-sequence, the marl may crack, allowing methane to advect into overlying, sediments of clay-silt. At the interface between silty and sandy sediments, methane is oxidised
5
anaerobically by a community of ANME-1 archaea and SRB of the Seep-SRB1 group in a defined subsurface horizon of ca. 20 cm. This horizon also bears methane-derived authigenic carbonates and shows the highest AOM activity. AOM and SR rates are several orders of magnitude lower in comparison to AOM zones of highly active cold seeps. Nevertheless, the specific activity of methanotrophic cells detected in the
sedi-10
ments is comparable. All uprising methane is consumed within the sediments, except for a few locations with active gas venting to the hydrosphere. Here, at the crest of the marl domes, the ebullition of free gas circumvents microbial consumption most likely due to the presence of gas channels through sandy sediments. Thiotrophic bacterial mats as well as methane-derived authigenic carbonates exposed at the sea floor also
15
indicate the presence of local gas escape routes.
Acknowledgements. This study was conducted as part of the METROL project (http://www.
metrol.org) of the 5th framework program of the European Commission (EVK-3-CT-2002-00080). We thank captain, crew and shipboard scientists of R/V Heincke cruise HE-169 and HE-180 for their excellent support with work at sea. We thank G. Wendt and J.
Wun-20
derlich from Rostock University and Innomar Technologie GmbH for providing and operating the echosounder SES-2000 and Werner Dimmler from the Alfred Wegener Institute for Polar and Marine Research for ROV maintenance and operation. We thank R. Usbeck from FIELAX for support with mapping and geo-referencing, I. Busse, V. Beyer and T. Wilkop for laboratory analyses and G. Bening for handling the vibrocorer of the Institute for Baltic Sea Research
25
(IOW). This study would not have been possible without the technical support by the Geology Department of the IOW. R. Rendle-B ¨uhring, J. Schwarz and S. Steinke of the University Bre-men are acknowledged for their help with sediBre-mentological descriptions. We also thank T. Pape of the University Hamburg for the provision of analytical protocols.
BGD
2, 1197–1241, 2005 Control of methane efflux at the Tommeliten seep area H. Niemann et al. Title Page Abstract Introduction Conclusions References Tables Figures J I J I Back Close Full Screen / EscPrint Version Interactive Discussion
EGU
References
Aloisi, G., Bouloubassi I., Heijs S. K., Pancost R. D., Pierre C., Damste J. S. S., Gottschal J. C., Forney L. J., and Rouchy J. M.: CH4-consuming microorganisms and the formation of carbonate crusts at cold seeps, Earth and Planetary Science Letters, 203, 195–203, 2002. Barry, J. P., Greene H. G., Orange D. L., Baxter C. H., Robison B. H., Kochevar R. E., Nybakken
5
J. W., Reed D. L., and McHugh C. M.: Biologic and geologic characteristics of cold seeps in Monterey bay, California, Deep-Sea Research Part I-Oceanographic Research Papers, 43, 1739–1762, 1996.
Barry, J. P., Kochevar R. E., and Baxter C. H.: The influence of pore-water chemistry and physi-ology on the distribution of vesicomyid clams at cold seeps in Monterey Bay: Implications for
10
patterns of chemosynthetic community organization, Limnol. Oceanogr., 42, 318–328, 1997. Bian, L. Q., Hinrichs K. U., Xie T. M., Brassell S. C., Iversen H., Fossing H., Jorgensen B. B., and Hayes J. M.: Algal and archaeal polyisoprenoids in a recent marine sediment: Molecular iso-topic evidence for anaerobic oxidation of methane, Geochemistry Geophysics Geosystems, 2, U1–U22, 2001.
15
Blumenberg, M., Seifert R., Reitner J., Pape T., and Michaelis W.: Membrane lipid patterns typ-ify distinct anaerobic methanotrophic consortia, Proc. Natl. Acad. Sci. USA, 101, 30, 2004. Boetius, A., Ravenschlag K., Schubert C., Rickert D., Widdel F., Gieseke A., Amann R.,
Jørgensen B. B., Witte U., and Pfannkuche O.: A marine microbial consortium apparently mediating anaerobic methane of oxidation, Nature, 407 623–626, 2000.
20
Boetius, A. and Suess E.: Hydrate Ridge: a natural laboratory for the study of microbial life fueled by methane from near-surface gas hydrates, Chemical Geology, 205, 291–310, 2004. Bohrmann, G., Greinert J., Suess E., and Torres M.: Authigenic carbonates from the Cascadia
subduction zone and their relation to gas hydrate stability, Geology, 26, 647–650, 1998. Bussmann, I., Dando P. R., Niven S. J., and Suess E.: Groundwater seepage in the marine
25
environment: role for mass flux and bacterial activity, Marine Ecology-Progress Series, 178, 169–177, 1999.
C¸ ifc¸i, G., Dondurur D., and Erg ¨un M.: Deep and shallow structures of large pockmarks in the Turkish shelf, Eastern Black Sea, Geo-Marine Letters, 23, 311–322, 2003.
Dando, P. R. and Hovland M.: Environmental-Effects of Submarine Seeping Natural-Gas,
Con-30
tinental Shelf Research, 12, 1197–1207, 1992.
BGD
2, 1197–1241, 2005 Control of methane efflux at the Tommeliten seep area H. Niemann et al. Title Page Abstract Introduction Conclusions References Tables Figures J I J I Back Close Full Screen / EscPrint Version Interactive Discussion
EGU
1988.
Diaz-del-Rio, V., Somoza L., Martinez-Frias J., Mata M. P., Delgado A., Hernandez-Molina F. J., Lunar R., Martin-Rubi J. A., Maestro A., Fernandez-Puga M. C., Leon R., Llave E., Medialdea T., and Vazquez J. T.: Vast fields of hydrocarbon-derived carbonate chimneys related to the accretionary wedge/olistostrome of the Gulf of Cadiz, Marine Geology, 195, 177–200, 2003.
5
Elvert, M., Boetius A., Knittel K., and Jorgensen B. B.: Characterization of specific membrane fatty acids as chemotaxonomic markers for sulfate-reducing bacteria involved in anaerobic oxidation of methane, Geomicrobiol. J., 20, 403–419, 2003.
Elvert, M., Greinert J., Suess E., and Whiticar M. J.: Carbon isotopes of biomarkers derived from methane-oxidizing microbes at Hydrate Ridge, Cascadia convergent margin, in: Natural
10
gas hydrates: Occurrence, distribution, and dynamics, edited by: Paull, C. K. and Dillon, W. P., AGU, 124, 115–129, 2001.
Elvert, M., Suess E., and Whiticar M. J.: Anaerobic methane oxidation associated with marine gas hydrates: superlight C-isotopes from saturated and unsaturated C20 and C25 irregular isoprenoids, Naturwissenschaften, 86, 295–300, 1999.
15
Garcia-Garcia, A., Garcia-Gil S., and Vilas F.: Monitoring the Spanish gas fields in the Ria de Vigo (1991–2001), Geo-Marine Letters, 23, 200–206, 2003.
Hinrichs, K.-U. and Boetius A.: The anaerobic oxidation of methane: New insights in microbial ecology and biogeochemistry, in: Ocean Margin Systems edited by: Wefer, G., Billett, D., and Hebbeln, D., Springer-Verlag, Berlin, 457–477, 2002.
20
Hinrichs, K.-U., Hayes J. M., Sylva S. P., Brewer P. G., and DeLong E. F.: Methane-consuming archaebacteria in marine sediments, Nature, 398, 802–805, 1999
Hinrichs, K. U., Summons R. E., Orphan V., Sylva S. P., and Hayes J. M.: Molecular and isotopic analysis of anaerobic methane-oxidizing communities in marine sediments, Organic Geochemistry, 31, , 1685–1701, 2000.
25
Hoehler, T. M. and Alperin M. J.: Anaerobic methane oxidation by a methanogen-sulfate re-ducer consortium: geochemical evidence and biogeochemical considerations, in: Microbial Growth on C1Compounds, edited by: Lidstrom, M. E. and Tabita, F. R., Kluwer Academic Publishers, 326–333, 1996.
Hoehler, T. M., Alperin M. J., Albert D. B., and Martens C. S.: Field and laboratory studies
30
of methane oxidation in an anoxic marine sediment: Evidence for a methanogenic-sulfate reducer consortium, Global Biogeochemical Cycles, 8, 451–463, 1994.
BGD
2, 1197–1241, 2005 Control of methane efflux at the Tommeliten seep area H. Niemann et al. Title Page Abstract Introduction Conclusions References Tables Figures J I J I Back Close Full Screen / EscPrint Version Interactive Discussion
EGU
2387–2394, 2002.
Hovland, M. and Judd A. G.: Seabed Pockmarks and Seepages: Impact on Geology, Biology and the Marine Environment, Graham & Trotman, 1988.
Hovland, M. and Sommerville J. H.: Characteristics of two natural gas seepages in the North Sea, Marine and Petroleum Geology, 2, 319–326, 1985.
5
Hovland, M., Talbot M., Olaussen S., and Aasberg L.: Recently formed methane-derived car-bonates from the North Sea floor, in: Petroleum Geochemistry in Exploration of the Nor-wegian Shelf, edited by: Thomas, B. M., NorNor-wegian Petroleum Soc., Graham & Trotman, 263–266, 1985.
Hovland, M., Talbot M. R., Qvale H., Olaussen S., and Aasberg L.: Methane-Related Carbonate
10
Cements in Pockmarks of the North-Sea, Journal of Sedimentary Petrology, 57, 881–892, 1987.
Joye, S. B., Boetius A., Orcutt B. N., Montoya J. P., Schulz H. N., Erickson M. J., and Lugo S. K.: The anaerobic oxidation of methane and sulfate reduction in sediments from Gulf of Mexico cold seeps, Chemical Geology, 205, 219–238, 2004.
15
Judd, A. G.: The global importance and context of methane escape from the seabed, Geo-Marine Letters, 23, 147–154, 2003.
Kane, M. D., Poulsen L. K., and Stahl D. A.: Monitoring the Enrichment and Isolation of Sulfate-Reducing Bacteria by Using Oligonucleotide Hybridization Probes Designed from Environ-mentally Derived 16s Ribosomal-Rna Sequences, Appl. Environ. Microbiol., 59, 682–686,
20
1993.
Knittel, K., Boetius A., Lemke A., Eilers H., Lochte K., Pfannkuche O., Linke P., and Amann R.: Activity, distribution, and diversity of sulfate reducers and other bacteria in sediments above gas hydrate (Cascadia margin, Oregon), Geomicrobiol. J., 20, 269–294, 2003.
Knittel, K., Losekann T., Boetius A., Kort R., and Amann R.: Diversity and distribution of
25
methanotrophic archaea at cold seeps, Appl. Environ. Microbiol., 71, 467–479, 2005. Koga, Y., Nishihara M., Morii H., and Akagawa-Matsushita M.: Ether polar lipids of
methanogenic bacteria: Structures, comparative aspects, and biosyntheses, Microbiologi-cal Reviews, 57, 164–182, 1993.
Kohnen, M. E. L., Schouten S., Sinningh ´e Damste J. S., de Leeuw J. W., Merritt D. A., and
30
Hayes J. M.: Recognition of paleobiochemicals by a combined molecular sulfur and isotope geochemical approach, Science, 256, 358–362, 1992.