HAL Id: hal-00295637
https://hal.archives-ouvertes.fr/hal-00295637
Submitted on 10 Mar 2005
HAL is a multi-disciplinary open access
archive for the deposit and dissemination of
sci-entific research documents, whether they are
pub-lished or not. The documents may come from
teaching and research institutions in France or
abroad, or from public or private research centers.
L’archive ouverte pluridisciplinaire HAL, est
destinée au dépôt et à la diffusion de documents
scientifiques de niveau recherche, publiés ou non,
émanant des établissements d’enseignement et de
recherche français ou étrangers, des laboratoires
publics ou privés.
Low molecular weight organic acids in aerosol particles
from Rondônia, Brazil, during the biomass-burning,
transition and wet periods
A. H. Falkovich, E. R. Graber, G. Schkolnik, Y. Rudich, W. Maenhaut, P.
Artaxo
To cite this version:
A. H. Falkovich, E. R. Graber, G. Schkolnik, Y. Rudich, W. Maenhaut, et al.. Low molecular weight
organic acids in aerosol particles from Rondônia, Brazil, during the biomass-burning, transition and
wet periods. Atmospheric Chemistry and Physics, European Geosciences Union, 2005, 5 (3),
pp.781-797. �hal-00295637�
www.atmos-chem-phys.org/acp/5/781/ SRef-ID: 1680-7324/acp/2005-5-781 European Geosciences Union
Chemistry
and Physics
Low molecular weight organic acids in aerosol particles from
Rondˆonia, Brazil, during the biomass-burning, transition and wet
periods
A. H. Falkovich1, E. R. Graber1,4, G. Schkolnik1, Y. Rudich1, W. Maenhaut2, and P. Artaxo3
1Department of Environmental Sciences, Weizmann Institute, Rehovot 76100, Israel
2Department of Analytical Chemistry, Institute for Nuclear Sciences, Ghent University, Proeftuinstraat 86, B-9000 Gent,
Belgium
3Institute of Physics, University of S˜ao Paulo (IFUSP), Rua do Mat˜ao, Travessa R, 187, CEP 05508-900 S˜ao Paulo, Brazil 4Permanent affiliation: Institute of Soil, Water and Environmental Sciences, The Volcani Center, ARO, Bet Dagan 50250,
Israel
Received: 20 September 2004 – Published in Atmos. Chem. Phys. Discuss.: 28 October 2004 Revised: 23 February 2005 – Accepted: 1 March 2005 – Published: 10 March 2005
Abstract. Particles from biomass burning and regional haze were sampled in Rondˆonia, Brazil, during dry, transition and wet periods from September to November 2002, as part of the LBA-SMOCC (Large-Scale Biosphere-Atmosphere Ex-periment in Amazonia – Smoke, Aerosols, Clouds, Rainfall, and Climate) field campaign. Water soluble organic and in-organic compounds in bulk (High Volume and Stacked Filter Unit sampler) and size-resolved (Micro Orifice Uniform De-posit Impactor – MOUDI) smoke samples were determined by ion chromatography. It was found that low molecular weight polar organic acids account for a significant frac-tion of the water soluble organic carbon (WSOC) in biomass burning aerosols (C2-C6 dicarboxylic acids reached up to
3.7% and one-ring aromatic acids reached up to 2% of fine fraction WSOC during burning period). Short dicarboxylic (C2-C6)acids are dominated by oxalic acid followed by
mal-onic and succinic acids. The largest imal-onic species is ammo-nium sulfate (60–70% of ionic mass). It was found that most of the ionic mass is concentrated in submicrometer-sized par-ticles. Based on the size distribution and correlations with K+, a known biomass burning tracer, it is suggested that
many of the organic acids are directly emitted by vegetation fires. Concentrations of dicarboxylic acids in the front and back filters of high volume sampler were determined. Based on these measurements, it was concluded that in the neutral or slightly basic smoke particles typical of this region, dicar-boxylic acids are mostly confined to the particulate phase. Fi-nally, it is shown that the distribution of water soluble species
Correspondence to: Y. Rudich ([email protected])
shifts to larger aerosols sizes as the aerosol population ages and mixes with other aerosol types in the atmosphere.
1 Introduction
There is a recent consensus that water soluble organic car-bon (WSOC) compounds in atmospheric particles may play a significant role in the formation of cloud condensation nu-clei (CCN) (Laaksonen et al., 1998; Yu, 2000; Charlson et al., 2001; Nenes et al., 2002). As cloud condensation nuclei (CCN) are directly responsible for modulating cloud microphysical properties and for influencing cloud radiative properties, understanding the origin and nature of WSOC-containing aerosol activity has taken on new importance (Kaufman and Fraser, 1997; Ramanathan et al., 2001; Kauf-man et al., 2002; Roberts et al., 2003). This work is a part of SMOCC (Smoke Aerosols, Clouds, Rainfall and Climate), a project under the framework of the Large-Scale Atmosphere-Biosphere Experiment in Amazonia (LBA), aiming at in-vestigating the connection between the concentration and chemical composition of biomass burning aerosols, resul-tant changes in the effective radii of cloud droplets, and the climatic consequences of the resulting perturbation of cloud physics. A comprehensive description and discussion of the SMOCC campaign and results appear in a special issue of ACP, of which this article is part.
One of the major global sources for WSOC-containing aerosol is biomass burning, wherein WSOC components have been found to account for 45–75% of the total aerosol carbon mass (Graham et al., 2002; Mayol-Bracero et al.,
2002). As carbonaceous material constitutes as much as 70– 90% of the total aerosol mass (Cachier et al., 1995; Andreae and Crutzen, 1997; Yamasoe et al., 2000), it is clear that the amount of WSOC emitted to the atmosphere due to biomass burning is globally important. The WSOC in biomass burn-ing particles contributes to their CCN activity, and hence to their global climatic effects (Sherwood, 2002; Andreae et al., 2004). WSOC derived from smoke aerosols may also participate in aqueous phase chemical reactions occurring in droplets nucleated by smoke particles.
The organic components of biomass burning aerosols con-sist of a complex mixture of compounds reflecting a wide range of molecular structures, physical properties and chem-ical reactivities (Andreae and Merlet, 2001). Although a few recent studies have concentrated on identification and quantification of water soluble components of smoke parti-cles (Graham et al., 2002; Mayol-Bracero et al., 2002; Gao et al., 2003), typically less than 10% by mass of WSOCs has been identified successfully (Graham et al., 2002; Gao et al., 2003). Most previous studies concentrated on charterizing bulk samples collected during biomass burning ac-tivity. Data about the distribution of WSOC in the different particle sizes, and the changes in that distribution occurring during the transition from the dry (biomass burning) season to the wet (background clean conditions) season are scarce. The water soluble organic species include both highly dis-sociated species, such as organic acids and salts, as well as weaker acids and humic-like species, which are less ionized and can be surface active (Hoffer et al., 2004). There are also soluble, non ionic species such as anhydrous sugars (Si-moneit et al., 1999; Si(Si-moneit, 2002). In this study, we fo-cus on characterizing temporal changes in the concentration and size distribution of the highly dissociated, low molecu-lar weight (LMW) organic acids that are found in relatively fresh plumes of smoke particles from vegetation burning in Brazil.
Gao et al. (2003) measured WSOC concentrations in biomass burning particles collected from savanna fires in southern Africa, reporting abundances of 7 organic acids measured in their anionic form by ion chromatography, in-cluding acetate, formate, oxalate, malonate, succinate, glu-tarate and gluconate. Seven carbohydrates were also quan-tified by electrospray ionization-ion trap mass spectrometry coupled with ion exclusion chromatography with pulsed am-perometric detection. In general, the organic acids measured represented less than 5% of the total aerosol mass, while the carbohydrate mass fraction varied from about 15% to only a few percent. The most abundant organic acid found in the study was tentatively identified as gluconic acid (aver-age mass fraction 0.0045), with the other mono- and dicar-boxylic acids making even smaller contributions. Levoglu-cosan, while reported to be the most abundant carbohydrate with an average mass fraction of 0.033, was present only dur-ing the smolderdur-ing phases. For samples collected in Octo-ber 1999 in Brazil (at the same site as used in the current
study), Mayol-Bracero et al. (2002) employed an anion ex-change HPLC/IC technique (Decesari et al., 2000) to sep-arate WSOCs into three compound classes: neutral, mono-and dicarboxylic acids, mono-and polycarboxylic acids. They found that the acid fractions represented about 51% of the WSOC fraction, but did not further speciate the compounds. In a companion paper (Graham et al., 2002), levoglucosan was reported to account for 1–6% of total carbon, and 2– 7% of WSOC. Altogether, Graham et al. (2002) identified by GC/MS between 9 to 14% of the WSOC fraction, including a number of aliphatic di- and tricarboxylic acids, aliphatic oxo-/hydroxyacids, and aromatic compounds. The simple di- and tricarboxylic aliphatic acids were found to make up about 1– 2% of the WSOC, on average, with oxalic acid being most abundant, followed by malonic and succinic acids. Compo-nents in the other compound classes were, in general, even less abundant. For aerosols from the 1997 Indonesian for-est fires, Narukawa et al. (1999) also reported a homologous series of dicarboxylic acids, dominated by oxalic acid, and followed in abundance by malonic and succinic acid. In their work, these dicarboxylic fractions represented 2–8% of the WSOC. None of these papers report relative distributions of these compounds as a function of aerosol size, season, or day/night interval.
Considering the foregoing, it is evident that more compre-hensive datasets involving chemical characterization of the WSOC fraction of biomass burning aerosols are needed. In particular, it is essential to characterize changes in WSOC composition with seasonal changes in biomass burning, and differences in WSOC components as a function of aerosol size. Considering its importance, this study concentrates on the ionic WSOC chemical composition of biomass burning aerosols collected day and night throughout a ten-week in-terval from the peak of the 2002 dry (biomass burning) sea-son into the following wet seasea-son in Rondˆonia, Brazil, with particular attention to chemical differences between size-resolved aerosol samples. It is hoped that such detailed data, besides helping to elucidate the potential CCN activ-ity played by such aerosols, will provide essential input for climate models that aim to evaluate large scale meteorolog-ical and climatologmeteorolog-ical effects of biomass burning. Recent detailed analysis of the gas phase precursors and gas/aerosol partitioning processes have shown that LMW polar organic acids should be incorporated in thermodynamic models to accurately predict inorganic aerosol composition (Trebs et al., 2005). Detailed chemical characterization of the ionic WSOC fraction can also provide the basis for thermody-namic models describing water uptake by aerosol particles in haze and cloudy conditions, thus shedding light on smoke aerosol effect on climate.
2 Experimental 2.1 Sampling
Smoke particles were sampled in the state of Rondˆonia, Brazil, at a pasture site (Fazenda Nossa Senhora Aparecida (FNS); 10◦4505000S, 62◦2103600W, 284 m above sea level), from 8 September to 11 November 2002, as a part of the LBA-SMOCC (Large-Scale Biosphere-Atmosphere Experiment in Amazonia – Smoke, Aerosols, Clouds, Rain-fall, and Climate) campaign. According to meteorological conditions, the sampling period is subdivided into dry (in-tense burning; 8 September to 7 October), transition (8 Oc-tober to 29 OcOc-tober) and wet (30 OcOc-tober to 11 November) periods. A detailed description of the site is given in Kirkman et al. (2002). Aerosol samples were obtained from regionally emitted biomass burning plumes for periods of time ranging from 12 to 72 h per sample (Depending on aerosol loadings. Sampling times are similar for all samplers), using two filter samplers and one cascade impactor:
– Stacked Filter Unit (SFU) sampler that separates coarse (10>d>2.0 µm, where d is aerodynamic diameter) and fine particles (d<2.0 µm) by sequential filtration on 8.0 and 0.4 µm pore-size Nuclepore® polycarbonate filters (Whatman, 47 mm diameter), with a flow rate of 10– 15 l/min.
– High Volume (HiVol) dichotomous sampler that separates fine (d<2.5 µm) from coarse particles (d>2.5 µm) with a flow rate of 300 l/min for the fine fraction and 30 l/min for the coarse fraction. For both size fractions, the particles were collected on a front/back tandem system of quartz fiber filters (102 mm diameter, Pallflex®, Pall Corporation; prebaked for 24 h at 550◦C). The use of a tandem filter system allows estimating possible artifacts in particulate organic mat-ter demat-termination due to adsorption of gaseous organic compounds by filters (Novakov et al., 1997; Turpin et al., 2000). It is assumed that the front quartz filter col-lects aerosol particles with close to 100% efficiency, while gaseous organics adsorb on both filters evenly. – Micro Orifice Uniform Deposit Impactor (MOUDI)
(model 110, MSP Corporation, Minneapolis, USA) was employed for collection of size-resolved smoke parti-cles, flow rate of 25–30 l/min. Aerosols were separated into 9 fractions with calibrated aerodynamic cutoffs of 18, 10.0, 3.2, 1.8, 1.0, 0.56, 0.33, 0.175 and 0.093 µm. Sampling was carried out on Nuclepore® polycarbonate (Whatman) filters with 47 mm diameter, and a Teflon back-up filter was used for collection of the particles
<0.093 µm.
Flow rates and sampling volumes were determined by Hast-ings mass flowmeters for the SFU and MOUDI samples. The
loaded filters were placed immediately in clean plastic Petris-lide dishes (for SFU and MOUDI samples) or in prebaked aluminum foil (for the HiVol samples) and stored at −25◦C
until analysis. Filter blanks were obtained using the same loading and unloading procedure as for normal filters but with a sampling time of only 15 s.
2.2 Possible sampling artifacts
When sampling for OC and WSOC on a quartz fiber filter, the following positive artifacts may occur: (1) Adsorption of volatile organic compounds (VOCs) by the filter and ac-cumulated aerosol particles, (2) adsorption of the gas-phase component of semi-volatile organic compounds (SVOCs) by the filter and by accumulated aerosol particles. A possible negative artifact (3) may be evaporation/sublimation of par-ticulate organic compounds collected on the filter.
In undenuded sampling with a front and back filter, the particulate-phase OC is normally obtained by subtracting OC on the back filter from that on the front filter. A number of assumptions are made when doing this correction: (1) mass/filter area amount of each VOC and SVOC adsorbed from the gas phase is equal for front and backup filters; (2) the gas adsorption capacity of the front and backup filter are equal; and (3) SVOCs observed on the backup filter do not derive from evaporation of particles collected on the front fil-ter (Mader et al., 2003). When dealing with artifacts for indi-vidual compounds, the above mentioned positive artifact (2) and the negative artifact (3) still exist, but (1) does not. It is possible to use back-to-front filter ratios to evaluate sampling artifacts and to assess the semivolatility of species (Novakov et al., 1997; Turpin et al., 2000; Limbeck et al., 2001).
When sampling on a Nuclepore substrate, as for the SFU sampler and MOUDI impactor, positive artifacts are re-duced to gas phase adsorption by collected aerosol particles themselves, because the substrate adsorbs substantially less than quartz fiber filter. A negative artifact due to evapo-ration/sublimation may still exist for the SFU sampler and MOUDI impactor due to the lower pressures inside the sam-plers at the lowest stages. However, in a paper summarizing the results of particulate matter (PM) measurements during the INTERCOMP2000 intercomparison experiment (Hitzen-berger et al., 2004), concentrations obtained by SFU with Nuclepore substrate and by MOUDI impactor do not deviate significantly from the average of concentrations obtained by numerous different methods.
Considering the foregoing, it can be expected that concen-trations obtained from the quartz fiber HiVol samples will be overestimated relative to those obtained from the SFU and MOUDI samples collected on Nuclepore, as was also found by Salma et al. (2004). In such a case, the back-to-front filter ratios of the HiVol samples can be used to assess the extent of overestimation, and species volatility. A detailed inter-comparison between the different sampling instrumentation deployed in the SMOCC field campaign is beyond the scope
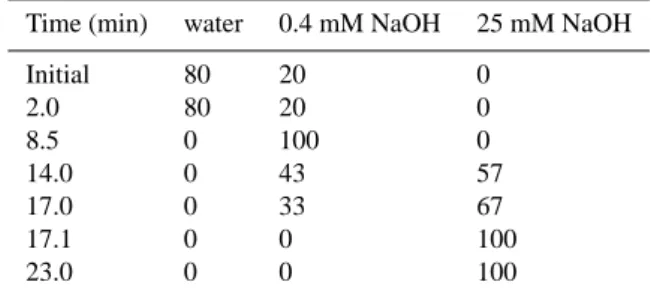
Table 1. Elution gradient used for anion chromatography.
Time (min) water 0.4 mM NaOH 25 mM NaOH
Initial 80 20 0 2.0 80 20 0 8.5 0 100 0 14.0 0 43 57 17.0 0 33 67 17.1 0 0 100 23.0 0 0 100
of this paper and will be discussed in other papers of the ACP SMOCC special issue (Maenhaut et al., 2004; Claeys et al., 20051; Schkolnik et al., 2005; Trebs et al., 2005; Decesari et al., 2005a2, b3).
2.3 Ion chromatography (IC) analysis
Inorganic and organic ionic species were quantified by ion chromatography after extraction of filters with water. The extraction and analytical procedures have been thoroughly validated (Falkovich et al., 2004).
2.4 Materials
The following chemicals and standards were used: (1) Sodium hydroxide 50% (w/w) solution, J. T. Baker, Phillips-burg, NJ, USA; (2) Anionen multi-element standard I (F−, PO3−4 and Br−, 1000 mg/l), Anionen multi-element stan-dard II (Cl−, NO−3, SO2−4 , 1000 mg/l), Nitrite standard so-lution (NO−2, 1000 mg/l) and Sodium iodide GR (99.5%), Merck, Darmstadt, Germany; (3) Six Cation – II Standard, Dionex, Sunnyvale, CA; (4) Organic acid and anion stan-dards, Riedel-de Haen, Seelze, Germany, Fluka Chemie, Switzerland, Sigma-Aldrich Chemie Gmbh, Steinheim, Ger-many, and Supelco, Bellefonte, PA.
1Claeys, M., Pashynska, V., Kourtchev, I., Vermeylen, R.,
Cafmeyer, J., Artaxo, P., and Maenhaut, W.: Levoglucosan and se-lected polar organic compounds in boundary layer aerosols during the LBA/CLAIRE/SMOCC-2002 campaign, in preparation, 2005.
2Decesari, S., Fuzzi, S., Maenhaut, W., Tagliavini, E.,
Falkovich, A. H., Schkolnik, G., Rudich, Y., Guyon, P., Claeys, M., and Artaxo, P.: Apportionment of particulate OC into individ-ual compounds and chemical classes in carbonaceous aerosol sam-ples collected during the dry-to-wet season transition in Rondˆonia, Brazil, in preparation, 2005a.
3Decesari, S., Fuzzi, S., Maenhaut, W., Tagliavini, E.,
Falkovich, A. H., Rudich, Y., Guyon, P., Mayol-Bracero, O., Fisch, G., Claeys, M., and Artaxo, P.: Inorganic and organic composition of size-segregated aerosols in the dry-to-wet season transition, in preparation, 2005b.
2.5 Sample preparation
Aqueous aerosol extracts were prepared by shaking a portion of the loaded filters vigorously for 15 min in Nanopure water (18.0 M-cm) in capped glass vials. Sample solutions were left for an hour in the dark and then were filtered with pre-washed GHP Acrodisk® (Gelman, 0.45 µm) syringe filters. A whole MOUDI filter or a half of SFU filter were extracted once with 4 ml of water; a quarter of a HiVol filter was ex-tracted twice with 5 ml portions of water.
2.6 Ion chromatography conditions
The IC analysis was carried out using a Varian ProStar HPLC system equipped with a Dionex ED50 electrochemical de-tector at isothermal (24◦C) conditions. Anions were deter-mined using a Dionex AS11 analytical column and ASRS-Ultra suppressor in autosuppression mode. For simultane-ous separation of inorganic and short-chain (C1-C9)organic
anions, gradient elution by 0.4–25 mM NaOH (2 mL/min) was employed (Table 1). Cations were determined using a Dionex CS12 column and CSRS-Ultra suppressor in auto-suppression mode with 20 mM methanesulfonic acid (MSA) as an eluent (1 ml min−1). All ions were quantified against standard calibration curves. Concentration data are given as mass concentrations in air corrected to standard temperature and pressure, STP (298 K, 1000 hPa). The analyzed ionic species are listed in Table 2. Since all organic acids listed in Table 2 have been measured as their anionic forms, when discussing organic acids we refer to their anionic mass con-centrations.
In this study, 34 SFU samples (19 from the dry period, 7 from the transition and 8 from the wet period) and 22 HiVol samples (16 from the dry period, 5 from the transition and 1 from the wet period) were analyzed. Selected MOUDI samples (nine filter membranes each) were analyzed in this study: three MOUDI samples collected during the dry pe-riod: MDRO37 (23 September), MDRO39 (25 September) and MDRO40 (28 September), about 24 h sampling interval for each; two MOUDI samples collected during the transition period: MDRO53 (16–18 October, 38 h) and MDRO54 (18– 20 October, 44 h); and one MOUDI sample collected dur-ing the wet period: MDRO60b (6–10 November, 99 h). It is noted that while rain was very rare during the dry period, a 20 mm rain period occurred on the morning of 28 September (during the MDRO40 sampling).
2.7 Aerosol mass concentration (Particulate Mass – PM) and Water Soluble Organic Carbon (WSOC) determi-nation
Organic carbon, elemental carbon and water-soluble organic carbon (WSOC) in the aerosol were determined by the Department of Analytical Chemistry, Institute for Nuclear
Table 2. Organic and inorganic ions determined by ion chromatography in smoke samples.
Inorganic cations Na
+
, NH+4, K+, Mg++, Ca++
anionsa Cl−, NO−2, NO−3, SO2−4 , PO3−4 , CH3SO−3 (MSA)
monocarboxylic (MCA) formic, acetic, glycolic, glyceric, lactic,
pyruvic, glyoxylic, valeric, trichloracetic, threonic
dicarboxylic (DCA) oxalic, malonicb, hydroxymalonic, methylmalonic, maleic,
Anions of organic acids malic, succinic, methylsuccinic, dihydroxysuccinic, glutaric,
adipic, 2-hydroxyglutaric, tartaric, fumaric, azelaic
tricarboxylic (TCA) citric, tricarballylic
aromatic phthalic, syringic, 3-hydroxybenzoic, 4-hydroxybenzoic, vanillic, isovanillic
aCO2−
3 can not be determined by our anion chromatography system;
bMalonate concentration is underestimated because of its poor separation from the carbonate peak.
0 20 40 60 80 100 120 140 160 1 2 /0 9 /2 0 0 2 1 4 /0 9 /2 0 0 2 1 5 /0 9 /2 0 0 2 1 6 /0 9 /2 0 0 2 1 7 /0 9 /2 0 0 2 1 8 /0 9 /2 0 0 2 1 9 /0 9 /2 0 0 2 2 0 /0 9 /2 0 0 2 2 2 /0 9 /2 0 0 2 2 3 /0 9 /2 0 0 2 2 4 /0 9 /2 0 0 2 2 5 /0 9 /2 0 0 2 2 6 /0 9 /2 0 0 2 0 2 /1 0 /2 0 0 2 0 3 /1 0 /2 0 0 2 0 4 /1 0 /2 0 0 2 0 5 /1 0 /2 0 0 2 1 5 /1 0 /2 0 0 2 1 6 /1 0 /2 0 0 2 1 8 /1 0 /2 0 0 2 2 0 /1 0 /2 0 0 2 2 2 /1 0 /2 0 0 2 2 4 /1 0 /2 0 0 2 2 6 /1 0 /2 0 0 2 2 8 /1 0 /2 0 0 2 3 0 /1 0 /2 0 0 2 0 1 /1 1 /2 0 0 2 0 3 /1 1 /2 0 0 2 0 7 /1 1 /2 0 0 2 0 1 /1 1 /2 0 0 2 0 1000 2000 3000 4000 5000 6000 7000 8000 DRY WET NO-3 SO--4 Oxalate. NH+4 K+ Io n ic m a s s c o n c e n tr a ti o n , n g m -3 D a t e TRANSITION µ g m -3 F P M
Fig. 1. Mass concentrations of the five major ions in the fine size fraction of SFU aerosol samples collected at FNS, Rondˆonia, Brazil,
September–November, 2002. The dashed line is the fine particle mass concentration (FPM).
Sciences, Ghent University. The detailed technique is pub-lished elsewhere (Chi and Maenhaut, 20054).
Aerosol mass concentrations were determined for each size bin using the SFU and MOUDI samples. It was mea-sured gravimetrically in a Mettler electronic microbalance with 1 microgram sensitivity. Before weighing, the Nucle-pore filters were left for 24 h under radioactive sources for static electricity removal, and under a constant temperature of 18◦C and 50% relative humidity. Each filter was weighed 3 times on different days, and the average of the three masses
4Chi, X. and Maenhaut, W.: Organic carbon, elemental carbon
and water-soluble organic carbon in the PM2.5 aerosol at different sampling sites, Atmos. Chem. Phys. Discuss., in preparation, 2005.
reported. The air volume through the filters was measured using precision mass flowmeters.
3 Results
In general, throughout the entire sampling interval, potas-sium, ammonium, nitrate, sulfate and C2-C6 dicarboxylic
acids (DCA) accounted for more than 92% of the total ionic mass concentration of the smoke particles. The fol-lowing results and discussion will focus mainly on tempo-ral changes in concentrations of the ions and on their size distributions, with emphasis on the C2-C6 DCA (including
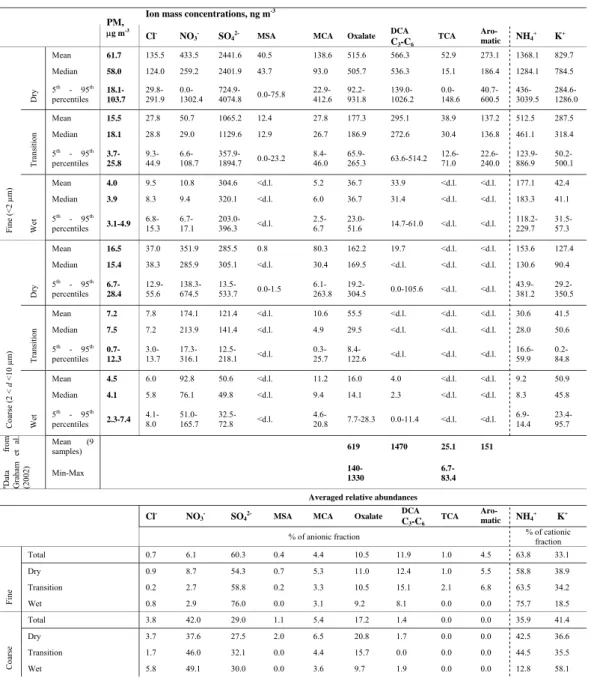
Table 3. Selected particulate mass concentrations (µg m−3)and ionic mass concentrations (ng m−3)identified by IC in aqueous extracts of SFU aerosol samples from FNS, Brazil, 2002.
21
Table 3. Selected particulate mass concentrations (µg m-3) and ionic mass concentrations (ng m -3) identified by IC in aqueous extracts of SFU aerosol samples from FNS, Brazil, 2002.
Ion mass concentrations, ng m-3
PM, µg m-3 Cl NO3 SO4
2-MSA MCA Oxalate DCA
C3-C6 TCA Aro- matic NH4 + K+ Mean 61.7 135.5 433.5 2441.6 40.5 138.6 515.6 566.3 52.9 273.1 1368.1 829.7 Median 58.0 124.0 259.2 2401.9 43.7 93.0 505.7 536.3 15.1 186.4 1284.1 784.5 Dr y 5th - 95th percentiles 18.1-103.7 29.8-291.9 0.0-1302.4 724.9-4074.8 0.0-75.8 22.9-412.6 92.2-931.8 139.0-1026.2 0.0-148.6 40.7-600.5 436-3039.5 284.6-1286.0 Mean 15.5 27.8 50.7 1065.2 12.4 27.8 177.3 295.1 38.9 137.2 512.5 287.5 Median 18.1 28.8 29.0 1129.6 12.9 26.7 186.9 272.6 30.4 136.8 461.1 318.4 T rans iti on 5th - 95th percentiles 3.7-25.8 9.3-44.9 6.6-108.7 357.9-1894.7 0.0-23.2 8.4-46.0 65.9-265.3 63.6-514.2 12.6-71.0 22.6-240.0 123.9-886.9 50.2-500.1 Mean 4.0 9.5 10.8 304.6 <d.l. 5.2 36.7 33.9 <d.l. <d.l. 177.1 42.4 Median 3.9 8.3 9.4 320.1 <d.l. 6.0 36.7 31.4 <d.l. <d.l. 183.3 41.1 Fine (<2 µm) Wet 5th - 95th percentiles 3.1-4.9 6.8-15.3 6.7-17.1 203.0-396.3 <d.l. 2.5-6.7 23.0-51.6 14.7-61.0 <d.l. <d.l. 118.2-229.7 31.5-57.3 Mean 16.5 37.0 351.9 285.5 0.8 80.3 162.2 19.7 <d.l. <d.l. 153.6 127.4 Median 15.4 38.3 285.9 305.1 <d.l. 30.4 169.5 <d.l. <d.l. <d.l. 130.6 90.4 Dr y 5th - 95th percentiles 6.7-28.4 12.9-55.6 138.3-674.5 13.5-533.7 0.0-1.5 6.1-263.8 19.2-304.5 0.0-105.6 <d.l. <d.l. 43.9-381.2 29.2-350.5 Mean 7.2 7.8 174.1 121.4 <d.l. 10.6 55.5 <d.l. <d.l. <d.l. 30.6 41.5 Median 7.5 7.2 213.9 141.4 <d.l. 4.9 29.5 <d.l. <d.l. <d.l. 28.0 50.6 T rans iti on 5th - 95th percentiles 0.7-12.3 3.0-13.7 17.3-316.1 12.5-218.1 <d.l. 0.3-25.7 8.4-122.6 <d.l. <d.l. <d.l. 16.6-59.9 0.2-84.8 Mean 4.5 6.0 92.8 50.6 <d.l. 11.2 16.0 4.0 <d.l. <d.l. 9.2 50.9 Median 4.1 5.8 76.1 49.8 <d.l. 9.4 14.1 2.3 <d.l. <d.l. 8.3 45.8 Coar se ( 2 < d <10 µm ) Wet 5th - 95th percentiles 2.3-7.4 4.1-8.0 51.0-165.7 32.5-72.8 <d.l. 4.6-20.8 7.7-28.3 0.0-11.4 <d.l. <d.l. 6.9-14.4 23.4-95.7 Mean (9 samples) 619 1470 25.1 151 aData fr om G rah am et al . (200 2) Min-Max 140-1330 6.7-83.4 Averaged relative abundances
Cl
NO3
SO4
2-MSA MCA Oxalate DCA
C3-C6 TCA
Aro-
matic NH4
+
K+
% of anionic fraction % of cationic fraction
Total 0.7 6.1 60.3 0.4 4.4 10.5 11.9 1.0 4.5 63.8 33.1 Dry 0.9 8.7 54.3 0.7 5.3 11.0 12.4 1.0 5.5 58.8 38.9 Transition 0.2 2.7 58.8 0.2 3.3 10.5 15.1 2.1 6.8 63.5 34.2 Fine Wet 0.8 2.9 76.0 0.0 3.1 9.2 8.1 0.0 0.0 75.7 18.5 Total 3.8 42.0 29.0 1.1 5.4 17.2 1.4 0.0 0.0 35.9 41.4 Dry 3.7 37.6 27.5 2.0 6.5 20.8 1.7 0.0 0.0 42.5 36.6 Transition 1.7 46.0 32.1 0.0 4.4 15.7 0.0 0.0 0.0 44.5 35.5 Coar se Wet 5.8 49.1 30.0 0.0 3.6 9.7 1.9 0.0 0.0 12.8 58.1
aThe organic acid mass concentrations were measured by gas chromatography – mass spectrometry (GC/MS) at the
same FNS pasture site during dry and transition periods, 1-29 October, 1999, as a part of LBA experiment.
aThe organic acid mass concentrations were measured by gas chromatography – mass spectrometry (GC/MS) at the same FNS pasture site
during dry and transition periods, 1–29 October 1999, as a part of LBA experiment.
listed in Table 2). The results are presented according to the sampling devices. Additional information on the inorganic and organic – both ionic and neutral – composition of bulk and size-resolved aerosols sampled during the burning pe-riod and dry-to-wet season transition appears in further pub-lications related to the SMOCC campaign (Maenhaut et al., 2004; Claeys et al., 20051; Schkolnik et al., 2005; Trebs et al., 2005; Decesari et al., 2005a2, b4).
3.1 Stacked filter unit (SFU) data
The concentrations of particulate mass (PM) ranged from 2.7 to 148.1 µg m−3 for the fine size fraction (FPM) and from 0.5 to 31.1 µg m−3 for the coarse size fraction (see Table 3 for detailed data). The highest FPM concentra-tions were measured during the dry period, when biomass burning emissions were most intense. In the transition and wet periods, FPM concentrations were considerably smaller.
1 4 /0 9 /2 0 0 2 1 5 /0 9 /2 0 0 2 1 7 /0 9 /2 0 0 2 1 8 /0 9 /2 0 0 2 1 9 /0 9 /2 0 0 2 2 3 /0 9 /2 0 0 2 2 5 /0 9 /2 0 0 2 0 3 /1 0 /2 0 0 2 0 4 /1 0 /2 0 0 2 1 6 /1 0 /2 0 0 2 1 8 /1 0 /2 0 0 2 2 4 /1 0 /2 0 0 2 2 4 /1 0 /2 0 0 2 0 1 /1 1 /2 0 0 2 0 3 /1 1 /2 0 0 2 0 6 /1 1 /2 0 0 2 1 0 /1 1 /2 0 0 2 0 10 20 30 40 50 60 70 80 90 WET TRANSITION R e la ti v e a b u n d a n c e ( % ) Date NO-3 SO--4 Oxalate . DCA C2-C6 DRY
Fig. 2. Relative abundances of anions in the SFU fine mode anionic
fraction.
The temporal variations in FPM concentration are shown in Fig. 1. Throughout the sampling interval, mass concentra-tions of the five major ions (potassium, ammonium, nitrate, sulfate and oxalate) followed similar temporal trends to the FPM (Fig. 1).
The mass concentrations and relative abundances (%) of ions determined in the SFU samples are given in Table 3. Temporal variations in the relative abundances of nitrate, sul-fate, C3 to C6 DCA (lumped together) and oxalate in the
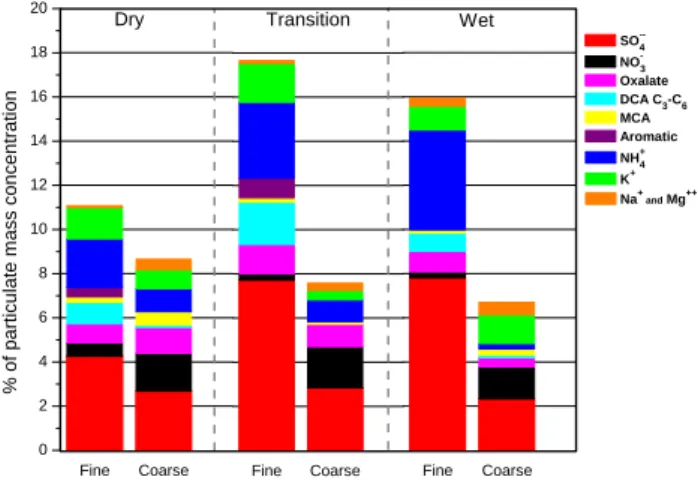
fine anionic fraction are shown in Fig. 2. The mean total ionic mass fractions for the dry, transition and wet periods were 11.4%, 18.2% and 16.2% respectively of the fine par-ticle mass and 8.8%, 7.8% and 6.9% of the coarse parpar-ticle mass (Fig. 3). The anionic fraction of fine smoke particles consists mostly of sulfate (average about 60%) followed by C2-C6DCA (average about 22.5%, with oxalate accounting
for about half of it). The nitrate average relative abundance was only about 6%. The average relative abundance of nitrate was not substantially greater than that of the aromatic acids and monocarboxylic acids (MCA), while the average relative abundance of tricarboxylic acids (TCA) reached about 1%. The cationic fraction is dominated by ammonium (>60%) and K+ (>30%; not shown). The K+ to NH+4 mass ratio in the fine size fraction decreased from 0.7±0.2 in the dry period to 0.25±0.05 in the wet period (Fig. 4), presumably reflecting the decrease in fresh biomass burning emissions, and mixing with different aerosol types. It is noted, though, that realtime inorganic composition measurements differed somewhat from the filter results (Trebs et al., 2004). An inter-comparison of different samplers’ performances and results will be discussed in a subsequent paper.
Interestingly, while the total ionic mass fraction in the dry, transition and wet periods did not differ much, the composi-tion of both anionic and cacomposi-tionic fraccomposi-tions was substantially different in the wet period (Table 3; Figs. 2 and 3). In wet
Fine Coarse 0 2 4 6 8 10 12 14 16 18 20 Dry % o f p a rt icu la te m a ss co n ce n tr a ti o n Fine Coarse Transition Fine Coarse Wet SO--4 NO-3 Oxalate . DCA C3-C6 MCA . Aromatic. NH+ 4 K+ Na+ and Mg++
Fig. 3. Ionic mass fractionain the fine and coarse size fractions of SFU samples collected at FNS, Rondˆonia, September–November, 2002. For ion concentration range refer to Table 3.
a For presentation purposes, MSA and TCA accounting together
for about 0.25% of FPM in the dry and transition periods and Cl−
accounting for about 0.2% of particulate mass in each fraction for each period are not shown.
1 2 /0 9 /2 0 0 4 1 6 /0 9 /2 0 0 4 2 0 /0 9 /2 0 0 4 2 4 /0 9 /2 0 0 4 2 8 /0 9 /2 0 0 4 0 2 /1 0 /2 0 0 4 0 6 /1 0 /2 0 0 4 1 0 /1 0 /2 0 0 4 1 4 /1 0 /2 0 0 4 1 8 /1 0 /2 0 0 4 2 2 /1 0 /2 0 0 4 2 6 /1 0 /2 0 0 4 3 0 /1 0 /2 0 0 4 0 3 /1 1 /2 0 0 4 0 7 /1 1 /2 0 0 4 1 1 /1 1 /2 0 0 4 0.0 0.2 0.4 0.6 0.8 1.0 1.2 TRANSITION WET DRY av.=0.7±0.2 av.=0.25±0.05 K +/N H4 + Date
Fig. 4. Potassium-to-ammonium ratio in SFU fine size fractions.
period samples, the relative abundances of MCA and (to a lesser extent) DCA decreased, TCA and aromatic acids were absent, and sulfate and ammonium became more dominant, particularly in the fine fraction.
Ion concentrations of sulfate and potassium in the fine fraction measured by IC were compared with their elemen-tal concentrations measured by IFUSP (Institute of Physics, University of S˜ao Paulo) by particle-induced X-ray emission (PIXE) for the same samples, for data quality assurance. Fig-ure 5 shows a very good correlation between the cation and anion chromatography results and the PIXE data, corroborat-ing the ion chromatography results.
Dicarboxylic C2-C6acids made up 2.0% (SD=1.1%;
0 400 800 1200 1600 0 400 800 1200 1600 2000 y=1.1x-21.3 R2=0.97 K f ro m P IX E , n g m -3 K from IC, ng m-3 (a) 0 400 800 1200 1600 0 400 800 1200 1600 2000 y=1.2x-43.3 R2=0.97 S f ro m P IX E , n g m -3
S from IC (as a third of SO4
mass concentration), ng m-3
(b) Fig. 5. Comparison between Potassium (a) and Sulfur (b) mass concentrations measured by PIXE and by ion chromatography in samples
collected in FNS, Rondˆonia, Brazil, 2002.
Table 4. Selected size resolved ion mass concentrations identified by IC in aqueous extracts of MOUDI aerosol samples from FNS, Rondˆonia,
Brazil, September–November, 2002.
22
Table 4. Selected size resolved ion mass concentrations identified by IC in aqueous extracts of
MOUDI aerosol samples from FNS, Rondônia, Brazil, September – November, 2002.
Ion mass concentrations normalized to the size bin, ng m-3 (d C / d log Dp)
Cut off, µm PM, ng m-3 NO3 SO4
2-MCA Oxalic Malonic DCA
C4-C6 Aro- matic NH4 + K+ <0.093 1265.7 0.4 43.5 4.6 6.2 0.0 6.3 0.0 20.0 7.4 0.093 24321.6 27.7 910.9 148.5 194.7 0.0 176.2 0.0 436.1 247.3 0.175 67917.1 376.3 2262.7 462.3 793.3 128.5 519.6 293.8 1111.8 808.2 0.33 149221.2 1869.6 6998.6 1832.5 937.9 476.5 1426.0 842.4 2657.4 1806.6 0.56 75356.6 887.2 3624.9 910.7 1260.1 235.2 700.8 1134.3 1163.6 775.8 1 39116.0 444.5 1542.7 447.8 629.1 89.7 346.9 0.0 378.8 350.6 1.8 14044.7 280.5 247.6 59.2 197.8 13.7 15.9 0.0 0.0 25.1 3.2 19403.2 545.5 147.5 55.9 123.7 16.6 14.3 0.0 9.7 42.9 M D R O 37 ( dry p eriod) 10 7150.2 122.0 33.9 67.8 15.8 0.0 0.0 0.0 0.0 0.0 <0.093 565.9 0.5 13.8 3.2 2.6 0.0 0.9 0.0 4.5 3.9 0.093 11298.1 18.2 251.4 62.2 48.9 0.0 15.9 0.0 83.9 118.6 0.175 19993.5 85.3 386.5 150.2 192.8 17.1 74.3 36.8 167.9 190.2 0.33 22951.1 168.7 1005.4 190.2 247.8 31.3 176.9 62.2 348.0 295.5 0.56 8982.5 25.2 359.8 60.5 124.7 11.0 31.9 56.4 130.5 100.0 1 5609.7 60.6 173.9 67.4 75.3 3.4 11.5 0.0 24.0 30.8 1.8 4753.4 128.7 47.3 8.4 35.6 0.0 0.0 0.0 0.0 19.3 3.2 9812.4 191.8 33.0 27.4 27.8 1.6 14.3 0.0 8.3 69.5 M D R O 53 ( tran si tion p er io d) 10 3100.1 32.2 22.5 16.0 4.3 0.0 0.0 0.0 2.2 7.7 <0.093 177.5 0.1 7.8 0.2 0.6 0.0 0.2 0.0 2.4 1.3 0.093 1359.9 4.9 86.5 3.8 4.7 0.0 1.7 0.0 22.5 12.0 0.175 2851.6 4.5 240.2 5.1 7.7 1.6 19.7 0.0 84.9 28.5 0.33 2927.1 7.1 303.9 5.7 9.7 1.2 17.8 0.0 100.2 32.3 0.56 1703.4 5.5 150.3 1.7 8.5 0.0 4.1 0.0 44.0 16.0 1 1527.0 17.8 43.8 3.8 12.1 0.0 2.2 0.0 10.4 8.2 1.8 3402.7 48.0 29.3 5.2 13.4 0.0 5.4 0.0 6.1 19.8 3.2 1514.9 66.5 21.4 13.2 10.8 0.0 11.0 0.0 3.0 45.1 M D R O 60 b (w et pe ri od) 10 1710.2 14.1 8.1 3.7 3.1 0.0 0.0 0.0 0.6 4.1
(SD=0.6%; maximum=2%) of the fine fraction WSOC mea-sured in the dry period (WSOC data obtained from parallel HiVol samples was provided by Ghent University).
3.2 MOUDI data
The MOUDI measurements presented here provide for the first time, to the best of our knowledge, detailed information about the distribution of different organic ions in smoke par-ticles from Brazil as a function of the parpar-ticles’ aerodynamic size, following the transition from dry to wet periods. Mass concentration data for one set of MOUDI samples typical for each period is presented in Table 4 to exemplify the concen-tration ranges in the different periods. Concenconcen-trations are normalized to the size bin of each impactor stage (dC/d log Dp), where C is the mass concentration of a compound in
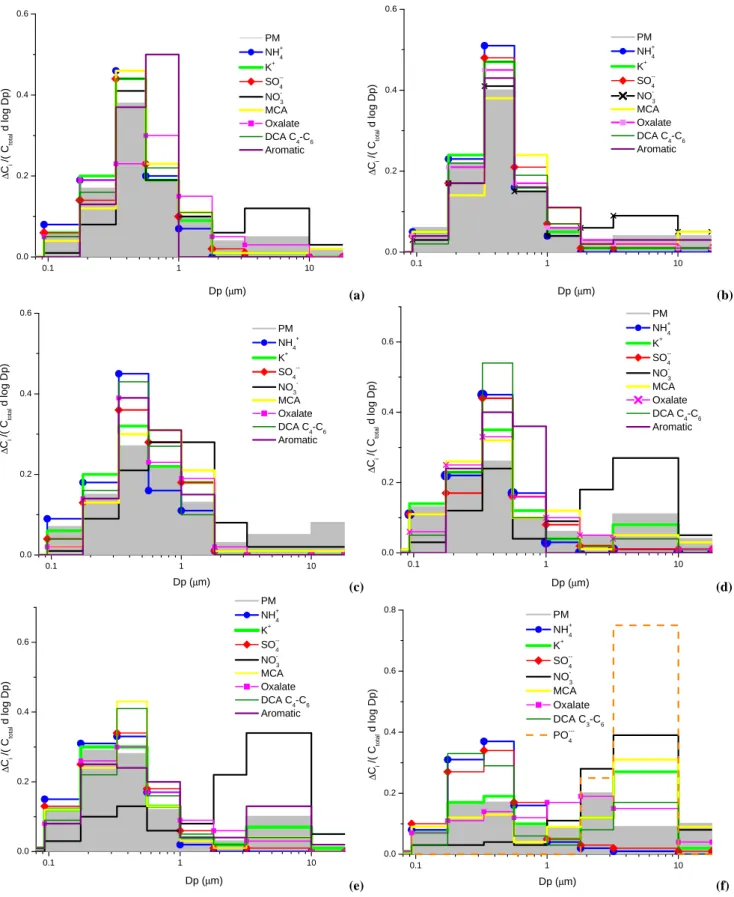
a specific size bin and Dp is particle aerodynamic diame-ter (Seinfeld and Pandis, 1997). Figure 6 shows normal-ized mass distributions of characternormal-ized ionic species in se-lected MOUDI samples, as well as mass loading (PM) as a function of size. To enable comparison between size dis-tributions of ions with significantly different mass loadings, Fig. 6a–f presents normalized mass distributions of the dif-ferent components dC/(Ct ot al d log Dp), where Ct ot al=6Ci
and Ciis the mass concentration of the specific species in the
i’th bin. For discussion purposes, particles with aerodynamic diameter smaller than 1.8 µm are classified as fine particles, and particles larger than 3.2 µm as coarse particles. In gen-eral, particles with aerodynamic diameter ranging between 1.8 and 3.2 µm have a small contribution to the total particu-late mass.
The following aspects of the ion size distributions are noted:
1. In agreement with the SFU data, the highest mass con-centrations of all ions in the fine mode were observed during the dry period, when biomass burning was most intense (Table 4).
2. Size distributions of PM and ionic species collected dur-ing the dry period are very similar to each other, es-pecially those in MDRO37 and MDRO39 (Fig. 6a, b). Most of the particulate mass was concentrated between 0.2-1 µm. The size distributions of NH+4, K+, SO2− 4
and all organic anions, MCA, DCA and one-ring aro-matic acids, also peaked in this size range. A very mi-nor amount of oxalate was found in particles larger than 1.8 µm. Only NO−3 exhibited a bimodal size distribu-tion with substantial mass fracdistribu-tion in the coarse mode. The size distributions of species in MDRO40 sample (Fig. 6c) exhibited, in general, features similar to those of MDRO37 and MDRO39, but the distribution maxi-mum was slightly skewed towards the higher size bins. PM exhibited some increase in the coarse mode as well. It was the only sample where a high concentration of Na+and Cl−was found in the coarse mode (not shown).
During sampling a 20 mm rain event occurred, an un-usual event for the dry season in Amazonia. The Cl−
molar concentration in a rainwater sample collected on the same day, and analyzed by the IFUSP group, was equal to that of Na+, indicating the presence of NaCl in the rainwater. The Cl−concentration in the rainwa-ter sample (200 µg/L) was almost as high as the SO2−4 concentration (230 µg/L) (Domingues and Artaxo, un-published results).
3. Size distributions of ionic species measured during the transition period (Fig. 6d, e) exhibited in general fea-tures similar to those observed in the dry period, but some K+ and organic acids were found also in the coarse mode. The PM distribution is similar to that ob-tained for the MDRO40 sample; however, very low Na+ and Cl−concentrations were observed in the transition period samples. NO−3 was mostly found in the coarse mode.
4. In the wet period sample, the particulate mass load-ing was distributed almost equally between all impactor stages (Fig. 6f). The fine mode continued to domi-nate only for ammonium and sulfate, while carboxylic acid distributions shifted to higher size bins. No aro-matic acids were found in the wet period. Both K+and NO−3 peaked in the coarse mode. Phosphate was found only in the wet period MOUDI sample and it was only present in the coarse mode.
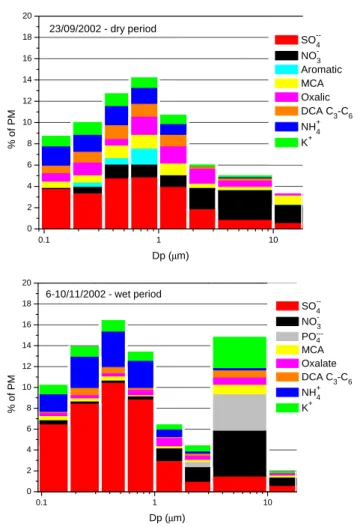
In Fig. 7 ionic mass concentrations as a percent of PM (hereafter referred to as ionic mass fraction) vs. particle size for a single sample from each of the dry and wet periods are presented. The ionic mass fractions in the dry, transition and wet periods account for about the same 15–16% of the PM (Cl− and TCA are not shown). However, the organic frac-tion in the fine mode size bins is substantially higher for dry period samples than the wet period sample (about 40% vs. 10%), with C2-C6 dicarboxylic acids making up the major
part of the organic ionic mass fraction in the fine mode. In the dry period, the total ionic mass fraction has a peak in the 0.56–1.0 µm range, while in the wet period, the maximum shifts to a smaller size range, 0.33–0.56 µm. Aromatic acids are confined only to the size bin with the highest ionic mass fraction, i.e. 0.56–1.0 µm, and are absent from the wet period sample.
3.3 High Volume sampler (HiVol) data
Ion mass concentrations in the front and back filters of the fine samples collected by the HiVol sampler during the dry and transition periods were determined. When performing an intralaboratory comparison between the SFU (polycar-bonate membrane) and HiVol (quartz fiber filter) samples, it was observed that some species (such as sulfate) corre-lated very well between the two sample sets, while other
0.1 1 10 0.0 0.2 0.4 0.6 PM NH+ 4 K+ SO --4 NO -3 MCA . Oxalate . DCA C 4-C6 Aromatic Dp (µm) ∆ Ci / ( Cto ta l d l o g D p ) (a) 0.1 1 10 0.0 0.2 0.4 0.6 PM NH+ 4 K+ SO --4 NO -3 MCA . Oxalate . DCA C 4-C6 Aromatic Dp (µm) ∆ Ci / ( Cto ta l d l o g D p ) (b) 0.1 1 10 0.0 0.2 0.4 0.6 PM NH 4 + K+ SO4 NO 3 MCA . Oxalate . DCA C 4-C6 Aromatic ∆ Ci / ( Cto ta l d l o g D p ) Dp (µm) (c) 0.1 1 10 0.0 0.2 0.4 0.6 PM NH+ 4 K+ SO --4 NO-3 MCA. Oxalate. DCA C4-C6 Aromatic Dp (µm) ∆ Ci / ( Cto ta l d l o g D p ) (d) 0.1 1 10 0.0 0.2 0.4 0.6 PM NH+ 4 K+ SO --4 NO -3 MCA . Oxalate . DCA C 4-C6 Aromatic Dp (µm) ∆ Ci / ( Cto ta l d l o g D p ) (e) 0.1 1 10 0.0 0.2 0.4 0.6 0.8 PM NH+ 4 K+ SO--4 NO-3 MCA. Oxalate. DCA C3-C6 PO ---4 ∆ Ci / ( Cto ta l d l o g D p ) Dp (µm) (f)
Fig. 6. Normalized size concentrations of ionic species as a function of the particle aerodynamic diameter in MOUDI samples collected in
FNS, Rondˆonia, Brazil, 2002: (a) MDRO37; (b) MDRO39; (c) MDRO40; (d) MDRO53; (e) MDRO54; (f) MDRO60b.
Table 5. Back-to-front filter ratio (%) determined by IC for aqueous extracts of HiVol aerosol samples from FNS, Brazil, 2002 (estimates
the positive artifact due to adsorption of gaseous compounds by filters).
Glycolic+Glyceric+ Formic NO−3 DCA C3-C6 SO42− Oxalate NH+4 K Acetic+Lactica median 29.10 23.55 7.97 4.54 5.07 7.40 1.28 1.20 mean 33.44 26.23 10.07 5.41 6.08 6.90 1.91 1.63 minimum 6.19 8.77 1.46 1.20 3.15 0.84 0.00 0.00 maximum 84.32 79.57 31.15 13.91 17.19 16.68 4.72 7.74 standard deviation 21.42 15.60 8.30 3.94 3.18 4.88 1.36 1.55
aDue to problematic separation, peaks are integrated as a group peak.
species, such as nitrate and oxalate, had concentrations about twice as high in HiVol samples as compared with SFU sam-ples. It is known that quartz fiber filters have a large specific area on which adsorption of gases can occur (Turpin et al., 2000). In addition, it is possible that the quartz fiber filter may be wetted at high relative humidities. Therefore, it is suggested that gas adsorption or oxidation processes occur-ring on the quartz fiber filters might have resulted in posi-tive artifacts during HiVol sampling. Consequently, we used the data obtained from the HiVol samples only for resolving issues which could not be fully addressed based on SFU sam-ples. On the other hand, it should be noted that negative ar-tifacts (volatilization losses) may have existed for the SFU and MOUDI samples, in particular in the fine size fractions, because of the relative low pressure conditions during sam-pling.
To estimate the positive artifact caused by adsorption of gaseous compounds by quartz fiber filters (Novakov et al., 1997; Turpin et al., 2000), ratios of the ionic mass concentra-tion on the back filter sample to that on the front filter sample were calculated for selected ions (Table 5). Among the or-ganic acids, only MCA and MSA were present in substantial amounts on the back filters (16–30% of the front filter con-centrations). Therefore, it appears that they have been sig-nificantly adsorbed from the gas phase, while DCA and aro-matic acid adsorption is comparable to that of a non-volatile compound such as sulfate.
4 Discussion
Evidently, the composition of the Amazonian aerosols ana-lyzed in this work was heavily impacted by vegetation com-bustion. However, since chemical composition evolves dur-ing aerosol agdur-ing, and combustion is not the only aerosol source in the region, it is challenging to evaluate the actual proportion of primary combustion products in the determined aerosol chemical composition. Fine size fraction K+ is a highly useful tracer for pyrogenic aerosols, since combustion of plant material releases large amounts of K+-rich particles in the submicrometer size mode (Andreae, 1983). The near
0.1 1 10 0 2 4 6 8 10 12 14 16 18 20 % o f P M Dp (µm) SO--4 NO-3 Aromatic. MCA. Oxalic. DCA C3-C6 NH+4 K+ 23/09/2002 - dry period 0.1 1 10 0 2 4 6 8 10 12 14 16 18 20 6-10/11/2002 - wet period % o f P M Dp (µm) SO--4 NO-3 PO ---4 MCA. Oxalate. DCA C3-C6. NH+4 K+
Fig. 7. Ionic mass fraction as a function of the particle aerodynamic
diameter in MOUDI samples collected in FNS, Rondˆonia, Brazil, 2002: (a) MDRO37; (b) MDRO60b.
unity slope in comparison with elemental analysis by PIXE (Fig. 5) indicates that almost all fine mode K in the parti-cles is present in water-soluble (cationic) form. Therefore, we consider fine size fraction species whose temporal profile correlates well with that of K+, as species which are pro-duced by vegetation combustion. We used this approach to
25
0 5 10 15 20
Dendrogram using Ward Method
Rescaled Distance Cluster Combine
K+ HCOO -CH3COO -NO3 -DCA C3-C6 NH4+ SO4 2-(COO)2 --PM Label Num 7 2 1 3 4 6 5 9 8 C A S E
Fig. 8. Dendrogram of the cluster analysis showing the grouping
of species determined in the fine fraction with similar characteristic for dry and transition periods.
investigate the origin of the low molecular weight organic acids. FPM and the mass concentrations of NH+4, NO−3, SO2−4 , DCA and aromatic acids measured in the SFU sam-ples (shown in Fig. 1) followed the same temporal trends as K+, suggesting that the fine aerosol, in general, and these ionic species, in particular, were produced mostly by vegeta-tion combusvegeta-tion.
4.1 Relationships between ionic species measured in SFU samples – cluster analysis
Cluster analysis was used to obtain statistically meaningful correlations between the major ionic species in the fine size fraction and to corroborate the conclusions derived based on the chemical analysis and the size distributions. Details of the procedure are described by Artaxo et al. (1990).
Results from cluster analysis of dry and transition period samples are shown graphically in Fig. 8 in the form of a den-drogram. K+highly correlates with FPM, indicating that the fine aerosols consist mainly of smoke particles, as was fur-ther supported by the size distributions and by temporal be-havior of levoglucosan, a specific biomass burning tracer, in a related paper (Schkolnik et al., 2005). The close association of oxalate to this cluster suggests that its dominating source is vegetation combustion and not secondary photochemical processes. Sulfate and NH+4, comprising non-volatile ammo-nium sulfate by gas to particle conversion, compose a sepa-rate cluster. The calculated molar ammonium to sulfate ra-tio obtained by IC analysis was greater than 2, suggesting that sulfate is completely neutralized by ammonia to form (NH4)2SO4salt.
The recently published size-resolved measurements re-porting episodes of elevated LMW DCA concentrations due to biomass burning plumes passing over the measurement site (Jaffrezo et al., 1998; Ma et al., 2003), have found that the size distributions of K and DCA were skewed toward
the accumulation mode and exhibited the very same shape as sulfate’s, suggesting internal mixing of these species in the same particles. Thus, considering the proximity of the DCA C3-C6 cluster to the ammonium sulfate cluster (Fig. 8), the similarity of their size distribution to that of SO2−4 and NH+4 (Fig. 6a, b) and their proximity to the PM and K+ cluster, we suggest that they have a strong common vegeta-tion combusvegeta-tion source, and that they may form ammonium salts, which may play an important role in determining the thermodynamic properties of the aerosol (Trebs et al., 2005). Acetic and formic acids appear in the furthest class, suggest-ing that they either have a different source in the particles, or behave differently from the other species considered here, due to their higher vapor pressure.
4.2 Size distributions of the ionic species
Analysis of the MOUDI samples shows that during the dry period, most of the particulate mass was concentrated in sizes smaller than 1.8 µm (Fig. 6a–c), peaking in mass at 0.2– 1 µm, indicating the dominant size range of the smoke parti-cles. In the dry period (Fig. 6a–c), PM and most of the ion size distributions exhibit a maximum between 0.33–0.56 µm. In a related paper, Decesari et al. (2005b)4show that in this size-bin, all species show a peak. Considering this, the peak of the total ionic mass to PM ratio between 0.56–1.0 µm in Fig. 7a, indicates that species which were not analyzed in this work, constitute a larger fraction in the 0.33–0.56 µm size-bin during the dry season.
C2-C6 DCA were mostly found in submicrometer
parti-cles and appear in the same cluster as (NH4)2SO4, closest to
FPM and K+ cluster (Fig. 8). Thus we infer that they have a common source. However, a relatively high abundance of oxalate was observed also in the coarse anionic fraction (Fig. 3 and Table 3), pointing to an additional potential DCA source. A field study in the Southern African savanna (For-menti et al., 2003) suggested a possible distribution pattern of oxalate during aerosol transport, whereby certain gas-phase smoke components are converted by atmospheric oxidants to DCA through sequential decarboxylation and oxidation. Therefore, DCA may have at least two sources: primary pro-duction during biomass burning and secondary propro-duction during aerosol transport.
Consistent with the conclusions from the SFU, the molar ammonium to sulfate ratio in the MOUDI samples was close to or greater than 2 in the 0.093–1.0 µm size range, indicating that all SO2−4 was neutralized to (NH4)2SO4, which is the
dominant salt in these aerosols. The size distributions of the aromatic and aliphatic carboxylic acids are similar to that of K+, suggesting that they were predominantly emitted with smoke aerosol.
Nitrate has a bimodal size distribution, with a contribu-tion from the coarse mode, consistent with the SFU sam-ples and the cluster analysis (Table 3, Fig. 8), suggesting that a process other than direct emission is responsible for
nitrate in the coarse mode. Recent studies on nitrate in biomass burning plumes suggested that NOx emitted from
the fires forms nitric acid by reactions with atmospheric oxi-dants such as O3or OH· (Gao et al., 2003), which condenses
onto alkaline particles such as mineral dust or biomass burn-ing aerosol (Tabazadeh et al., 1998; Song and Carmichael, 2001). Therefore, nitrate is a secondary product in biomass burning aerosols replacing organic and inorganic anions with HNO3(Tabazadeh et al., 1998; Trebs et al., 2005), or through
neutralization of nitric acid by ammonium to form ammo-nium nitrate (NH4NO3)(Seinfeld and Pandis, 1997).
An increase in PM and high Na+and Cl−concentrations observed in the coarse mode of sample MDRO40, coincided with a short rain event. The equal Na+and Cl−molar
con-centration in a rainwater sample collected on the same day may indicate the presence of aged sea salt in the rainwater. However, penetration of marine air masses to the sampling area seems improbable. Even if air masses from the Atlantic reached the Rondˆonia region, most of the marine aerosols would be wet-deposited during the several days of transport. We currently do not have a good explanation for the presence of NaCl in these samples.
In the wet period MOUDI samples, PM is distributed al-most equally among all impactor stages. Carboxylic acids as well as K+ appear also in the higher size bins. This ob-servation reflects a relative dearth of fresh smoke emissions, and implies the existence of other sources, not from biomass burning, for these species. This is consistent with the absence of levoglucosan, a specific biomass burning tracer, from the coarse mode in all periods (Schkolnik et al., 2005). A possi-ble source for such carboxylic acids may be biogenic emis-sions (Guyon et al., 2004; Kocak et al., 2004). This is further substantiated by the presence of phosphate (known to be a biogenic emission marker) which was observed exclusively in the wet period MOUDI sample and only in the coarse mode. The contribution from other aerosol sources agrees also with the crustal enrichment factor for K in the coarse modes in the wet period which was typically around 3 with respect to Mason’s average crustal rock composition (Ma-son and Moore, 1982), using Al as crustal reference element. This indicates that an additional aerosol source may be min-eral dust, plant debris, plant spores or bacteria. The high DCA concentrations in the coarse mode could be also partly attributed to photochemical processes followed by conden-sation (Chebbi and Carlier, 1996). It was also suggested that oxalic and malonic acids can be produced by degradation of higher DCA on particles (Kawamura and Ikushima, 1993). Finally, the shift of DCA and K+ to higher sizes may also suggest mixing between aerosol populations by in-cloud pro-cessing followed by evaporation.
4.3 Organic acids in the tandem front/back filter system (HiVol)
The ubiquity of DCA in biomass burning particles requires that their concentrations in aerosols be accounted for cor-rectly in models. Although carboxylic acids have been stud-ied in the gas and particulate phases, most of the data refer to monocarboxylic acids (formic and acetic). To our knowl-edge, the few field studies that attempted to monitor gas-particle partitioning of dicarboxylic acids have led to contra-dicting conclusions about their semi-volatile behavior (Sax-ena and Hildemann, 1996; Baboukas et al., 2000; Limbeck et al., 2001; Mochida et al., 2003). Specifically, recent field studies reported that low molecular weight DCA are semi-volatile (Baboukas et al., 2000; Limbeck et al., 2001), while other studies concluded that they are mostly confined to the particulate phase (Saxena and Hildemann, 1996; Mochida et al., 2003). Limbeck’s conclusions about semi-volatile behav-ior of the C2-C6DCA were based on the presence of
signifi-cant concentrations of DCA on the back filter (Limbeck et al., 2001). In contrast, C2-C6DCA concentration ratios of back
to front filters in our samples did not exceed 0.071±0.066. A similar ratio (0.059±0.034) was obtained for the non-volatile sulfate.
The sampling set-up applied in the present study does not differ substantially from that used by Limbeck et al. (2001), where samples were collected using an open-faced low-volume sampler equipped with a front/back filter tandem sys-tem of quartz fiber filters. A major difference is that in the Limbeck et al study, sampling intervals were about a week, and collected samples were stored in a refrigerator (0–4◦C) until analysis (Limbeck et al., 2001). In the current study, the sampling intervals were shorter (about 12 h) except for five transition period samples, which were collected for 24–36 h. Loaded filters were immediately placed in a freezer (−25◦C)
and thus stored until analysis. Another plausible explanation for the different conclusions is that the prolonged sampling on quartz fiber filters leads to production of oxalic and suc-cinic acids on the back filters. Oxalic and sucsuc-cinic acids can form by oxidation of high molecular weight organics, such as aromatic compounds or unsaturated fatty acids, while mal-onic acid cannot be produced by this pathway (Kawamura et al., 1996; Gao et al., 2003). In the study of Limbeck et al. (2001), malonic acid was confined mostly to the front fil-ter, while oxalic and succinic acids were found also in back filters. Additional possible differences between the two stud-ies can arise from different particles’ acidity. Rondˆonia par-ticles are neutral or slightly basic.
We have not found evidence for semi-volatility of DCA, and conclude that they are confined to the aerosol phase in this case. This may arise from the neutral or slightly alka-line character of the particles and from the high humidity during the field campaign, contrary to sampling conditions and aerosol pH reported where semi-volatility of LMW DCA was observed (Limbeck et al., 2001, 2005). A mechanism of
Table 6. Recent studies of low molecular weight DCA in biomass burning aerosols.
Region DCA Analytical Oxalic Sum of all DCA References
identified method µg m−3 µg m−3
Amazon basin, 2002 C2-C6, IC range: 0.033–2.5 this work
including branched, 0.022–1.34
keto- and hydroxyacids
Amazon basin, 1992 C2 IC in different Allen and Miguel (1995)
vegetation types: 0.3–28.8
Central Africa, 1996 C2 IC 0.05–1.17 Ruellan et al. (1999)
Indonesian forest, 1997 C2-C12 GC/MS 0.087–3.8 Narukawa et al. (1999)
South African savanna, 1997 C2 IC 0.18 Puxbaum et al. (2000)
Arabian Sea, 1999 C2 GC/MS 0.18 Neususs et al. (2002)
Amazon basin, 1999 C2-C6, oxalic-IC; range: 0.14–1.33 1.47 Graham et al. (2002)
including branched, rest-GC/MS
keto- and hydroxyacids
ACE-Asia, 2001 C2-C5 GC/MS 0.12–0.63 0.16–0.90 Mader et al. (2004)
DCA confinement to the particle phase is by formation of ammonium salts of the DCA which was observed in these particles (Trebs et al., 2005). The ammonium salts would have lower vapor pressure than the free acids. Such a reduc-tion in the volatility of inorganic acids due to high ammo-nium concentrations has already been observed by Pathak et al. (2004). In addition, a laboratory study (Prenni et al., 2001) found that LMW DCA partition to the condensed phase, and that once wetted in the atmosphere, these com-pounds remain as a metastable solution, even when dried to less than 5% RH. These results suggest that at high relative humidity typical for the tropical rainforest (60–100%), DCA are expected to be confined to the aerosol phase. Using a high-volume air sampler and an annular denuder sampling system with a Na2CO3 coated denuder to trap gaseous
or-ganic acids and a Na2CO3impregnated quartz fiber filter to
collect particles, Mochida et al. (2003) also measured C2
-C5DCA gas to particle partitioning, showing that their
ac-tual fractions in particles are close to unity. Saxena and Hildemann (1996) reached similar conclusions about DCA semivolatility.
4.4 Comparison with previous studies on organic acids in aerosols from vegetation burning
Detailed composition data on the ionic fraction of biomass burning aerosols is essential for understanding the impact of smoke aerosol on atmospheric chemistry and climate. Sev-eral studies have contributed to our current knowledge of or-ganic acids in biomass burning. Some characterization stud-ies of dicarboxylic acids in smoke aerosols collected during field campaigns in different locations and different vegeta-tion types have been conducted. Table 6 summarizes some published DCA composition data obtained for biomass burn-ing aerosols in different parts of the world. In these studies,
DCA in general and oxalic acid in particular, appear to be the major identified particulate organic species, with mass concentrations up to 1–4 µg m−3. It can be seen that the composition data from a field study carried out in 1999 at the same sampling site as the present study (Graham et al., 2002) agrees with the measurements presented here. The consis-tency between the two datasets (see Table 6) allows us to consider them representative for the emissions produced by vegetation combustion in the Amazon region. However, the 1999 study lacks the temporal variations and the size distri-butions reported here.
Highly dissociated organic species may affect aerosols’ hygroscopic and cloud-nucleating properties, although their carbon mass fraction in WSOC averages about 3%. De-spite the fact that organic carbon (OC) is a typical param-eter directly measured to quantify the organic fraction in aerosols, organic aerosol mass is more important to the chemical and physical properties of aerosols. As opposed to non-oxygenated hydrocarbons, oxygenated organic com-pounds, such as organic acids, contain groups whose mass and volume are substantial. Organic acids in aerosol parti-cles have large organic matter (OM) to OC ratios (Mochida et al., 2003) because they contain oxygen atoms in -COOH functional groups. The OM/OC ratios of C2-C6DCA range
from 3.8 (oxalic acid) to 2.0 (adipic acid), indicating that their contributions to the particle mass is larger than that cal-culated on the basis of carbon only. Another important role of organic acids relating to their contribution to the smoke aerosol mass is the formation of salts. Both organic acids and NH+4 were predominantly present in submicron size par-ticles and the ammonium was in excess of SO2−4 , and ni-trate. Using an updated version of the equilibrium simpli-fied aerosol model (EQSAM), which incorporates mineral aerosol species and lumped LMW organic acids obtained in
this study, it was shown that carboxylic acids have to be taken into account (Trebs et al., 2005) in order to balance the fine mode aerosol inorganic ionic charges. When organic acids are present as ammonium salts, their contribution to the to-tal aerosol mass increases even more (e.g. OM/OC=5.2 for oxalic acid as (COONH4)2instead 3.8 for free oxalic acid).
5 Conclusions
Examining the link between aerosol chemical/physical prop-erties and aerosol hygroscopic and cloud-nucleating proper-ties, and modeling the effect of biomass burning aerosol on cloud microphysics at the cloud and regional level, has been one of the overall goals for the SMOCC field study. It is not a trivial task to model microphysical characteristics of smoke aerosols, due to their complex chemical composition. Such modeling requires size distribution data of aerosol chemical composition. To the best of our knowledge, this is the first study that reports size distributions of organic acids in smoke aerosols from this region.
The measurements presented in this paper provide a com-prehensive dataset for the chemical composition of the wa-ter soluble fraction in biomass burning particles in Brazil, and demonstrate how chemical composition changes with the transition from the burning season to clean conditions. While the chemical composition obtained from bulk measurements shows little differences between the three periods, the size re-solved data shows substantial differences in the distribution of species among the different size ranges as the aerosols age and are mixed with other aerosol types. The distributions also shed light on the different sources of species.
In this study low molecular weight polar organic acids were found to account for a significant fraction of the water soluble organic carbon (WSOC) in biomass burning aerosols – C2-C6 dicarboxylic acids accounted for up to 3.7% and
one-ring aromatic acids accounted for up to 2% of fine frac-tion WSOC during burning period. These short dicarboxylic (C2-C6)acids are dominated by oxalic acid, followed by
mal-onic and succinic acids. The most abundant imal-onic species is ammonium sulfate, accounting for 60–70% of ionic mass. It was found that most of the ionic mass is concentrated in submicrometer-sized particles. Based on the size distribution and correlations with K+, a known biomass burning tracer, it is suggested that during the dry season many of the organic acids are directly emitted by vegetation fires. It is concluded that the dicarboxylic acids are mostly confined to the partic-ulate phase, and no evidence for semi-volatile behavior was observed.
Acknowledgements. This work is a contribution to the Large Scale Biosphere-Atmosphere Experiment in Amazonia (LBA). We are indebted to the European Commission, Contract EVK2-CT-2001-00110, the Belgian Federal Science Policy Office, the “Fonds voor Wetenschappelijk Onderzoek – Vlaanderen”, the FAPESP and CNPq, Brazil, for research support, and the Henri Gutwirth
Fund for Promotion of Research at the Weizmann Institute. We thank A. C. Ribeiro, A. L. Loureiro, T. Germano, G. Nishioka and J. Cafmeyer for collecting the samples at the field site and X. Chi (Ghent Univ., Belgium) for performing the OC and WSOC
measurements. The authors wish to thank S. Decesari (CNR,
Bologna, Italy) and M. Claeys (Univ. of Antwerp, Belgium) for fruitful discussions.
Edited by: U. Lohmann
References
Allen, A. G. and Miguel, A. H.: Biomass burning in the Amazon – Characterization of the ionic component of aerosols generated from flaming and smoldering rain-forest and savanna, Environ. Sci. Technol., 29(2), 486–493, 1995.
Andreae, M. O.: Soot carbon and excess fine potassium - Long-range transport of combustion-derived aerosols, Science, 220, 1148–1151, 1983.
Andreae, M. O. and Crutzen, P. J.: Atmospheric aerosols: con-stituent of airborne particles in atmospheric chemistry, Science, 276(5315), 1052–1058, 1997.
Andreae, M. O. and Merlet, P.: Emission of trace gases and aerosols from biomass burning, Glob. Biogeochem. Cycle, 15(4), 955– 966, 2001.
Andreae, M. O., Rosenfeld, D., Artaxo, P., Costa, A. A., Frank, G. P., Longo, K. M., and Silva-Dias, M. A. F.: Smoking rain clouds over the Amazon, Science, 303(5662), 1337–1342, 2004. Artaxo, P., Maenhaut, W., Storms, H., and Vangrieken, R.: Aerosol
characteristics and sources for the Amazon basin during the wet season, J. Geophys. Res. A., 95(D10), 16 971–16 985, 1990. Baboukas, E. D., Kanakidou, M., and Mihalopoulos, N.:
Car-boxylic acids in gas and particulate phase above the Atlantic Ocean, J. Geophys. Res., 105(D11), 14 459–14 471, 2000. Cachier, H., Liousse, C., Buat-Menard, P., and Gaudichet, A.:
Par-ticulate content of savanna fire emission, J. Atmos. Chem., 22, 123–148, 1995.
Charlson, R. J., Seinfeld, J. H., Nenes, A., Kulmala, M., Laakso-nen, A., and Facchini, M. C.: Atmospheric science – Reshaping the theory of cloud formation, Science, 292(5524), 2025–2026, 2001.
Chebbi, A. and Carlier, P.: Carboxylic acids in the troposphere, oc-currence, sources, and sinks: A review, Atmos. Environ., 30(24), 4233–4249, 1996.
Decesari, S., Facchini, M. C., Fuzzi, S., and Tagliavini, E.: Char-acterization of water-soluble organic compounds in atmospheric aerosol: A new approach, J. Geophys. Res., 105(D1), 1481– 1489, 2000.
Falkovich, A. H., Schkolnik, G., Ganor, E., and Rudich, Y.: Ad-sorption of organic compounds pertinent to urban environments onto mineral dust particles, J. Geophys. Res., 109(D2), D02208, doi:10.1029/2003JD003919, 2004.
Formenti, P., Elbert, W., Maenhaut, W., Haywood, J., Osborne, S., and Andreae, M. O.: Inorganic and carbonaceous aerosols during the Southern African Regional Science Initiative (SAFARI 2000) experiment: Chemical characteristics, physical properties, and emission data for smoke from African biomass burning, J. Geo-phys. Res., 108(D13), 8488, doi:10.1029/2002JD002408, 2003.


![[PDF] Formation Word perfectionnement | Télécharger PDF](data:image/gif;base64,R0lGODlhAQABAIAAAP///wAAACH5BAEAAAAALAAAAAABAAEAAAICRAEAOw==)