HAL Id: hal-02900383
https://hal.archives-ouvertes.fr/hal-02900383
Submitted on 24 Nov 2020HAL is a multi-disciplinary open access archive for the deposit and dissemination of sci-entific research documents, whether they are pub-lished or not. The documents may come from teaching and research institutions in France or abroad, or from public or private research centers.
L’archive ouverte pluridisciplinaire HAL, est destinée au dépôt et à la diffusion de documents scientifiques de niveau recherche, publiés ou non, émanant des établissements d’enseignement et de recherche français ou étrangers, des laboratoires publics ou privés.
Influence of preferred orientation of clay particles on the
diffusion of water in kaolinite porous media at constant
porosity
Thomas Dabat, Patrice Porion, Fabien Hubert, Erwan Paineau, Baptiste
Dazas, Brian Grégoire, Emmanuel Tertre, Alfred Delville, Eric Ferrage
To cite this version:
Thomas Dabat, Patrice Porion, Fabien Hubert, Erwan Paineau, Baptiste Dazas, et al.. Influence of preferred orientation of clay particles on the diffusion of water in kaolinite porous media at constant porosity. Applied Clay Science, Elsevier, 2020, 184, pp.105354. �10.1016/j.clay.2019.105354�. �hal-02900383�
Influence of preferred orientation of clay particles on the diffusion
1
of water in kaolinite porous media at constant porosity
2 3
Thomas Dabat1*, Patrice Porion2, Fabien Hubert1, Erwan Paineau3, Baptiste Dazas1, Brian
4
Grégoire1, Emmanuel Tertre1, Alfred Delville2, Eric Ferrage1*
5
6
1 IC2MP-Hydrasa, UMR 7285 CNRS, Université de Poitiers, 86022 Poitiers, France
7
2 ICMN, UMR 7374 CNRS, Université d’Orléans, 45071 Orléans, France
8
3 Laboratoire de Physique des Solides, UMR 8502 CNRS, Université Paris-Sud, bât. 510, 91405
9
Orsay, France
10 11 12
Corresponding authors: [email protected]; [email protected]
13 14 15
Abstract 16
Solute transport in natural or artificial compacted clay porous media is receiving particular
17
attention in the contexts of waste storage and the design of materials with tuneable physical
18
properties. In these contexts, the porosity is commonly considered as a primary parameter
19
controlling the diffusional properties of water and solutes in these systems. However, little
20
attention has been given to the role played by anisotropy in the particle orientation. In this study,
21
the influence of the preferred orientation of clay particles on the water diffusion anisotropy in
22
two kaolinite porous media obtained by compaction and centrifugation methods (for a constant
23
porosity value of ~0.5) was investigated by coupling experiments and simulations. An increase
24
in the preferred orientation of kaolinite particles, as quantified by X-ray scattering analysis, was
25
found to be logically associated with an enhanced anisotropy in water diffusion obtained from
26
pulsed gradient spin echo attenuation measurements by nuclear magnetic resonance of protons.
27
Brownian dynamics simulations performed on three-dimensional virtual porous media,
28
mimicking the shape and orientation of the particles in the samples, led to calculated water
29
diffusion coefficients in agreement with experimental data. Once validated, this computational
30
work was extended to a wide range of degrees in the preferred orientation of particles. The
31
results showed that this parameter leads to an increase and a decrease in pore water diffusion
32
coefficients along and across the mean orientation plane, respectively, up to a factor ~2. The
33
directional diffusion anisotropy was also found to range between 1 and ~5 for the most isotropic
34
and anisotropic organisations, respectively. This study hence provides quantitative insights into
35
the impact of the preferred orientation for the prediction of water diffusion in compacted clay
36
media.
37 38
Keywords: clay minerals; porous media; anisotropy; particle orientation; water diffusion
1. Introduction 40
The understanding of solute transport in compacted clay-based porous media has
41
considerable importance in the fields of nuclear waste storage in deep geological formations
42
(Altmann et al., 2012; Charlet et al., 2017) and the design of innovative materials with fluid
43
barrier efficiency (Aulin et al., 2012). For these systems, macroscopic transport models based
44
on the Fickian expression of the diffusion process of a non-sorbing tracer rely on its effective
45
diffusion coefficient 𝐷𝑒, defined by (Bourg et al., 2006; Tournassat and Steefel, 2015;
46 Tinnacher et al., 2016): 47 𝐷𝑒 = 𝜀 𝐺𝐷0 (1) 48
where 𝜀 is the porosity of the porous medium, 𝐷0 the diffusion coefficient of the tracer in
49
bulk liquid water, and 𝐺 the tortuosity factor related to the geometry of the pore network. The
50
diffusion coefficient of the tracer 𝐷 in the pores, related to this 𝐷𝑒 entity by 𝐷𝑒 = 𝜀. 𝐷, is thus
51 expressed as follows: 52 𝐷 = 1 𝐺𝐷0 (2) 53
In Eq. (2), all information regarding the geometry of the pore network, including the
54
distributions in the size, shape, orientation, and connectivity of the pores, is contained in the
55
entity 𝐺. Although different experimental methods such as microscopy techniques can be used
56
to access specific properties of the porous network (Keller et al., 2014; Gaboreau et al., 2016;
57
Leu et al., 2016; Backeberg et al., 2017; Takahashi and Tachi, 2019), the quantitative prediction
58
of the geometric factor 𝐺 value for a given porous medium remains a challenging task in the
59
field of macroscopic transport modelling.
60
Because of their lamellar shape, clay particles most often display a preferred orientation,
61
leading to anisotropy in the morphology of the pore network and having a considerable impact
62
on the transfer properties of water and solutes. For instance, experimental studies have
63
evidenced a significant variation in the measured water effective diffusion coefficients in the
direction parallel or perpendicular to the bedding of different natural argillaceous rocks (Van
65
Loon et al., 2004; García-Gutiérrez et al., 2006; Xiang et al., 2013; Gimmi et al., 2014; Jacops
66
et al., 2017). Furthermore it was also demonstrated that the increase in the diffusion anisotropy
67
was qualitatively linked to a more pronounced preferred orientation of clay particles in the
68
different samples (Wenk et al., 2008). Although the quantitative correlation between the water
69
diffusion and porosity parameter has been subjected to a large number of studies (Van Loon
70
and Mibus, 2015; Charlet et al., 2017 and references therein), little is known regarding the
71
quantitative impact of the degree of preferred orientation on the diffusional properties of water
72
and solutes. To obtain a complete understanding of this specific contribution, additional work
73
on samples of model clay porous media with controlled porosity and anisotropic properties in
74
the particle orientation is required.
75
In that context, the present study focuses on the water diffusion properties in two model
76
porous media prepared from KGa-2 kaolinite particles with similar porosity but different
77
particle orientations. The quantitative measurement of preferred orientation of the particles in
78
these samples will be performed using X-ray scattering (XRS) analysis. An experimental
79
analysis of the anisotropy in the water diffusion will be performed using pulsed gradient spin
80
echo attenuation measurements by nuclear magnetic resonance (PGSE-NMR) of protons.
81
Information regarding the particle size, shape and orientation will then be used to build 3D
82
virtual porous media, for which Brownian dynamics simulations will be performed to analyse
83
the water diffusional properties in the pore network. This computational methodology was
84
recently shown to be efficient in connecting the different time scales of the diffusional process
85
of water and solutes in compacted clay porous media (Tyagi et al., 2013; Bacle et al., 2016).
86
Once validated against experimental data, the computational methodology will be extended to
87
a wide range of degrees in preferential orientation of particles. The obtained results will
eventually help us to obtain quantitative insights into the role played by the preferential
89
orientation in the variation of the diffusional properties in these systems.
90
2. Materials and methods 91
2.1. Starting material
92
The kaolinite KGa-2 from the Source Clay Repository of the Clay Mineral Society was used
93
to prepare the different porous media. The average size of kaolinite particles is approximately
94
0.5 µm (Hassan et al., 2005) and their structural formula is
95
[(Al3.80Ti0.13Fe3+0.07) (Si3.84Al0.16) O5(OH4)] (Mermut and Cano, 2001). The original kaolinite
96
powder was Na-saturated using three saturation cycles in a 1 mol/L NaCl solution to obtain
97
homoionic samples. Dialysis in deionised water was then used to remove the excess salt until a
98
silver nitrate test for Cl- was negative. Finally, the kaolinite dispersion was dried in an oven at
99
60°C and then sieved through a 50 µm mesh to remove coarse aggregates.
100
2.2. Preparation of porous media with contrasted anisotropy
101
Two porous media made of kaolinite powder were prepared in order to obtain a similar
102
porosity value 𝜀 but contrasted anisotropy degrees in particle orientation. The first sample was
103
obtained by uniaxial compaction of the initial powder in a poly(tetrafluoroethylene) (PTFE)
104
cylinder with a diameter of 0.64 cm and a height of 7.5 cm. The kaolinite powder was
105
introduced in the tube, the tube placed in a metallic cell with a bottom cap to prevent widening,
106
and the powder then compressed to end up with a compacted kaolinite sample of 1 cm in height.
107
The second sample was obtained by a centrifugation process directly in the PTFE tube placed
108
in a poly(methyl methacrylate) (PMMA) cell to avoid deformation. To do so, the initial
109
kaolinite powder was first dispersed in water (50 g/L). A 1 mL aliquot of the obtained dispersion
110
was then introduced in the PTFE tube and centrifuged horizontally at approximately 18 000 g
111
(Centrifuge Avanti J 301 and rotor JS-24.38 from Beckman Coulter) for 10 min. After
112
centrifugation, the excess of water was removed before the addition of a new dispersion aliquot.
Ten steps were sufficient to obtain a sufficient amount of kaolinite material. Finally, the sample
114
was dried at 60°C and slightly compressed to a 1 cm height using the same protocol as for the
115
first sample.
116
The final bulk porosity 𝜀 of 0.45±0.02 for both samples was determined based on the weight
117
of the samples (488±1 mg in both cases), their height (measurement after compression: 1.0 to
118
1.1 cm), and the kaolinite grain density. This latter value was estimated at 2.62 g.cm-3 based on
119
the structural formula mentioned above and the crystal structure parameters defined by
120
Sakharov et al. (2016) for KGa-2 kaolinite. Both samples were realised twice following exactly
121
the same protocol. The first set of samples was used for quantifying the particle orientation
122
using XRS measurements after sample induration (see Section 2.3). The second batch of sample
123
was used for the PGSE-NMR attenuation measurements of protons to extract the self-diffusion
124
tensor of the water probes (see Section 2.4).
125
2.3. Sample induration and X-ray scattering measurements
126
Both dried porous media were indurated and sliced to perform XRS measurements in
127
transmission mode. For the induration, methyl methacrylate (MMA; C5H8O2) resin was chosen
128
because of its fluidity higher than that of water allowing it to quickly fill the porosity, its small
129
molecular volume compared to other organic molecules (19 nm3), and its dipole moment being
130
similar to that of water. The protocol used was based on the work of Sammaljärvi et al. (2012).
131
The first step consists of setting the sample under a primary vacuum in a hermetic cell for few
132
minutes. This step is necessary to fully dehydrate the sample, as water molecules can disturb
133
the polymerisation reaction of MMAwihtout impacting their orientation (Hubert et al., 2013).
134
In the second step, MMA mixed with benzoyl peroxide (BPO; added in a BPO/MMA ratio of
135
0.5 wt.% as a thermal initiator of the polymerisation) is introduced in PTFE tubes under vacuum
136
to facilitate the vaporisation of MMA and its condensation into the smallest pores to fill all the
137
porosity. For both preparation conditions (compacted and centrifuged samples), the saturation
of porosity by the resin was achieved after 3 days. The third step, consisting of the
139
polymerisation of the MMA into PMMA, was achieved by transferring the saturated sample
140
contained in the waterproof PTFE tube into a water bath at 55°C for 24 h.
141
142
Fig. 1. Experimental measurement of particle orientation within kaolinite porous media using X-ray 143
scattering technique with a 2D detector. (a) Sketches of the 500 µm-thick longitudinal and transverse 144
lamellas relative to the tube axis and extracted from indurated samples to characterise the particle 145
orientations. (b) Schematic representation of 2D-XRS measurements of lamellas in transmission mode. 146
The modulation of the hkl Bragg reflection intensity rings along the detector angle 𝜏 is used to probe the 147
particle orientation. (c) Spherical coordinates (𝜃,) defining the orientation of the normal (Oz’) of an 148
individual particle with respect to the laboratory frame (x,y,z). 149
After induration, the cylindrical porous media were extracted from the PTFE tubes and
150
sawed in both the longitudinal and transverse directions of the tube axis (Fig. 1a). These two
151
directions were chosen to investigate the particle orientation in the two main directions relative
152
to the compaction/centrifugation forces. The obtained slices were then polished into 500 µm
153
thickness lamellas using grinding paper (with a grain diameter of 5 µm). The XRS
154
measurements were performed at the Laboratoire de Physique des Solides (Orsay, France). A
155
copper rotating anode generator (RU H3R, Rigaku Corporation, Japan) equipped with a
156
multilayer W/Si mirror (Osmic) allows obtaining a monochromatic beam (CuKα = 1.5418 Å) of
157
600 x 600 µm² at the sample position. Two-dimensional (2D) X-ray scattering patterns were
158
collected on a MAR345 2D-detector (marXperts GmbH, Germany, 150 µm pixel size). The
sample-to-detector distance D was set to 250 mm with a sample-to-beam stop distance of 30
160
mm. This configuration allows us to obtain scattering vector moduli down to Qmin = 0.2 Å-1 (Q
161
= 4π/λ sin(𝜃𝐵), where λ is the incident wavelength and 2𝜃𝐵 is the scattering angle), i.e.,
d-162
spacings up to 31.5 Å (d = 2π/Q). Sample lamellas were mounted ona goniometer head and
163
aligned perpendicularly to the incident X-ray beam with a typical exposure time of 300 to 900
164
s per sample position (Fig. 1b). For the XRS analyses, the limited thickness of the lamellas (i.e.,
165
500 µm) is a compromise to optimise both the percentage of the transmitted beam and the
166
quantity of particles analysed over a 600 x 600 µm² surface.
167 168
2.4. 1H NMR Pulsed Gradient Spin Echo experiments 169
The PGSE-NMR analyses were performed at the ICMN laboratory (Orléans, France). The
170
dried kaolinite samples in their PTFE tubes (see Section 2.2) were first water-saturated by
171
adding successive small drops of deionised water followed by equilibration over 2-3 days. As
172
the samples were hydrated in unconstrained conditions, a limited decompaction occurred for
173
both samples, leading to values increasing from 0.45±0.02 to 0.50±0.02, a final value
174
confirmed by helium pycnometry (Porion et al., 2018).
175
The NMR measurements were performed using a Bruker DSX100 spectrometer with a static
176
field of 2.35 T, equipped with a saddle detection coil and a micro-imaging probe (Micro5
177
Bruker) with gradient coils able to generate magnetic field gradients in three perpendicular
178
directions. 1H PGSE-NMR attenuation measurements (Stejskal and Tanner, 1965; Cotts et al.,
179
1989; Callaghan, 1991) were used to determine the macroscopic water mobility along any
pre-180
selected direction within the sample.
182
Fig. 2. Schematic view of the pulse sequence used to perform Pulse Gradient Spin Echo (PGSE-NMR) 183
attenuation measurements. Details on the time delays, pulse durations and strengths of the magnetic 184
field gradients are given in the text. 185
Fig. 2 illustrates the pulse sequence used to perform the PGSE-NMR attenuation
186
measurements with which a wave vector 𝑞 may be associated (Callaghan, 1991) according to
187
the relationship 𝑞 = 𝛾 𝑔 𝛿 𝜋⁄ , where 𝑔 is the intensity of the applied field gradient (between
188
0 and 1.6 T/m), 2𝛿 its effective duration (1 ms) and 𝛾 the proton gyromagnetic ratio
189
(2.6752108 rad/s for 1H). With the fixed duration 𝛿 of the pulsed field gradient set equal to
190
500 µs, the maximum value of the probed wave vector reaches 6.8 104 m-1. As a consequence,
191
our diffusion measurements are macroscopic and result from averages over sample sizes larger
192
than 15 m with respect to the particle size (~0.5 µm). Under such macroscopic conditions
193
(Porion et al., 2003), the attenuation of the intensity of the NMR echo 𝐼(𝑞)/𝐼(0) evolves
194
according to a Gaussian relationship from which the components of the self-diffusion tensor
195
are easily extracted (Cotts et al., 1989; Callaghan, 1991):
196 𝐼(𝑞) 𝐼(0)= 𝑒𝑥𝑝[−4 𝜋 2 𝑞2 𝑒 𝑔 ⃗⃗⃗ 𝑇 𝐷 ⃡⃗⃗ 𝑒⃗⃗⃗ (Δ + 3𝜏 2𝑔 ⁄ − 𝛿 6⁄ )] (3) 197
where 𝑒⃗⃗⃗ is the direction of the applied field gradient and 𝐷𝑔 ⃡ the self-diffusion tensor. This
198
equation is usually simplified by replacing the tensorial contraction 𝑒⃗⃗⃗ 𝑔 𝑇
𝐷
⃡⃗⃗ 𝑒⃗⃗⃗ by the value of 𝑔
199
the self-diffusion coefficient 𝐷𝑔 along the selected 𝑒⃗⃗⃗ director. The diffusion time Δ (20 ms) 𝑔
200
and the delay 𝜏 (760 s) are also displayed in Fig. 2. The PGSE-NMR attenuation
measurements were performed at 292 K and the associated experimental bulk water
self-202
diffusion coefficient 𝐷0 was measured at 2.0±0.2.10-9 m2/s in these conditions.
203 204
2.5. Generation of 3D virtual kaolinite porous media and Brownian dynamics
205
2.5.1. Simulated porous media of kaolinite with contrasted anisotropy and controlled
206
porosity
207
The 3D virtual porous media (VPM) mimicking the organisation of kaolinite porous media
208
for different degrees of anisotropy in particle orientation were obtained using a one-by-one
209
deposition algorithm of elliptic disc-shaped particles (Ferrage et al., 2015, 2018). This type of
210
simulation was recently shown to be able to reproduce the organisation and porosity of
disc-211
shaped particle packings (Dabat et al., 2018). According to this algorithm, each particle with a
212
set of Euler angles (𝜑, 𝜃, 𝜓) following the ZXZ convention (Ferrage et al., 2015), is introduced
213
at the top of a square simulation box with periodic conditions along the x and y axes (z axis
214
pointing upward; Fig. 3a) and settles to provide the steepest descent of the barycentre altitude.
215
The settling process of the particle, either at the bottom of the box or onto an existing bed of
216
particles with fixed positions, is thus obtained through the repetition of individual movements
217
around one or several contact points with one (or several) particles. The movements allow the
218
particle to slide, swivel or rotate with a random amplitude ranging from zero to a maximum
219
value to provide the steepest descent of the particle altitude. The variable parameters for the
220
each simulation thus include a total number of particles (10 000), a width for the square
221
simulation box set at 15𝑑̃, with 𝑑̃ the mean particle diameter, a total number of movement
222
attempts (2400), an initial angle 𝜃𝑖𝑛𝑖 of the particle introduced in the box, and a set of maximum
223
amplitudes to swivel (𝐴𝑠𝑤𝑖𝑣𝑚𝑎𝑥), to rotate (𝐴 𝑟𝑜𝑡 𝑚𝑎𝑥 with here 𝐴 𝑟𝑜𝑡 𝑚𝑎𝑥 = 𝐴 𝑠𝑤𝑖𝑣 𝑚𝑎𝑥), and to slide (𝐴 𝑠𝑙𝑖𝑑𝑒 𝑚𝑎𝑥) 224
(Ferrage et al., 2015). For these simulations, the lognormal distribution in the geometric
225
dimensions (i.e., basal surface, particle diameter, ratio between thickness and diameter, and
ellipticity degree) of the individual elliptic particles was obtained from the work (Ferrage et al.,
227
2015) and based on the experimental morphological study of Reinholdt et al. (2013) for the
0.1-228
0.2 µm size fraction of vermiculite from Santa Olalla, Spain. This vermiculite sample was used
229
here as a proxy, because it displays particles having very similar average aspect ratios (i.e., ratio
230
between thickness and diameter of particles) to that of KGa-2 kaolinite (0.08 and 0.07 for
231
vermiculite and kaolinite, respectively; Hassan et al., 2005, Reinholdt et al., 2013).
232
The degree of anisotropy of particle orientation in the obtained packings was extracted by
233
calculating the average of the second-order Legendre polynomial on the angular distribution of
234
the particle orientations as follows:
235
〈𝑃2〉 = 〈𝑃2(𝑐𝑜𝑠𝜃)〉 = 〈3𝑐𝑜𝑠2𝜃 − 1〉/2 (4)
236
with 𝜃 the angle between the normal unit vector of the particle and the z axis of the simulation
237
box (Figs. 1c and 3a). This 〈𝑃2〉 order parameter takes the value of 0 for an isotropic organisation
238
and 1 when all particles are perfectly oriented in the bedding (all normal to particles aligned
239
with the z axis of the simulation box). The 〈𝑃2〉 order parameter was previously used for the
240
description of compacted clay porous media (Perdigon-Aller et al., 2005; Ferrage et al., 2015;
241
Dabat et al., 2018) but is also referred to as 𝐻, the Hermans parameter in polymer sciences
242
(Hermans and Platzek, 1939), or 𝑆, the nematic order parameter in colloid science (Chaikin and
243
Lubensky, 1995; Davidson et al., 1995). To cover a large range of anisotropy degrees, 12
244
particle packings with 〈𝑃2〉 values varying from 0.03 to 0.92 were generated according to
245
algorithm parameters reported in Table S1.
246
To allow investigating the dynamic behaviour of water tracers in these different VPM,
247
additional numerical treatments are necessary. The generation procedure of these VPM indeed
248
leads to different porosity values as a function of the 〈𝑃2〉 values (Ferrage et al., 2015; Dabat et
249
al., 2018) and does not allow obtaining periodic conditions in the z direction. These effects are
250
negative drawbacks for both Brownian dynamics calculations and comparisons with
experimental data on compacted/centrifuged kaolinite samples. To overcome these limitations,
252
a specific methodology was employed for the most isotropic VPM constituted by approximately
253
10 000 particles, as illustrated in Fig. 3. Each individual particle, originally defined by a set of
254
three parameters (thickness and major and minor axes), is first polygonised considering 12
in-255
plane vectors plus 2 vectors passing along the normal of the particle (Fig. 3b). A cubic
sub-256
volume containing ~2000 particles is then extracted (Fig. 3c). In order to allow the numerical
257
investigation of water tracer mobility over a large spatial domain, periodic conditions under the
258
form of minimum-image convention along the directors 𝑒⃗⃗⃗ , 𝑒𝑥 ⃗⃗⃗⃗ , and 𝑒𝑦 ⃗⃗⃗ are required for the newly 𝑧
259
obtained simulation box (Fig. 3d). For Brownian dynamics simulations this convention indeed
260
insures that a water tracer passing through one side of the box will re-appears on the opposite
261
side of the simulation box. However, it requires avoiding the case where a particle protruding
262
out of one side could overlap on the other side of the box. This is achieved by first detecting
263
particle overlapping after application of minimum-image convention along the directors 𝑒⃗⃗⃗ , 𝑒𝑥 ⃗⃗⃗⃗ , 𝑦
264
and 𝑒⃗⃗⃗ and its removal by reducing the length of the different vectors defining the geometry of 𝑧
265
the two overlapping particles. The two following numerical treatments consist of reducing the
266
porosity of the VPM in order to reach an value close to that of the water-saturated kaolinite
267
samples analysed by PGSE-NMR, i.e., = 0.50 (see Section 2.4). First, each particle is allowed
268
to grow along one of its 14 vectors, chosen randomly. The amplitude of the increase in the
269
vector length is also chosen randomly between zero and a maximum value set at 10% of the
270
initial vector length. In the case where the modification of the particle geometry induces an
271
overlapping with another particle of the packing, the attempt is rejected. This first procedure
272
allows increasing the volume of solid in the packing and thus decreasing the porosity until all
273
particles become geometrically constrained by the other particles from the stack (Fig. 3e).
274
Second, if the porosity obtained still remains higher than the target value, new solid volume is
275
added by injecting a new particle into the stacking on the surface of an existing one and letting
the particle grow along its 14 vectors (Fig. 3f). The newly injected particles satisfy the
277
distribution of the geometric dimensions but only the addition of the smallest ones is likely to
278
be accepted during such a procedure. Depending on the initial porosity of the original VPM,
279
the procedure is stopped during either the first or the second treatment, i.e., when the VPM
280
reaches the porosity of 𝜀=0.50. Note that if the porosity is the same for all VPM, these two
281
processes lead to a modification in the particle sizes and thus a change in the overall specific
282
surface areas (SSAs). For instance, an increase in the volume of the individual particles leads
283
to a decrease in the SSA values, whereas the injection of new particles, most often small in size,
284
in order to fill the remaining porosity leads to an increase in the SSA values. Accordingly, the
285
final step of the VPM generation procedure thus consists of applying a dilatation or contraction
286
of the overall packing (and thus particle) dimensions (Fig. 3e). This leads to VPM with cubic
287
lengths of ~4 µm (i.e., between 4.3 and 3.9 between 〈𝑃2〉=0.03 and 0.92, respectively) and SSA
288
values of ~20 m2/g (similar to the experimental SSA value for KGa-2 kaolinite; Hassan et al.,
289
2005).
290
2.5.2. Brownian dynamics of water in virtual porous media
291
Brownian dynamics (BD) simulations represent a convenient way to investigate water
292
diffusion at the representative time scale of the micrometre-sized porous media (typically
293
several ms). In the framework of the general Langevin equation, the displacement of the
294
molecular probes can be defined by (Gunsteren et al., 1981; Tertre et al., 2015; Porion et al.,
295 2018): 296 𝑚𝑖𝑑𝑣⃗ 𝑖(𝑡) 𝑑𝑡 = −𝑚𝑖𝛾𝑖𝑣 𝑖(𝑡) + 𝐹 𝑖(𝑥(𝑡), 𝑡) + 𝑅⃗ 𝑖(𝑡) (5) 297
where 𝑣 𝑖, 𝑚𝑖 and 𝛾𝑖 are the velocity, molecular mass and frictional coefficient of probe 𝑖,
298
respectively, 𝐹 𝑖(𝑥(𝑡), 𝑡) is a systematic force acting on the probes and depending on their
299
positions and 𝑅⃗ 𝑖(𝑡) is a random force resulting from thermal collisions within the liquid.
300
Different algorithms can be used to solve the set of Eq. (5), mainly depending on the ratio
between the friction coefficient and the time step (𝛿𝑡) used in the simulation. In the case where
302
the time step is much larger than the velocity correlation time (i.e., 𝛾𝑖𝛿𝑡 ≫ 1) and considering
303
the probe displacements to be completely independent, the solution of Eq. (5) becomes
304
(Gunsteren et al., 1981):
305
𝑥 𝑖(𝑡 + 𝛿𝑡) = 𝑥 𝑖(𝑡) + 𝑅⃗ 𝑖 (6)
306
with the random force 𝑅⃗ 𝑖 now satisfying a Gaussian distribution function with a zero mean
307
and standard deviation given by the following:
308
〈𝑅𝑖2〉 = 2𝐷𝑖𝛿𝑡 (7)
309
where 𝐷𝑖 is the molecular self-diffusion of the probe 𝑖. For diffusion within isotropic media,
310
the modulus of the random 3D displacements is quantified by the self-diffusion propagator, i.e.,
311
the density of the probability of the displacement distribution law (Callaghan, 1991; Bacle et
312 al., 2016): 313 𝑃(𝑟 , ∆ | 𝑟 0 ,0) = {4𝜋𝐷∆}−3 2⁄ 𝑒𝑥𝑝 [−(𝑟 −𝑟 0)2 4𝐷∆ ] (8) 314
where ∆ is the diffusion time (see Eq. (3)). The self-diffusion propagator quantifying the
315
mobility along any single director is then defined by the following:
316
𝑃𝛼(𝑟⃗⃗⃗ , ∆ | 𝑟𝛼 ⃗⃗⃗ 𝛼0, 0) = {4𝜋𝐷𝛼∆}−1 2⁄ 𝑒𝑥𝑝 [−(𝑟⃗⃗⃗⃗ −𝑟𝛼 ⃗⃗⃗⃗ 𝛼0) 2
4𝐷𝛼∆ ] (9)
317
where D is the component of the self-diffusion tensor describing the mobility of the probe
318
along the selected 𝑒⃗⃗⃗⃗ director (Callaghan, 1991). Its spatial Fourier transform is also Gaussian 𝛼
319
and describes the probe displacement in the reciprocal q-space:
320 𝐸𝛼 (𝑞, Δ ) = exp [−2 𝜋2 𝑞2 〈(𝑟⃗⃗⃗ − 𝑟𝛼 ⃗⃗⃗ 𝛼0) 2 〉] = exp[−4 𝜋2 𝑞2 𝐷 𝛼 Δ] (10) 321
where is the diffusion time and 〈(𝑟⃗⃗⃗ − 𝑟𝛼 ⃗⃗⃗ 𝛼0) 2
〉 the mean-squared displacement along the
322
𝑒𝛼
⃗⃗⃗⃗ director (Callaghan, 1991; Porion et al., 2001, 2003). In the scope of comparing simulations
323
and experiments, as done in the present study, it should be pointed of that this Fourier transform
of the self-diffusion propagator derived from BD simulations corresponds to the entity directly
325
probed by PGSE-NMR measurements (see Section 2.4). Moreover it also corresponds exactly
326
to the intermediate scattering function (𝐹𝑞(𝑡)) commonly probed, on a much shorter time-scale,
327
by quasi-elastic neutron-scattering measurements (Hansen and McDonald, 1990).
328
For the BD simulations performed here at 300 K, 𝑁 = 2500 water probes with the molecular
329
self-diffusion 𝐷0 set at 2.3.10-9 m2/s were first introduced randomly into the porosity of the
330
VPM. A time step 𝛿𝑡 = 5 ns was considered, and additional tests showed that smaller values did
331
not provide any difference in the simulation results. An overall simulation time of 4 ms was
332
used to extract the pore water diffusion coefficients 𝐷𝛼 along a selected 𝑒⃗⃗⃗⃗ director based on 𝛼
333
the asymptotic slope of the radial mean squared displacement as follows:
334
𝐷𝛼 = limΔ→∞
∑𝑁𝑖=1(𝑥𝑖,𝛼(0)−𝑥𝑖,𝛼(𝛥))2
2NΔ (11)
335
where 𝛼 refers to the single direction 𝑒⃗⃗⃗⃗ on which the mobility is extracted (the uncertainty 𝛼
336
on the calculated 𝐷𝛼 values is estimated at 10%). During the BD simulations, the collision with
337
the surface of the kaolinite was treated as a Maxwell’s 𝐴 wall with the angular probability
338
𝑓𝐴(𝜃,) of water probes rebounding from the surface given by:
339
𝑓𝐴(𝜃,)𝑑𝛺 = cos 𝜃 𝑑𝛺/𝜋 (12)
340
where 𝜃 and are the usual polar and azimuthal angles (with respect to the normal of the
341
surface of the particle) and 𝑑𝛺 is the element of the solid angle. This condition mimics the fate
342
of a molecule, which is supposed to reside at the interface of the wall and eventually leave the
343
wall to return to the fluid (Valleau et al., 1991).
345
Fig. 3. Generation of virtual porous media with the same porosity but different anisotropy degrees in 346
particle orientation. (a) Cubic 3D virtual porous medium composed of ~10 000 particles with an almost 347
isotropic organisation (〈𝑃2〉 = 0.04) and generated using a sequential deposition algorithm (Ferrage et
348
al., 2015, 2018). (b) Meshing and polygonalisation of individual particles. (c) Extraction of a cubic sub-349
volume with ~2000 particles. (d) Application of periodic boundary conditions along 𝑒⃗⃗⃗⃗ , 𝑒𝑥 ⃗⃗⃗⃗ , and 𝑒𝑦 ⃗⃗⃗ 𝑧
350
directors of the simulation box and elimination of particle overlapping. (e) Decrease of porosity by 351
particle growth along the 14 individual axes (12 and 2 axes on the basal surface and along the normal 352
of the particle, respectively). (f) Decrease of porosity by injection of new particles and subsequent 353
growth along their 14 individual axes. (g) Contraction or dilation of the overall 3D cubic porous media 354
in order to keep the total specific surface area similar for all samples (VPM obtained for 〈𝑃2〉 = 0.58 and
355
0.92 are also shown here for illustration). 356
3. Results and Discussion 357
3.1 Preferred orientation analysis of kaolinite particles
358
Preferred orientation of the particles in both the compacted and centrifuged samples is based
359
on the orientation distribution function (ODF) determined from 2D-XRS measurements (see
360
Section 2.3). The orientation of a cylindrical particle can be described in an orthogonal
361
laboratory framework by the direction of its normal Oz' through the spherical coordinates θ and
362
φ (Fig. 1c). In addition, clay porous media are transverse isotropic systems with their z-axis as
363
the unique symmetry axis (Cebula et al., 1979; Perdigon-Aller et al., 2005; Wenk et al., 2010;
364
Hubert et al., 2013), leading to an equal probability of the particle orientation over the angles.
365
Accordingly, the ODF only depends on the angle 𝜃, with the following general constraints:
366 𝑓(𝜃) ≥ 0 (13) 367 𝑓(𝜃) = 𝑓(𝜋 − 𝜃) (14) 368 ∫ 𝑓(𝜃) sin(𝜃) 𝑑𝜃 = 10𝜋 (15) 369
Eqs. (13) and (14) indicate that the ODF 𝑓(𝜃) is positive and has an equal probability of the
370
particles pointing upward and downward, respectively. Eq. (15) allows normalising the total
371
number of particles in the system through the integration over all angles (Labarthet et al.,
372
2000). The experimental ODF can be extracted from the angular modulation of the scattered
373
intensity of the 001 reflection of kaolinite along the detector angle of the 2D-XRS patterns
374
(Fig. 1b). Given the low values for the Bragg angle for the 001 reflection of kaolinite, the 𝜏 = 𝜃
approximation can indeed be considered, and the 𝑓(𝜃) ODF is thus directly extracted from the
376
scattered intensity 𝐼(𝜃) evolution:
377
𝑓(𝜃) = 𝐼(𝜃)
∫ 𝐼(𝜃) sin(𝜃)𝑑𝜃0𝜋 (16)
378
379
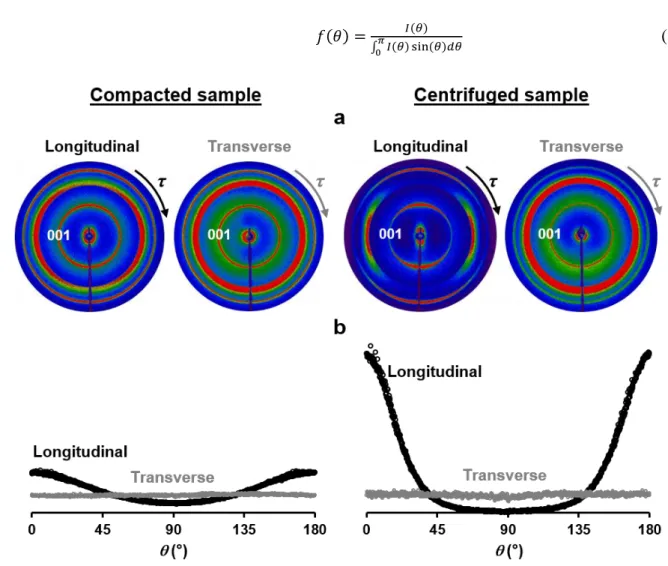
Fig. 4. Extraction of orientation distribution functions of kaolinite particles from 2D X-ray scattering 380
measurements. (a) Experimental 2D-XRS patterns recorded from the compacted and the centrifuged 381
samples in both the longitudinal and transverse directions of the tube axis. The colour scale ranges from 382
dark blue for the smallest intensity values to red for the largest ones. (b) Corresponding orientation 383
distribution functions from the angular scan of the 001 reflection of kaolinite over 180° (normalised 384
intensity according to Eq. (15), resulting in the same intensity for isotropic ODF). 385
The experimental 2D-XRS patterns for both the compacted and centrifuged samples on
386
lamellas extracted in the longitudinal and transverse directions with respect to the tube axis are
387
reported in Fig. 4 with their corresponding ODF. As seen for both samples, the 𝑓(𝜃) functions
388
recorded for the lamellas extracted in the longitudinal direction display symmetric profiles,
indicating that the lamellas were sliced perpendicularly to the preferred orientation plane and
390
well aligned on the XRS setup. For lamellas corresponding to the transverse direction of the
391
tube axis, the obtained ODF displays a constant intensity whatever the azimuthal angle, in
392
agreement with the isotropic transverse nature of the sample and the correct methodology of
393
the sample preparation and analysis. Based on the shape of the 𝑓(𝜃) functions for lamellas
394
sliced in the longitudinal direction of the tube axis, the degree of preferred orientation can be
395
obtained for both samples by calculating the average value of the second-order Legendre
396
polynomial on the angular distribution as:
397
〈𝑃2〉 = ∫ 𝑃2(𝑐𝑜𝑠𝜃). 𝑓(𝜃) sin(𝜃) 𝑑𝜃 𝜋
0 (17)
398
As seen from the different shapes of the 𝑓(𝜃) functions (Fig. 4b), the two samples
399
display very different order parameters, with 〈𝑃2〉 values of 0.21±0.02 and 0.59±0.05 for the
400
compacted and centrifuged samples, respectively (Table 1). It is worth noting that the obtained
401
〈𝑃2〉 values are averages over several measurements for each sample. Although it can be
402
expected that the successive centrifugation steps lead to a more heterogeneous sample
403
organization, such a difference was not evident given the about 10% uncertainty of the structure
404
parameter in both cases (Table 1).The different organisations for the two samples can likely be
405
attributed to the preparation method for two reasons. First, the uniaxial compaction in air-dried
406
conditions has been shown to provide rather poor preferred orientations for montmorillonite
407
particles (Lutterotti et al., 2010; Suuronen et al., 2014). Second, it is well accepted that the
408
dispersion of particle aggregates as individual clay platelets in water followed by sedimentation
409
promotes the preferred orientation, and a wide range of 〈𝑃2〉 values could be achieved,
410
depending on the particle size, solid-solution ratio, and hydrostatic or shear forces applied on
411
the sample (0.10 〈𝑃2〉 0.85; Perdigon-Aller et al., 2005; Méheust et al., 2006; Perdigón et
412
al., 2007; Hubert et al., 2013; Ferrage et al., 2015; Carrier et al., 2016).
413 414
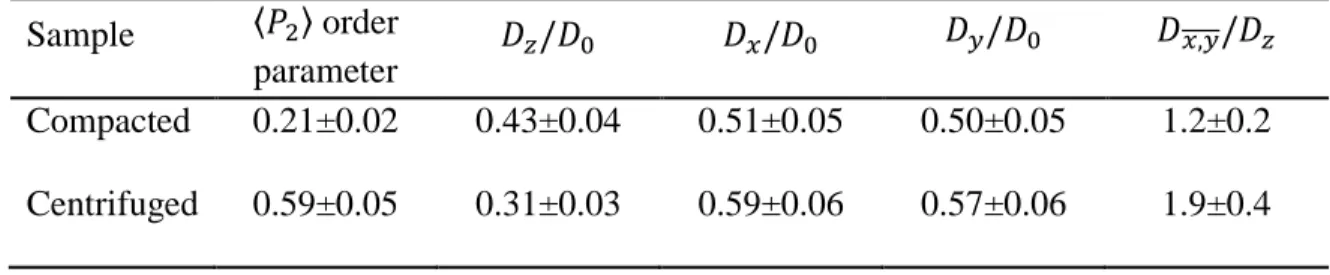
Table 1. Experimental measurements of the anisotropy degree of particle orientation (order parameter 415
〈𝑃2〉) determined from XRS analyses and associated pore water diffusion coefficients 𝐷𝛼obtained from
416
PGSE-NMR experiments on compacted and centrifuged samples (porosity 𝜀=0.50±0.02). The director 417
𝑒𝑧
⃗⃗⃗ is longitudinal whereas the directors 𝑒⃗⃗⃗⃗ and 𝑒𝑥 ⃗⃗⃗⃗ are transverse to the tube axis. 𝑦
418 Sample 〈𝑃2〉 order parameter 𝐷𝑧/𝐷0 𝐷𝑥/𝐷0 𝐷𝑦/𝐷0 𝐷𝑥,𝑦/𝐷𝑧 Compacted 0.21±0.02 0.43±0.04 0.51±0.05 0.50±0.05 1.2±0.2 Centrifuged 0.59±0.05 0.31±0.03 0.59±0.06 0.57±0.06 1.9±0.4 419
3.2 Experimental analysis of water diffusion in kaolinite porous media
420
The contrasted organisations in the kaolinite particles (i.e., 〈𝑃2〉 = 0.21±0.02 and 0.59±0.05
421
for the compacted and centrifuged samples, respectively) for a similar porosity (ε = 0.50±0.02
422
in wet conditions; see Section 2.4) indicate that the two samples are well adapted to investigate
423
in detail the impact of the preferred orientation on the anisotropy of the water diffusion. As
424
illustrated in Fig. 5 for the centrifuged sample, the pulsed gradients are applied along six
non-425
collinear directions (Basser et al., 1994; Skare et al., 2000) noted 𝑒⃗⃗⃗ = 𝑒1 ⃗⃗⃗ = (1,0,0), 𝑒𝑥 ⃗⃗⃗ = 𝑒2 ⃗⃗⃗⃗ =𝑦
426
(0,1,0), 𝑒⃗⃗⃗ = 𝑒3 ⃗⃗⃗ = (0,0,1), 𝑒𝑧 ⃗⃗⃗ = (1,1,0), 𝑒4 ⃗⃗⃗ = (0,1,1) and 𝑒5 ⃗⃗⃗ = (1,0,1), respectively, 6
427
with the direction 𝑒⃗⃗⃗ being parallel to the compaction/centrifugation axis of the sample. From 3
428
the six corresponding components of the water self-diffusion tensor, one can easily extract its
429
three principal axes and the corresponding eigenvalues describing the water mobility in the
430
longitudinal or transverse direction of the tube axis (Fig. 1a).
432
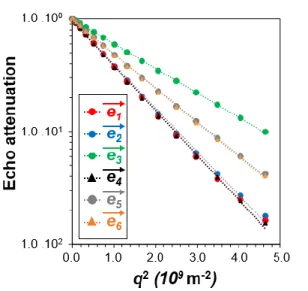
Fig. 5. Illustration of water self-diffusion propagators obtained for the centrifuged sample from PGSE-433
NMR experiments. More details on the selected diffusion directors 𝑒⃗⃗⃗⃗ are given in the text, leading to 𝛼
434
the components 𝐷𝛼 of the self-diffusion tensor: 𝐷1=𝐷𝑥=1.14210-9 m2/s, 𝐷2=𝐷𝑦=1.16510-9 m2/s,
435
𝐷3=𝐷𝑧=0.61410-9 m2/s, 𝐷
4=1.17310-9 m2/s, 𝐷5=0.86910-9 m2/s and 𝐷6=0.87910-9 m2/s.
436
As detailed in Table 1, the compacted sample exhibits a small anisotropy of the water
437
self-diffusion tensor, which is consistent with the measured low values for the order parameter
438
〈𝑃2〉. Moreover, the pore water diffusion coefficient obtained for this sample along the z
439
direction is consistent with a previous analysis from magnetic resonance imaging of the time
440
evolution of the water concentration profiles during D2O/H2O exchange (Porion et al., 2018).
441
In contrast, the sample obtained by the centrifugation method shows a larger anisotropy ratio
442
𝐷𝑥,𝑦/𝐷𝑧 of the water diffusion tensor, in agreement with the increase of the 〈𝑃2〉 order parameter
443
value for this sample. The water self-diffusion tensor can be better illustrated for these two
444
samples by plotting the variation of the water mobility within two orthogonal planes (i.e., either
445
parallel or perpendicular to the preferred orientation plane). The gradual variation of the pore
446
water diffusion coefficients between the two principal axes of the diffusion tensor (i.e., 𝑒⃗⃗⃗⃗ and ⊥
447
𝑒∥
⃗⃗⃗ , directions perpendicular or parallel to the preferred orientation plane, respectively) can
448
indeed be described by (Porion et al., 2003):
449
𝐷𝑚𝑒𝑎𝑠(𝛾) = 𝑒⃗⃗⃗ 𝑔 𝑇
𝐷 ⃡⃗⃗ 𝑒⃗⃗⃗ = 𝐷𝑔 ⊥cos2(𝛾) + 𝐷∥sin2(𝛾) (18)
where 𝛾 is the angle between 𝑒⃗⃗⃗⃗ and 𝑒⊥ ⃗⃗⃗ . 𝐷𝑔 𝛼 and 𝐷∥ are the two eigenvalues of the
451
diffusion tensor along the principal directions 𝑒⃗⃗⃗⃗ and 𝑒⊥ ⃗⃗⃗ . The diffusion tensor is illustrated in ∥
452
Fig. 6 for both the compacted and centrifuged samples. Calculations are performed either
453
parallel or perpendicular to the preferred orientation plane based on the (x,z) or (x,y) planes,
454
respectively.
455
The enhanced experimental anisotropy in the water mobility on the (x,z) plane for the
456
centrifuged sample compared to the compacted sample well illustrates the role played by the
457
preferred orientation of the kaolinite particles on the water mobility for a given 𝜀 value. In that
458
regard, and compared to other diffusion experiment setups, the great advantage of the
PGSE-459
NMR attenuation measurements is to provide a direct measurement of the water diffusion tensor
460
in the sample. Such experimental data thus represent key constraints for assessing the
461
representativeness of virtual porous media through a detailed comparison between the
462
experimental and simulated water mobility dependences on the particle orientation.
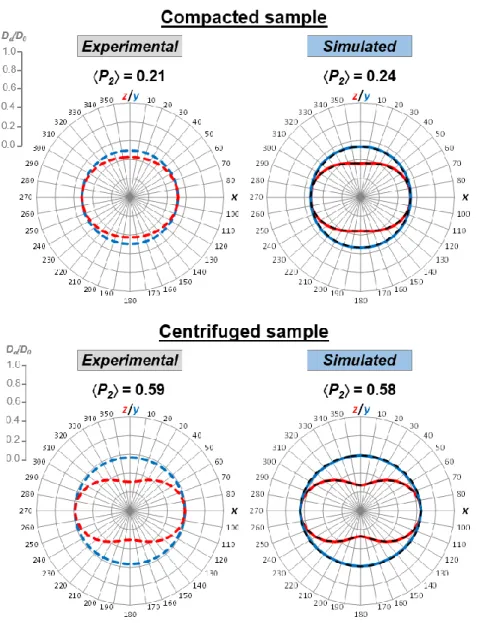
464
Fig. 6. Water diffusion tensors determined from PGSE-NMR experiments (left) and Brownian dynamics 465
simulations (right). The variations of the water mobility 𝐷𝛼/𝐷0 in the (x,y) plane and (x,z) plane are
466
shown in blue and red, respectively. For the experimental data, the diffusion tensor is calculated from 467
its eigenvalues 𝐷𝑥, 𝐷𝑦, and 𝐷𝑧 according to Eq. (18). For the simulated data, the solid lines correspond
468
to the limiting time evolution of the mean square displacements (see Eq. (11)), whereas the dotted lines 469
represent the calculation of the diffusion tensor from its eigenvalues using Eq. (18). 470
3.3 Brownian dynamics of water diffusion in 3D virtual porous media
471
The pore diffusion coefficients in the 12 virtual porous media (with 0.04 〈𝑃2〉 0.92)
472
are calculated along the 3 directors of the 3D virtual porous media reference framework (i.e., x,
473
y, and z; Fig. 7) based on the mean square displacement (MSD) of the water probes according
to Eq. (11). Additional calculations were performed every 10° in the (x,y) and (x,z) planes of
475
the diffusion tensor.
476
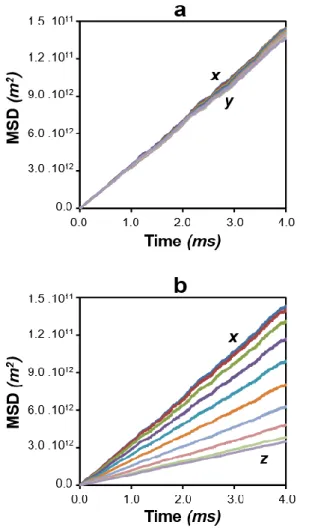
477
Fig. 7. Illustration of the time evolution of the mean square displacements (MSD) of the water probe 478
obtained by Brownian dynamics simulations for the virtual porous media with 〈𝑃2〉 = 0.92.
479
Displacements are extracted along the 3 directors of the 3D virtual porous media reference framework 480
(i.e., x, y, and z) as well as every 10° in the (a) (x,y) plane and (b) (x,z) plane. 481
As illustrated in Fig. 7 for the VPM obtained for 〈𝑃2〉 = 0.92, the asymptotic time
482
evolution behaviour of the MSD is rapidly obtained. The different MSD curves extracted in the
483
(x,y) plane of the diffusion tensor are very similar (Fig. 7a). This feature confirms the transverse
484
isotropy of the VPM, in agreement with the experimental data (see Section 3.1). Moreover, this
485
lack of angular dependence of the calculated 𝐷𝛼 values likely evidence that the VPM contain
sufficient numbers of particles and thus can be considered as representative elementary volumes
487
for the analysis of the dynamical behaviour of diffusive species. The situation differs when
488
analysing the MSD curves in the (x,z) plane of the diffusion tensor (Fig. 7b). The 𝐷𝛼 values are
489
indeed significantly lower in the z direction compared with the ones in the x direction, with
490
intermediate values of 𝐷𝛼 for in-between directions. This observation is consistent with the
491
plane (x,y) as the preferred orientation plane.
492
The pore water diffusion coefficients 𝐷𝛼 derived from these different MSD curves are
493
used to draw the water diffusion tensor in Fig. 6 for the two VPM having the closest 〈𝑃2〉 values
494
to the experimental ones, i.e., 〈𝑃2〉 = 0.24 and 0.58. The overall 𝐷𝛼 values are found to be in
495
fair agreement when comparing the experimental and calculated water diffusion tensors. For
496
the compacted sample, the simulated tensor displays a slightly more anisotropic pattern, likely
497
due to the increased 〈𝑃2〉 value (〈𝑃2〉 = 0.24 and 0.21 for simulated and experimental media,
498
respectively). In Fig. 6, the obtained simulated water diffusion tensor (solid line) is also
499
compared to the tensor (black dotted line) only based on the extracted 𝐷𝑥, 𝐷𝑦, and 𝐷𝑧 values
500
from BD simulations and considering the angular dependence given by Eq. (18). The good
501
consistency between the simulated and recalculated water diffusion tensors provides additional
502
evidence of the good representativeness of the VPM as well as the correct consideration of the
503
simulated 𝑒⃗⃗⃗ , 𝑒𝑥 ⃗⃗⃗⃗ , and 𝑒𝑦 ⃗⃗⃗ directors of the simulation box as eigenvalues of the diffusion tensor. 𝑧
504
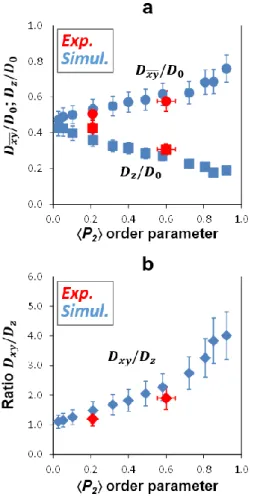
The obtained VPM coupled to BD simulations can be used to further assess the influence of the
505
preferred orientation of particles on the diffusional properties of water. In Fig. 8a, the obtained
506
simulated 𝐷𝛼/𝐷0 values extracted from the MSD curves are plotted in the 0.04-0.92 〈𝑃2〉 range,
507
whereas the anisotropy ratio 𝐷𝑥,𝑦/𝐷𝑧 of the water diffusion tensor is reported in Fig. 8b. Again,
508
good agreement between the experimental and calculated diffusion coefficients is obtained for
509
both samples. The 𝐷𝑥,𝑦/𝐷0 and 𝐷𝑧/𝐷0 values show steady increasing and decreasing
510
behaviours, respectively, when increasing the degree of preferred orientation (Fig. 8a). For both
directions, a factor ~2 is obtained for 𝐺 values between the more isotropic to more anisotropic
512
systems. This amplitude observed for 𝜀=0.5±0.02 is in agreement with the computational results
513
obtained by (Tyagi et al., 2013) using random walk simulations on 2D microstructure maps.
514
Such variation well illustrates the great importance of the preferred orientation on the
515
diffusional properties of water. In the case of transport modelling, according to Eq. (1), the
516
modification of the 𝐷𝛼/𝐷0 values through the investigated 〈𝑃2〉 range has indeed the same
517
impact on the 𝐷𝑒 value as a change in the porosity value by a factor of 2.
518
519
Fig. 8. Influence of particle preferred orientation on the water diffusion properties. (a) Evolution as a 520
function of the order parameter 〈𝑃2〉 of the mean water diffusion coefficients in the (x,y) plane 𝐷𝑥,𝑦
521
(circles) or along the z direction 𝐷𝑧 (squares), calculated from Brownian dynamics simulations (blue) or
522
obtained experimentally by PGSE-NMR attenuation measurements (red). (b) Evolution of experimental 523
(red) and calculated (blue) 𝐷𝑥,𝑦/𝐷𝑧 ratios with preferred orientation of particles.
The anisotropy ratio 𝐷𝑥,𝑦/𝐷𝑧 of the water diffusion tensor displays an
exponential-525
shaped evolution with the 〈𝑃2〉 value (Fig. 8b). The observed variation of the 𝐷𝑥,𝑦/𝐷𝑧 values
526
between 1 and 5 is consistent with the reported experimental diffusivity anisotropies for water
527
tracers in compacted clay-rich porous media, for pure clay-based materials (e.g., bentonite; Sato
528
and Suzuki, 2003; Suzuki et al., 2004), or for more complex polymineralic argillaceous rocks
529
(Van Loon et al., 2004; García-Gutiérrez et al., 2006; Xiang et al., 2013; Gimmi et al., 2014;
530
Jacops et al., 2017). For these latter, the presence of elongated non-clay grains can provide
531
additional contribution to the overall anisotropy in the water diffusion tensor (Robinet et al.,
532
2012).
533
4. Summary and conclusions 534
The results described in the present study further confirm the significant role played by the
535
preferred orientation of the particles on the diffusional properties of water in compacted porous
536
media made of clay minerals. The originality of this work is provided by a close connection
537
between experiments and simulations on representative virtual porous media, allowing
538
quantitative agreement between the measured and calculated 𝐷𝛼/𝐷0 values. It is worth pointing
539
out that such an agreement conceals significant differences in the probed spatial and dynamical
540
domains between the experiments (~5 mm; 20 ms) and simulations (~4 µm; 4 ms).
541
Accordingly, the spatial heterogeneity in the porosity and anisotropy within the samples at
542
higher length scales are not accounted for in the computed VPM used here, or are just averaged
543
in such a limited volume. Moreover, the flexibility of the clay particles (Honorio et al., 2018)
544
and the interfacial molecular forces on the dynamics of the water molecules are not considered
545
in the present study in these mesoscopic simulations. Despite these limitations and in line with
546
previous computational studies (Tyagi et al., 2013; Bacle et al., 2016), the simulated VPM can
547
be considered good toy models for estimating the underlying parameters of the pore network
548
controlling the geometric parameter 𝐺 (i.e., distribution in size, shape, orientation, and
connectivity of pores). This estimation is achieved in the present study based on the
550
computation of the shape and the mean orientation of the particles, two parameters that are
551
easily obtained experimentally. The validation of the computational methodology provides
552
quantitative information on the role played by the preferred orientation of the particles on the
553
𝐺 values, as a variation by a factor up to ~2 of 𝐷𝛼/𝐷0 for 𝜀=0.5±0.02 is observed when
554
increasing the anisotropy in the particle orientation. Because the order parameter 〈𝑃2〉 values
555
can significantly vary in compacted materials made from clay minerals (Perdigon-Aller et al.,
556
2005; Méheust et al., 2006; Perdigón et al., 2007; Lutterotti et al., 2010; Carrier et al., 2016),
557
this parameter undoubtedly deserves, as a porosity parameter, particular attention in the scope
558
of predicting the macroscopic transport properties in compacted clay media. A logical
559
continuation of this work could be, then, to expand the analysis of the influence of the preferred
560
orientation on the water diffusion for different 𝜀 values. Using the same strategy combining
561
experiments and simulations, another perspective could be to extend the analysis to other types
562
of clay minerals, in particular to swelling clay minerals, leading to the presence of different
563
type of porosities, and evaluating the overall diffusional properties of water.
564
Acknowledgements 565
The results presented are part of the Ph.D. thesis of T.D. granted by “Région
Nouvelle-566
Aquitaine”, University of Poitiers, France. Claude Veit (IC2MP, Poitiers, France) is thanked
567
for the design and conception of the compaction and centrifugation cells for the sample
568
preparation. Claude Laforest (IC2MP, Poitiers, France) and Stephan Rouzière (LPS, Saclay,
569
France) are also acknowledged for their technical assistance in the induration and polishing
570
steps of the sample preparation and in the XRS measurements, respectively. Dr. Pascale
571
Launois (LPS, Saclay, France) is thanked for constructive discussions about XRS
572
measurements. The authors are grateful to the CNRS interdisciplinary “défi Needs” through its
573
“MiPor” program (Project TRANSREAC) and the European Union (ERDF) and "Région
Nouvelle Aquitaine" for providing financial support for this study. Additional support from
575
Région Centre (France) is thanked for the funding of the DSX100 Bruker spectrometer used in
576
this study.The authors gratefully acknowledge the anonymous reviewers for their constructive
577
comments.
578
References 579
Altmann, S., Tournassat, C., Goutelard, F., Parneix, J.-C., Gimmi, T., Maes, N., 2012.
580
Diffusion-driven transport in clayrock formations. Appl. Geochem. 27, 463–478.
581
https://doi.org/10.1016/j.apgeochem.2011.09.015
582
Aulin, C., Salazar-Alvarez, G., Lindström, T., 2012. High strength, flexible and transparent
583
nanofibrillated cellulose–nanoclay biohybrid films with tunable oxygen and water vapor
584
permeability. Nanoscale 4, 6622–6628. https://doi.org/10.1039/C2NR31726E
585
Backeberg, N.R., Iacoviello, F., Rittner, M., Mitchell, T.M., Jones, A.P., Day, R., Wheeler, J.,
586
Shearing, P.R., Vermeesch, P., Striolo, A., 2017. Quantifying the anisotropy and
587
tortuosity of permeable pathways in clay-rich mudstones using models based on X-ray
588
tomography. Sci. Rep. 7, 14838. https://doi.org/10.1038/s41598-017-14810-1
589
Bacle, P., Dufrêche, J.-F., Rotenberg, B., Bourg, I.C., Marry, V., 2016. Modeling the transport
590
of water and ionic tracers in a micrometric clay sample. Appl. Clay Sci. 123, 18–28.
591
https://doi.org/10.1016/j.clay.2015.12.014
592
Basser, P.J., Mattiello, J., Lebihan, D., 1994. Estimation of the Effective Self-Diffusion Tensor
593
from the NMR Spin Echo. J. Magn. Reson. B 103, 247–254.
594
https://doi.org/10.1006/jmrb.1994.1037
595
Bourg, I.C., Sposito, G., Bourg, A., 2006. Tracer diffusion in compacted, water-saturated
596
bentonite. Clays Clay Miner. 54, 363–374.
597
Callaghan, P.T., 1991. Principles of nuclear magnetic resonance microscopy. Clarendon Press,
598
Oxford.
599
Carrier, B., Vandamme, M., Pellenq, R.J.-M., Bornert, M., Ferrage, E., Hubert, F., Van Damme,
600
H., 2016. Effect of water on elastic and creep properties of self-standing clay films.
601
Langmuir 32, 1370–1379.
602
Cebula, D., Thomas, R., Middleton, S., Ottewill, R., White, J., 1979. Neutron diffraction from
603
clay-water systems. Clays Clay Min. 27, 39.
604
Chaikin, P.M., Lubensky, T.C., 1995. Principles of condensed matter physics. Cambridge
605
University Press, Cambridge.
606
Charlet, L., Alt-Epping, P., Wersin, P., Gilbert, B., 2017. Diffusive transport and reaction in
607
clay rocks: A storage (nuclear waste, CO2, H2), energy (shale gas) and water quality
608
issue. Adv. Water Resour., Tribute to Professor Garrison Sposito: An Exceptional
609
Hydrologist and Geochemist 106, 39–59.
610
https://doi.org/10.1016/j.advwatres.2017.03.019
611
Cotts, R.M., Hoch, M.J.R., Sun, T., Markert, J.T., 1989. Pulsed field gradient stimulated echo
612
methods for improved NMR diffusion measurements in heterogeneous systems. J.
613
Magn. Reson. 1969 83, 252–266. https://doi.org/10.1016/0022-2364(89)90189-3
614
Dabat, T., Mazurier, A., Hubert, F., Tertre, E., Grégoire, B., Dazas, B., Ferrage, E., 2018.
615
Mesoscale Anisotropy in Porous Media Made of Clay Minerals. A Numerical Study
616
Constrained by Experimental Data. Materials 11, 1972.
Davidson, P., Petermann, D., Levelut, A.-M., 1995. The measurement of the nematic order
618
parameter by x-ray scattering reconsidered. J. Phys. II 5, 113–131.
619
https://doi.org/10.1051/jp2:1995117
620
Ferrage, E., Hubert, F., Baronnet, A., Grauby, O., Tertre, E., Delville, A., Bihannic, I., Prêt, D.,
621
Michot, L.J., Levitz, P., 2018. Influence of crystal structure defects on the small-angle
622
neutron scattering/diffraction patterns of clay-rich porous media. J. Appl. Crystallogr.
623
51.
624
Ferrage, E., Hubert, F., Tertre, E., Delville, A., Michot, L.J., Levitz, P., 2015. Modeling the
625
arrangement of particles in natural swelling-clay porous media using three-dimensional
626
packing of elliptic disks. Phys. Rev. E 91, 062210.
627
https://doi.org/10.1103/PhysRevE.91.062210
628
Gaboreau, S., Robinet, J.-C., Pret, D., 2016. Optimization of pore-network characterization of
629
a compacted clay material by TEM and FIB/SEM imaging. Microporous Mesoporous
630
Mater. 224, 116–128. https://doi.org/10.1016/j.micromeso.2015.11.035
631
García-Gutiérrez, M., Cormenzana, J.L., Missana, T., Mingarro, M., Martín, P.L., 2006.
Large-632
scale laboratory diffusion experiments in clay rocks. Phys. Chem. Earth Parts ABC,
633
MIGRATION 2005, The 10th international conference on the chemistry and migration
634
of actinides and fission products in the geosphere 31, 523–530.
635
https://doi.org/10.1016/j.pce.2006.04.004
636
Gimmi, T., Leupin, O.X., Eikenberg, J., Glaus, M.A., Van Loon, L.R., Waber, H.N., Wersin,
637
P., Wang, H.A.O., Grolimund, D., Borca, C.N., Dewonck, S., Wittebroodt, C., 2014.
638
Anisotropic diffusion at the field scale in a 4-year multi-tracer diffusion and retention
639
experiment – I: Insights from the experimental data. Geochim. Cosmochim. Acta 125,
640
373–393. https://doi.org/10.1016/j.gca.2013.10.014
641
Gunsteren, W.F. van, Berendsen, H.J.C., Rullmann, J.A.C., 1981. Stochastic dynamics for
642
molecules with constraints. Mol. Phys. 44, 69–95.
643
https://doi.org/10.1080/00268978100102291
644
Hansen, J.-P., McDonald, I.R., 1990. Theory of Simple Liquids. Elsevier.
645
Hassan, M.S., Villieras, F., Gaboriaud, F., Razafitianamaharavo, A., 2005. AFM and
low-646
pressure argon adsorption analysis of geometrical properties of phyllosilicates. J.
647
Colloid Interface Sci. 296, 614–623. https://doi.org/10.1016/j.jcis.2005.09.028
648
Hermans, P.H., Platzek, P., 1939. Beiträge zur Kenntnis des Deformationsmechanismus und
649
der Feinstruktur der Hydratzellulose. Kolloid-Z. 88: 68.
650
https://doi.org/10.1007/BF01518890
651
Honorio, T., Brochard, L., Vandamme, M., Lebée, A., 2018. Flexibility of nanolayers and
652
stacks: implications in the nanostructuration of clays. Soft Matter 14, 7354–7367.
653
https://doi.org/10.1039/C8SM01359D
654
Hubert, F., Bihannic, I., Prêt, D., Tertre, E., Nauleau, B., Pelletier, M., Demé, B., Ferrage, E.,
655
2013. Investigating the anisotropic features of particle orientation in synthetic swelling
656
clay porous media. Clays Clay Miner. 61, 397–415.
657
https://doi.org/10.1346/CCMN.2013.0610501
658
Jacops, E., Aertsens, M., Maes, N., Bruggeman, C., Swennen, R., Krooss, B.,
Amann-659
Hildenbrand, A., Littke, R., 2017. The Dependency of Diffusion Coefficients and
660
Geometric Factor on the Size of the Diffusing Molecule: Observations for Different
661
Clay-Based Materials. Geofluids 2017.
662
Keller, L.M., Seiphoori, A., Gasser, P., Lucas, F., Holzer, L., Ferrari, A., 2014. The Pore
663
Structure of Compacted and Partly Saturated MX-80 Bentonite at Different Dry
664
Densities. Clays Clay Miner. 62, 174–187.
665
https://doi.org/10.1346/CCMN.2014.0620302