HAL Id: hal-02976279
https://hal.archives-ouvertes.fr/hal-02976279
Submitted on 26 Oct 2020
HAL is a multi-disciplinary open access
archive for the deposit and dissemination of
sci-entific research documents, whether they are
pub-lished or not. The documents may come from
teaching and research institutions in France or
abroad, or from public or private research centers.
L’archive ouverte pluridisciplinaire HAL, est
destinée au dépôt et à la diffusion de documents
scientifiques de niveau recherche, publiés ou non,
émanant des établissements d’enseignement et de
recherche français ou étrangers, des laboratoires
publics ou privés.
To cite this version:
Nancy Bertler, Howard Conway, Dorthe Dahl-Jensen, Daniel Emanuelsson, Mai Winstrup, et al.. The
Ross Sea Dipole – temperature, snow accumulation and sea ice variability in the Ross Sea region,
Antarctica, over the past 2700 years. Climate of the Past, European Geosciences Union (EGU), 2018,
14 (2), pp.193-214. �10.5194/cp-14-193-2018�. �hal-02976279�
https://doi.org/10.5194/cp-14-193-2018
© Author(s) 2018. This work is distributed under the Creative Commons Attribution 4.0 License.
The Ross Sea Dipole – temperature, snow accumulation and sea
ice variability in the Ross Sea region, Antarctica,
over the past 2700 years
Nancy A. N. Bertler1,2, Howard Conway3, Dorthe Dahl-Jensen4, Daniel B. Emanuelsson1,2, Mai Winstrup4, Paul T. Vallelonga4, James E. Lee5, Ed J. Brook5, Jeffrey P. Severinghaus6, Taylor J. Fudge3, Elizabeth D. Keller2, W. Troy Baisden2,b, Richard C. A. Hindmarsh7, Peter D. Neff1,2,c, Thomas Blunier4, Ross Edwards8,a,
Paul A. Mayewski9, Sepp Kipfstuhl10, Christo Buizert5, Silvia Canessa2, Ruzica Dadic1, Helle A. Kjær4, Andrei Kurbatov9, Dongqi Zhang11,12, Edwin D. Waddington3, Giovanni Baccolo13, Thomas Beers9,
Hannah J. Brightley1,2, Lionel Carter1, David Clemens-Sewall14, Viorela G. Ciobanu4, Barbara Delmonte13, Lukas Eling1,2, Aja Ellis8,e, Shruthi Ganesh15, Nicholas R. Golledge1,2, Skylar Haines9, Michael Handley9, Robert L. Hawley14, Chad M. Hogan16, Katelyn M. Johnson1,2, Elena Korotkikh9, Daniel P. Lowry1,
Darcy Mandeno1, Robert M. McKay1, James A. Menking5, Timothy R. Naish1, Caroline Noerling10, Agathe Ollive17,
Anaïs Orsi18, Bernadette C. Proemse16, Alexander R. Pyne1, Rebecca L. Pyne2, James Renwick1, Reed P. Scherer19,
Stefanie Semper20, Marius Simonsen4, Sharon B. Sneed9, Eric J. Steig3, Andrea Tuohy1,2,d,
Abhijith Ulayottil Venugopal1,2, Fernando Valero-Delgado10, Janani Venkatesh15, Feitang Wang12,21,
Shimeng Wang12, Dominic A. Winski14, V. Holly L. Winton8,f, Arran Whiteford22, Cunde Xiao23, Jiao Yang12, and Xin Zhang24
1Antarctic Research Centre, Victoria University of Wellington, Wellington, 6012, New Zealand 2GNS Science, Lower Hutt, 5010, New Zealand
3Department of Earth and Space Sciences, University of Washington, Seattle, WA 98195, USA 4Centre for Ice and Climate, Niels Bohr Institute, University of Copenhagen, Juliane Maries Vej 30,
2100 Copenhagen, Denmark
5College of Earth, Ocean, and Atmospheric Sciences, Oregon State University, Corvallis, OR 97330, USA 6Scripps Institution of Oceanography, UC San Diego, La Jolla, CA 92093, USA
7British Antarctic Survey, High Cross, Madingley Road, Cambridge, CB3 0ET, UK 8Physics and Astronomy, Curtin University, Perth, Western Australia, Australia 9Climate Change Institute, University of Maine, Orono, ME 04469-5790, USA 10Alfred Wegner Institute, Bremen, Germany
11Chinese Academy of Meteorological Sciences, Beijing, China
12State Key Laboratory of Cryospheric Science, Northwest Institute of Eco-Environment and Resources,
Chinese Academy of Sciences, Lanzhou, Gansu, China
13DISAT, Department of Earth and Environmental Sciences, University Milano-Bicocca,
Piazza della Scienza 1, 20126 Milano, Italy
14Department of Earth Sciences, Dartmouth College, 6105 Fairchild Hall, Hanover, NH 03755, USA
15Department of Chemical Engineering, SRM University, Kattankulathur 603203, Kancheepuram Dt., Tamil Nadu, India 16University of Tasmania, School of Biological Sciences, Hobart, TAS, 7001 Australia
17Specialty of Earth Sciences and Environment, UniLasalle, 19 rue Pierre Waguet, 60000 Beauvais, France 18Laboratoire des Sciences du Climat et de l’Environnement, LSCE/IPSL, CEA-CNRS-UVSQ,
Université Paris-Saclay, 91198 Gif-sur-Yvette, France
19Institute for the Study of the Environment, Sustainability & Energy, Northern Illinois University, DeKalb, IL 60115, USA 20Geophysical Institute, University of Bergen, and Bjerknes Centre for Climate Research, 5020 Bergen, Norway
21Tianshan Glaciology Station, Northwest Institute of Eco-Environment and Resources, Chinese Academy of Sciences,
Received: 14 July 2017 – Discussion started: 1 August 2017
Revised: 7 December 2017 – Accepted: 4 January 2018 – Published: 21 February 2018
Abstract.High-resolution, well-dated climate archives pro-vide an opportunity to investigate the dynamic interactions of climate patterns relevant for future projections. Here, we present data from a new, annually dated ice core record from the eastern Ross Sea, named the Roosevelt Island Climate Evolution (RICE) ice core. Comparison of this record with climate reanalysis data for the 1979–2012 interval shows that RICE reliably captures temperature and snow precipi-tation variability in the region. Trends over the past 2700 years in RICE are shown to be distinct from those in West Antarctica and the western Ross Sea captured by other ice cores. For most of this interval, the eastern Ross Sea was warming (or showing isotopic enrichment for other reasons), with increased snow accumulation and perhaps decreased sea ice concentration. However, West Antarctica cooled and the western Ross Sea showed no significant isotope tempera-ture trend. This pattern here is referred to as the Ross Sea Dipole. Notably, during the Little Ice Age, West Antarctica and the western Ross Sea experienced colder than average temperatures, while the eastern Ross Sea underwent a period of warming or increased isotopic enrichment. From the 17th century onwards, this dipole relationship changed. All three regions show current warming, with snow accumulation de-clining in West Antarctica and the eastern Ross Sea but in-creasing in the western Ross Sea. We interpret this pattern as reflecting an increase in sea ice in the eastern Ross Sea with perhaps the establishment of a modern Roosevelt Island polynya as a local moisture source for RICE.
1 Introduction
With carbon dioxide (CO2) and global temperatures
pre-dicted to continue to rise, model simulations of the Antarc-tic/Southern Ocean region show an increase in surface warm-ing for the comwarm-ing decades resultwarm-ing in reduced sea ice ex-tent, weakened Antarctic Bottom Water formation,
inten-sified zonal winds that reduce CO2 uptake by the
South-ern Ocean, a slowing of the southSouth-ern limb of the merid-ional overturning circulation (MOC) and associated changes in global heat transport, and a rapid ice sheet grounding line retreat that contributes to global sea level rise (Kusa-hara and Hasumi, 2013; Spence et al., 2012; Marshall and Speer, 2012; Sen Gupta et al., 2009; Toggweiler and Rus-sell, 2008; Russell et al., 2006; Downes et al., 2010; Ander-son et al., 2009; DeConto and Pollard, 2016; Joughin and Alley, 2011; Golledge et al., 2015; DeVries et al., 2017). Observations confirm an ozone-depletion-induced strength-ening and poleward contraction of zonal winds (Thompson and Solomon, 2002b; Arblaster et al., 2011), increased up-welling of warm, modified Circumpolar Deep Water (Jacobs et al., 2011), a warmer Southern Ocean (Böning et al., 2008; Gille, 2002; Abraham et al., 2013), meltwater-driven fresh-ening of the Ross Sea (Jacobs et al., 2002), ice shelf and mass loss, grounding line retreat (Rignot et al., 2014; Pollard et al., 2015; Paolo et al., 2015; Joughin et al., 2014), reduced formation of Antarctic Bottom Water (Rintoul, 2007) and Antarctic Intermediate Water (Wong et al., 1999), changes in sea ice (regional decreases and increases in the Amund-sen and Ross seas, respectively) (Holland and Kwok, 2012; Sinclair et al., 2014; Stammerjohn et al., 2012), and dy-namic changes in Southern Ocean CO2uptake driven by
at-mospheric circulation (Landschützer et al., 2015). However, these observational time series are short (Böning et al., 2008; Gille, 2002; Toggweiler and Russell, 2008) and inter-model variability indicates that physical processes and their conse-quences are not well captured or understood (Braconnot et al., 2012; Sen Gupta et al., 2009). While the skill of equilib-rium simulations steadily improves, the accuracy of transient model projections for the coming decades critically depends on an improved knowledge of climate variability, forcings and dynamic feedbacks (Stouffer et al., 2017; Bakker et al., 2017).
Here we present data from a new, highly resolved and ac-curately dated ice core record, spanning the past 2.7 kyr, from the eastern Ross Sea region. The Roosevelt Island Climate Evolution (RICE) ice core is compared with existing records in the region to investigate the characteristics and drivers of spatial and temporal climate variability in the Ross Sea re-gion.
2 Site characteristics and relevant climate drivers
In this section, a brief overview is provided of the climato-logical and glacioclimato-logical characteristics of the study site. 2.1 Dynamic interaction between tropical and
midlatitudinal climate drivers and South Pacific climate variability
Environmental variability in the Pacific Sector of the South-ern Ocean and Antarctica is dominated by three major at-mospheric circulation patterns: the Southern Annular Mode (SAM), the El Niño–Southern Oscillation (ENSO) and the Inter-decadal Pacific Oscillation (IPO). The SAM is the leading empirical orthogonal function (EOF) of the South-ern Hemisphere extratropical geopotential height fields on monthly and longer timescales and describes the strength and position of the Southern Hemisphere westerly winds via the relative pressure over Antarctica (∼ 65◦S) and the midlati-tudes (∼ 45◦S) (Thompson and Wallace, 2000; Thompson and Solomon, 2002a). The persistent positive, summer trend of the SAM (decreasing pressure over Antarctica) has been linked to stratospheric ozone depletion and an increase in atmospheric greenhouse gas concentration (Arblaster et al., 2011; Thompson et al., 2011). The positive SAM is asso-ciated with above-average warming of the Antarctic Penin-sula, cooler conditions over East Antarctica due to a reduced poleward pressure gradient and thus diminished transport of heat and moisture, and a reduction in katabatic flow (Mar-shall et al., 2013; Mar(Mar-shall and Thompson, 2016; Thompson and Solomon, 2002a). While the positive summer SAM trend (also weakly expressed during autumn) along the Antarctic margin is generally associated with an equatorward heat flux, the western Ross Sea is one of two regions (the Weddell Sea being the other) to experience an anomalous poleward heat flux (Marshall and Thompson, 2016) that transports heat and moisture across the Ross Ice Shelf. No such pattern is ob-served for regional surface air temperature (SAT) (Marshall and Thompson, 2016), which might be masked by the in-fluence of regional sea ice variability on local temperatures. The positive SAM has been shown to contribute at least par-tially to an increase in total Antarctic sea ice, while a neg-ative SAM has been associated with a reduced sea ice (Fer-reira et al., 2015; Holland et al., 2017; Bintanja et al., 2013; Kohyama and Hartmann, 2015; Turner et al., 2017). The fu-ture behaviour of the SAM over the next decades is a topic of active research due to the competing and seasonally
bi-ased influences of projected stratospheric ozone recovery and greenhouse gas emissions (Bracegirdle et al., 2014; Gillett and Fyfe, 2013; Thompson et al., 2011).
The Pacific South American (PSA) patterns represent at-mospheric Rossby wave trains initiated by anomalously deep tropical convection during ENSO events, in particular dur-ing austral sprdur-ing, which originate in the western (PSA1) and the central (PSA2) tropical Pacific (Mo and Higgins, 1998). PSA1 and PSA2 are defined as the second and third EOF respectively of monthly-mean extratropical geopoten-tial height fields, with the negative (positive) phase resem-bling El Niño (La Niña)-like conditions (Mo, 2000). Changes in SAT over West Antarctica have been linked to PSA1 vari-ability (Schneider et al., 2012; Schneider and Steig, 2008), while the warming of West Antarctica’s winter temperatures has been linked to PSA2 (Ding et al., 2011). The positive po-larity of PSA1 is associated with anticyclonic wind anoma-lies in the South Pacific centred at ∼ 120◦W, which have
been linked to increased onshore flow and increased eddy ac-tivity (Marshall and Thompson, 2016). In contrast, during the positive phase of the PSA2, the anticyclonic centre shifts to ∼150◦W in the Ross Sea, creating a dipole across the Ross Ice Shelf, with increased transport of marine air masses along the western Ross Ice Shelf and enhanced katabatic flow along the eastern Ross Ice Shelf (Marshall and Thompson, 2016). Sea ice feedbacks to the SAM and ENSO forcing in the west-ern Ross Sea (as well as the Bellingshausen Sea) were found to be particularly strong when a negative SAM coincided with El Niño events (increased poleward heat flux, less sea ice) or a positive SAM concurred with La Niña events (de-creased poleward heat flux, more sea ice) (Stammerjohn et al., 2008). The authors found that this teleconnection is less pronounced in the eastern Ross Sea.
The IPO, an ENSO-like climate variation on decadal timescales (Power et al., 1999), is closely related to the Pa-cific Decadal Oscillation (PDO) (Mantua and Hare, 2002). While the PDO is defined as the first EOF of sea surface tem-perature (SST) variability in the Northern Pacific, the IPO is defined by a tripole index of decadal-scale SST anomalies across the Pacific (Henley et al., 2015). A warm tropical Pa-cific and weakened trade winds are associated with a positive IPO, while a cooler tropical Pacific and strengthened trade winds are characteristic of a negative IPO. The phasing of the IPO and PDO have been shown to influence the strength of regional and global teleconnections with ENSO (Henley et al., 2015). An in-phase IPO amplification of ENSO events has been linked to a strengthening of global dry/wet anoma-lies, in contrast to periods when the IPO and ENSO are out of phase, causing these anomalies to weaken or disappear en-tirely (Wang et al., 2014). In addition, a negative IPO leads to cooler SSTs in the Ross, Amundsen and Bellingshausen seas, while a positive IPO is associated with warmer SSTs (Henley et al., 2015). The centre of anticyclonic circulation linked to precipitation at Roosevelt Island (Emanuelsson et al., 2018) moves eastward during the negative IPO from ∼ 120◦W
dur-Figure 1.(a) Overview map of the Ross Sea region and eastern West Antarctica. Antarctic ice velocity derived from the Advanced Land Observing Satellite (ALOS) with the Phased Array type L-band Synthetic Aperture Radar (PALSAR), the European Space Agency (ESA) Envisat Advanced Synthetic Aperture Radar (ASAR), European Remote Sensing (ERS) satellites, ERS-1 and 2, and the the Canadian Space Agency (CSA) RADARSAT-1 and 2 satellite radar interferometry colour-coded on a logarithmic scale (Rignot et al., 2011). Coloured dots indicate the locations of ice core drilling sites used in this paper: RICE (blue), West Antarctic Ice Sheet Divide ice core (WDC; red), Siple Dome (green), TALDICE and Talos Dome TD96 (purple), Taylor Dome (orange). (b) Overview map of Roosevelt Island derived from the Moderate-resolution Imaging Spectroradiometer (MODIS) satellite images (Scambos et al., 2007). The maps were created using the Antarctic Mapping Tool (Greene et al., 2017). The coloured dots indicate the location of the RICE drill site (blue) and the nearest ERA-Interim (ERAi) grid point (yellow).
ing the positive IPO to ∼ 100◦W (Henley et al., 2015). It has been suggested that the negative IPO, at least in part, is responsible for the hiatus in global surface warming dur-ing 1940–1975 and 2001–2009 (England et al., 2014; Kosaka and Xie, 2013; Meehl et al., 2011).
The Amundsen Sea Low (ASL), a semi-permanent low-pressure centre in the Ross–Amundsen Sea, is the most prominent and persistent of three low-pressure centres around Antarctica, associated with the wave number 3 cir-culation (Raphael, 2004; Raphael et al., 2016; Turner et al., 2013). The ASL is sensitive to ENSO (especially during win-ter and spring) and SAM (in particular during autumn) and influences environmental conditions in the Ross, Amund-sen and BellingshauAmund-sen seas and across West Antarctica and the Antarctic Peninsula (Ding and Steig, 2013; Raphael et al., 2016; Steig et al., 2012; Marshall and Thompson, 2016; Bertler et al., 2004; Turner et al., 2013; Thomas et al., 2009). Seasonally, the ASL centre moves from ∼ 110◦W in
dur-ing austral summer to ∼ 150◦W in austral winter (Turner et
al., 2013). A positive SAM and/or La Niña event leads to a deepening of the ASL, while a negative SAM and/or El Niño event causes a weakening (Turner et al., 2013). The IPO, through its effect upon ENSO and SAM variability, also influences the ASL and sea ice extent in the Ross and Amundsen seas (Meehl et al., 2016). Blocking events in the Amundsen Sea (Renwick, 2005) are sensitive to the position of the ASL and are dominant drivers of marine air mass intru-sions and associated precipitation and temperature anomalies at Roosevelt Island (Emanuelsson et al., 2018).
2.2 RICE site characteristics
Roosevelt Island is an approximately 120 km long by 60 km wide grounded ice rise located near the north-eastern edge of the Ross Ice Shelf (Fig. 1). Ice accumulates locally on the ice rise, while the floating Ross Ice Shelf flows around Roosevelt Island. The ice surrounding Roosevelt Is-land originates from the West Antarctic Ice Sheet (WAIS), via the Bindschadler, MacAyeal and Echelmeyer ice streams. Bedmap2 data (Fretwell et al., 2013) suggest that the ma-rine basins on either side of Roosevelt Island are roughly 600 m (western basin) and 750 m (eastern basin) deep and that the thickness of the Ross Ice Shelf at this location is about 500 m. At the RICE drill site (79.364◦S, 161.706◦W, 550 m above sea level) near the summit of Roosevelt Is-land, the ice is 764 m thick and grounded 214 m below sea level. Radar surveys across the Roosevelt Island ice divide show well-developed “Raymond arches” (Raymond, 1984) of isochrones suggesting a stable ice divide (Conway et al., 1999). The vertical velocity, constrained by phase-sensitive radio echo sounder (pRES) measurements, is approximately 20 cm a−1at the surface relative to the velocity of 0 cm a−1 at the bed (Kingslake et al., 2014). A small migration of the divide has occurred in the past few centuries with the topo-graphic divide off-set by about 500 m to the south-west. It is possible that the divide migrated as a result of an imbalance in the ice flux on either side of the divide, by either changes in the snow accumulation gradient or changes in the efflux across the grounding line due perhaps to changes in the but-tressing by the Ross Ice Shelf. However, the negligible divide position migration magnitude suggests that neither snow
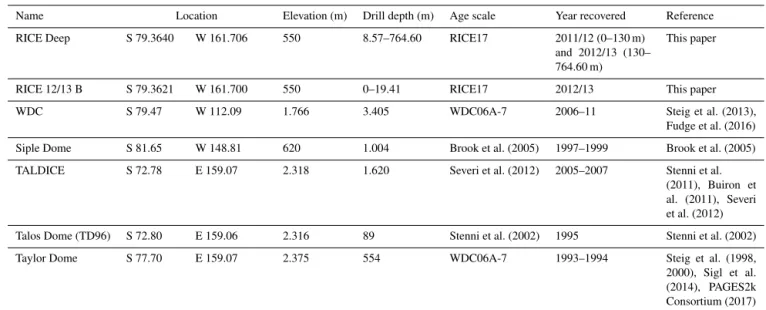
ac-Table 1.Overview of ice core records used in this paper. Locations are presented in Fig. 1.
Name Location Elevation (m) Drill depth (m) Age scale Year recovered Reference RICE Deep S 79.3640 W 161.706 550 8.57–764.60 RICE17 2011/12 (0–130 m)
and 2012/13 (130– 764.60 m)
This paper
RICE 12/13 B S 79.3621 W 161.700 550 0–19.41 RICE17 2012/13 This paper WDC S 79.47 W 112.09 1.766 3.405 WDC06A-7 2006–11 Steig et al. (2013),
Fudge et al. (2016) Siple Dome S 81.65 W 148.81 620 1.004 Brook et al. (2005) 1997–1999 Brook et al. (2005) TALDICE S 72.78 E 159.07 2.318 1.620 Severi et al. (2012) 2005–2007 Stenni et al.
(2011), Buiron et al. (2011), Severi et al. (2012) Talos Dome (TD96) S 72.80 E 159.06 2.316 89 Stenni et al. (2002) 1995 Stenni et al. (2002) Taylor Dome S 77.70 E 159.07 2.375 554 WDC06A-7 1993–1994 Steig et al. (1998, 2000), Sigl et al. (2014), PAGES2k Consortium (2017)
cumulation gradient nor grounding line efflux have changed very much; this implies that the buttressing has not changed significantly either.
3 Ice core data
During two field seasons, 2011–2012 and 2012–2013, a 764 m long ice core to bedrock was extracted from the sum-mit of Roosevelt Island. The drilling was conducted using the New Zealand intermediate depth ice core drill Te W¯amua Hukapapa (“Ice Cores That Discover the Past” in NZ Te Reo native language). The drill system is based on the Dan-ish Hans Tausen Drill with some design modification (Man-deno et al., 2013). The upper 60 m of the borehole was cased with plastic pipe and the remainder of the drill hole filled with a mixture of Estisol-240 and Coasol to prevent clo-sure. The part of the RICE ice core record used in this study covers the past 2.7 kyr and consists of data combined from the RICE-2012/13-B firn core (0.19–12.30 m depth) and the RICE Deep ice core (12.30–344 m depth). In addition, the uppermost samples from a 1.5 m deep snow pit were used to extend the firn and ice core record for the month of December 2012. An overview of the core quality and processing proce-dures are summarised by Pyne et al. (2018). Here, we present new water stable-isotope (deuterium, δD) and snow accumu-lation records and compare them with existing records from West and East Antarctica (Table 1).
3.1 RICE age model: RICE17
The RICE17 age model for the past 2.7 kyr is based on an annually dated ice core chronology from 0 to 344 m which is described in detail by Winstrup et al. (2017). The cumulated age uncertainty for the past 100 years is ≤ ±2 years, for the
past 1000 years ≤ ±19 years and for the past 2000 years ≤ ±38 years, reaching a maximum uncertainty of ±45 years at 344 m depth (2.7 kyr). The RICE17 timescale is in good agreement with the WD2014 annual-layer counted timescale from the WAIS Divide ice core dating to 200 CE (280 m depth). For the deeper parts of the core, there is likely a small bias (2–3 %) towards undercounting the annual layers, result-ing in a small age offset compared to the WD2014 timescale. 3.2 Snow accumulation reconstruction
Ice core annual layer thicknesses provide a record of past snow accumulation once the amount of vertical strain has been accounted for. At Roosevelt Island, repeat pRES mea-surements were performed across the divide, providing a di-rect measurement of the vertical velocity profile (Kingslake et al., 2014). This has a key advantage over most previ-ous ice core inferences of accumulation rate because verti-cal strain thinning through the ice sheet is measured directly, rather than needing to use an approximation for ice flow near ice divides (e.g. Dansgaard and Johnsen, 1969; Lliboutry, 1979). Uncertainty in the accumulation-rate reconstruction increases from zero at the surface (no strain thinning) to ±10 % at 78 m true depth (1712 CE). Below 78 m, the un-certainty remains constant at ±10 %. A detailed description of the accumulation-rate reconstruction is provided by Win-strup et al. (2017).
3.3 Water stable-isotope data
The water stable-isotope record was measured using a continuous-flow laser spectroscopy system with an off-axis integrated cavity output spectroscopy (OA-ICOS) analyser, manufactured by Los Gatos Research (LGR). The water for these measurements was derived from the inner section of
Figure 2.Spatial correlation fields exceeding ≥ 95 % significance between (a) ERAi annual SAT at the RICE site with ERAi annual SAT in the Antarctic/Southern Ocean region and (b) ERAi annual SAT and annually averaged RICE δD data; (c) as for (b) but with optimised RICE δD data alignment within the dating uncertainty. The correlation was performed using http://climatereanalyzer.org/, University of Maine, USA. Comparison of the ERAi SAT time series with (d) RICE δD data and (e) optimised RICE δD data alignment. Panel (f) scatter plot between RICE δDoand ERAi SAT. The coloured dots indicate the locations of the drill sites – RICE (blue), Siple Dome (green), WDC (red),
TALDICE (pink) and Taylor Dome (orange).
the continuous flow analysis (CFA) melt head, while water from the outside section was collected for discrete samples. A detailed description and quality assessment of this system is provided by Emanuelsson et al. (2015). The combined un-certainty for deuterium (δD) at 2 cm resolution is ±0.85 ‰. A detailed description of the isotope calibration, the calcula-tion of cumulative uncertainties, and the assignment of depth is provided by Keller et al. (2018).
4 RICE data correlation with reanalysis data – modern temperature, snow accumulation and sea ice extent trends
The ERA-Interim (ERAi) reanalysis data set of the European Centre for Medium-Range Weather Forecasts (ECMWF; Dee et al., 2011), along with firn and ice cores, snow stakes and an automatic weather station (AWS) are used to charac-terise the meteorology of Roosevelt Island. ERAi data have been extracted for the RICE drill site from the nearest grid point (S 79.50◦, W 162.00◦; Fig. 1b) for the common time
period between 1979 and 2012. The year 1979, the onset of the ERAi reanalysis, occurs at 13.42 m depth in the firn. For this reason, the period 1979–2012 is predominantly captured in the RICE 12/13 B firn core. Data from the RICE AWS suggest that precipitation at RICE can be irregular, with large snow precipitation events dominating the accumulation pat-tern (Emanuelsson, 2016). Therefore, we limit the analysis in this study to annual averages and longer-term trends.
4.1 Isotope temperature correlation
The borehole temperature measured in 2012 in two 11 and 12 m deep drill holes suggest an average annual tempera-ture of −23.5◦C. This stands in stark contrast to the average annual temperature derived from ERAi data of −27.4◦C at the RICE site. Furthermore, the RICE AWS also recorded an average annual temperature of −23.5◦C. In contrast,
the nearby Margaret AWS (located at 67 m a.s.l., just 96 km south-west of the RICE AWS; data obtained from Antarc-tic Meteorological Research Center and AutomaAntarc-tic Weather Station Project; https://amrc.ssec.wisc.edu) records an aver-age annual temperature of −26.6◦C. While recorded sum-mer temperatures at RICE and Margaret AWS agree well, during winter the Margaret AWS records up to 10–15◦C colder 3-hourly temperatures than the RICE AWS. It is possi-ble that rime build-up at the RICE AWS during winter (Sup-plement Fig. S1) might have provided insulation that allowed for residual heat from the sensors to warm the temperature cavity leading to erroneously warm readings. Alternatively, it is possible that the Margaret AWS site is influenced by stronger temperature inversions leading to exceptionally cold temperatures of −60◦C, while the topography of Roosevelt
Island might be less conducive to such conditions. A compar-ison between high-resolution borehole temperature measure-ments conducted at RICE from November 2013 to November 2014 and AWS data, including snow temperature measure-ments, will provide important insights into this temperature off-set. Until this analysis is concluded, we argue that ERAi data, which agree well with the Margaret AWS observations,
provide the most reliable temperature time series to calibrate the stable-isotope–temperature relationship.
In Fig. 2a, the ERAi SAT time series extracted for the RICE drill site is compared with the ERAi SAT spatial grid. The analysis suggests that temperature variability at RICE is representative of variability across the Ross Ice Shelf (with the exception of the westernmost margin along the Transantarctic Mountains), northern Victoria Land, western Marie Byrd Land, and the Ross and Amundsen seas. Fur-thermore, the Antarctic Dipole pattern (Yuan and Martinson, 2001), a negative correlation between the SAT in the Ross– Amundsen Sea region and that of the Weddell Sea, is also captured in the data. The locations of the Siple Dome, West Antarctic Ice Sheet Divide ice core (WDC), Talos Dome, TALDICE and Taylor Dome ice cores fall within the region of positive RICE SAT correlation.
The correlation between RICE δD data and ERAi SAT (Fig. 2b) remains positive across the Ross Ice Shelf and northern Ross Sea, but the WDC site now falls outside the field of the statistically significant correlation. The time se-ries correlation between the ERAi SAT record and the RICE δD data (Fig. 2d) is r = 0.42(p<0.01). We test the robust-ness of this relationship by applying the minimum and max-imum age solutions within the age uncertainty (≤ 2 year during this time period; Winstrup et al., 2017) to identify the age model solution within the age uncertainty that ren-ders the highest correlation. This optimised solution RICE δDois shown in Fig. 2e with a correlation coefficient of r =
0.66(p<0.001). The correlation of the RICE δDorecord with
the ERAi SAT data (Fig. 2c) produces a pattern that more closely resembles the correlation pattern using the ERAi data itself (Fig. 2a), suggesting that the δD record provides useful information about the regional temperature history.
From the comparison between RICE δDoand ERAi SAT
records, we obtain a temporal slope of 3.37 ‰◦C−1(Fig. 2f), which falls within the limit of previously reported values from Antarctica of ∼ 2.90–3.43 ‰◦C−1 for temporal (in-terannual) slopes (Schneider et al., 2005) and ∼ 6.80 ± 0.57 ‰◦C−1 for spatial slopes (Masson-Delmotte et al., 2008). We use this relationship to calculate temperature vari-ations for the RICE δD record. The average annual tempera-ture calculated for 1979–2012 from ERAi for the RICE site is −27.4 ± 2.4◦C and −27.5 ± 3.6◦C for the δDodata.
Al-though the year-to-year SAT variability appears to be well captured in the RICE δDorecord, there are discrepancies in
observed trends. While RICE δDodata suggest an increase
in SAT from 1996 onwards, ERAi SAT data do not show a trend (Fig. 2e). It remains a challenge to determine how well reanalysis products, including ERAi data, and other observa-tions, including isotope data, capture temperature trends in Antarctica (PAGES2k Consortium, 2013; Stenni et al., 2017) and thus whether the observed difference in the trend be-tween ice core δDo and ERAi SAT is significant or
mean-ingful. We also compare the δDo with records from AWS
(Ferrell, Gill and Margaret AWS) and stations (Byrd,
Mc-Figure 3.Comparison of snow accumulation data recorded by the RICE AWS (blue) in cumulative snow height in centimetres and ERAi precipitation values (red) in centimetres water-equivalent cu-mulative height for the RICE drill location. Dotted blue and red lines indicate linear trends for AWS and ERAi data, respectively.
Murdo, Scott Base, Siple Stations) in the region (Fig. S2 and Table S1, Supplement). The comparison is hampered by the shortness of the records and gaps in the observations. Only years were used for which monthly values were reported for each month of the year. No statistically significant correlation was identified between δDoand available data.
Furthermore, we test the correlation with the near-surface Antarctic temperature reconstruction by Nicolas and Bromwich (2014; referred to as NB2014), which uses three reanalysis products and takes advantage of the revised Byrd Station temperature record (Bromwich et al., 2013) to pro-vide an improved reanalysis product for Antarctica for the time period 1958–2012 CE. We find no correlation between the NB2014 record and the ERAi data at the RICE site, nor the RICE δDodata for the 1979–2012 time period, perhaps
suggesting some regional challenges. If the full time period available for the NB2014 data is considered (1957–2012), the NB2014–RICE δDocorrelation becomes weakly statistically
significant with r = 0.23 (p = 0.09, Table S1).
4.2 Regional snow accumulation variability
Temporal and spatial variability in snow accumulation are assessed using 144 snow stakes covering a 200 km2 array. The 3 m long, stainless steel poles were set and surveyed in November 2010, measured in January 2011, and re-visited and extended in January 2012 and November 2013. The measurements indicate a strong accumulation gradient with up to 32 cm water equivalent per year (w.e. a−1) on the north-eastern flank decreasing to 9 cm w.e. a−1on the south-western flank. Near the drill site, annual average snow accu-mulation rates range from 22 ± 4 cm w.e. a−1 from 2010 to 2013.
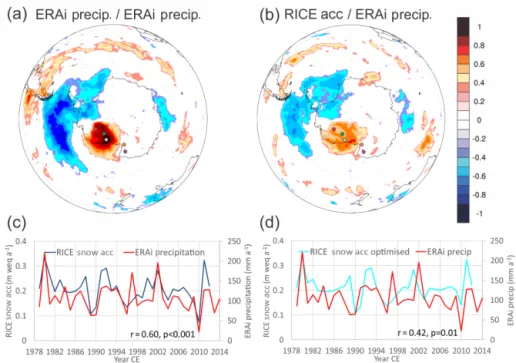
Figure 4.(a) Spatial correlation between ERAi annual precipitation at the RICE site with ERAi annual precipitation in the Antarctic/Southern Ocean region and (b) spatial correlation between ERAi annual precipitation and annually averaged RICE snow accumulation data. Only fields exceeding ≥ 95 % significance are shown. The correlation has been performed using http://climatereanalyzer.org/, University of Maine, USA. Comparison of the ERAi precipitation time series with (d) RICE snow accumulation data and (e) RICE snow accumulation with optimised RICE δD data alignment. Coloured dots indicate locations of WDC (red), Siple Dome (green), RICE (blue), TALDICE and Talos Dome (purple) and Taylor Dome (orange).
In addition, snow accumulation was measured using an ul-trasonic sensor mounted on the RICE AWS. The sensor was positioned 140–160 cm above the ground and reset during each season. The 3-year record shows gaps (Fig. 3) which represent times when rime on the sensor and/or blowing snow caused erroneous measurements. This condition was particularly prevalent during winter. Over the 3 years, the site received an average snowfall of ∼ 75 cm a−1. Assuming an average density of 0.37 g cm−3(average density from two snow pits, 0–75 cm), the AWS data suggest ∼ 20 cm w.e. a−1 accumulation, which is comparable with the accumulation rate derived from the ice core (21 ± 6 cm w.e. a−1for the pe-riod 1979–2012; Winstrup et al., 2017). In contrast, ERAi data suggest an average annual snow accumulation of only 11 cm w.e. a−1. It has been shown that Antarctic ERAi data capture precipitation variability but generally underestimate the precipitation total (Wang et al., 2016; Sinclair et al., 2010; Bromwich et al., 2011). Further, the ERAi data are not di-rectly comparable to local measurements because they do not capture periods of snow scouring by wind. Yet, there is a good agreement between the two data sets with respect to the timing and relative rate of precipitation, which suggests that neither winters nor summers have been times of signifi-cant snow scouring. We attribute the difference between the ERAi data and our measurements to the spatial differences between measurements of the snow stake array, the
inter-polation field of the nearest ERAi data point and the actual drill site location, as well as differences in assumed snow densities or different methodologies in the conversion from precipitation to water-equivalent units. The regional repre-sentativeness of RICE snow accumulation data is assessed by correlating the ERAi precipitation time series, extracted for the RICE location, with the ERAi precipitation grid data (Fig. 4a). The correlation suggests that precipitation vari-ability at Roosevelt Island is representative of the observed variability across the Ross Ice Shelf, the southern Ross Sea, and western West Antarctica. We note from Fig. 4a that the sites of the Siple Dome ice core (green circle) and the WDC (red circle) are situated within the positive correlation field, while Talos Dome (purple circle) and Taylor Dome (orange circle) show no correlation to ERAi precipitation at RICE. A negative correlation is found with the region of the South Pacific, Antarctic Peninsula and eastern West Antarctica. In Fig. 4b, the RICE snow accumulation record is correlated with ERAi precipitation data and shows a similar pattern. The resemblance of the correlation patterns suggests that the variability in the RICE snow accumulation data (Fig. 4b) re-flects regional precipitation variability (Fig. 4a) and thus can likely elucidate regional snow accumulation variability in the past, in particular for array reconstructions such as Thomas et al. (2017). We also test the correlation with the optimised age scale derived for the δDorecord and find that for snow
accu-mulation data this adjusted age scale (Acco) reduces the
cor-relation but remains statistically significant (Table 2). This result suggests that the optimised age solution is not supe-rior to the RICE17 age scale, and we note that the sensitivity of the correlation to those minor adjustments is founded in the brevity of the common time period. However, there is no significant difference between the overall pattern and rela-tionships of the two age scale solutions.
4.3 Influence of regional sea ice variability on RICE isotope and snow accumulation
Sea ice variability has been shown to influence isotope values in precipitated snow, particularly in coastal locations (Küttel et al., 2012; Noone and Simmonds, 2004; Thomas and Brace-girdle, 2009) through the increased contribution of enriched water vapour during times of reduced sea ice and increased sensible heat flux due to a higher degree of atmospheric strat-ification leading to more vigorous moisture transport. Tuohy et al. (2015) demonstrated that for the period 2006–2012, ∼40–60 % of precipitation arriving at Roosevelt Island came from local sources in the southern Ross Sea. In addition, Emanuelsson et al. (2018) demonstrated the important role of blocking events that are associated with over 88 % of large precipitation events at RICE, on sea ice variability via merid-ional wind field anomalies.
Snow accumulation at RICE is negatively correlated with sea ice concentration (SIC) in the Ross Sea region and north-ern Amundsen Sea region (Fig. 5a), which predominately represents sea ice exported from the Ross Sea. We observe years of increased (decreased) SIC leading to reduced (in-creased) accumulation at RICE, confirming the sensitivity of moisture-bearing marine air mass intrusions to local ocean moisture sources and hence regional SIC. The correlation between ERAi SIC and the optimised RICE δDo record
(Fig. 5b) similarly shows a negative correlation of SIC in the Ross Sea (perhaps with the exception of the Ross and Terra Nova polynyas) and the northern Amundsen Sea, suggesting more depleted (enriched) values during years of increased (reduced) SIC.
In Fig. 5c and d, the sea ice extent index (SIEJ) for the
Ross–Amundsen Sea, developed by Jones et al. (2016), is correlated with ERAi SAT and precipitation data. The analy-sis also identifies the co-variance of sea ice extent (SIE) and SAT, with increasing (decreasing) sea ice coinciding with cooler (warmer) SAT. This suggests that during years of in-creased SIE, the Ross Ice Shelf and western Marie Byrd Land experience lower temperatures and less snow accumu-lation. The correlation between SIEJ and ERAi precipitation
at RICE is r = −0.67, and for SIEJ and RICE snow
accu-mulation it is r = −0.56 (Table 2). Moreover, the correlation between SIEJ and ERAi SAT and SIEJ and RICE δDo is
also statistically significant with r = −0.38 and r = −0.58, respectively. The higher correlation with RICE δDoperhaps
suggests that the influence of SIE in the Ross Sea region
af-Figure 5.Panels (a) and (b): spatial correlation of ERAi sea ice concentration (SIC) fields with the time series of (a) RICE snow ac-cumulation and (b) RICE δDo. Panels (c) and (d): spatial correlation
of the Ross–Amundsen Sea SIEJ time series (Jones et al., 2016) with (c) ERAi precipitation and (d) ERAi SAT fields. Only fields exceeding ≥ 95% significance are shown. The correlation has been performed using http://climatereanalyzer.org/, University of Maine, USA. Coloured dots indicate locations of WDC (red), Siple Dome (green), RICE (blue), TALDICE and Talos Dome (purple) and Tay-lor Dome (orange).
fects the RICE δD record both through direct temperature changes in the region as well as fractionation processes that are independent of temperature, such as the lengthened dis-tillation pathway to RICE during periods of more extensive SIE.
The ERAi SAT and ERAi precipitation data at RICE (Ta-ble 2) reveal a positive correlation over large areas of Antarc-tica with higher correlation coefficients over the eastern Ross Sea and eastern Weddell Sea (spatial fields not shown). At the RICE site, the correlation reaches r = 0.66 (p<0.001). Moreover, the correlation between RICE δD and RICE snow accumulation data (RICE Acc) (or RICE δDo and RICE
Acco) data is statistically significant, with r = 0.49 (p<0.01)
(or ro=0.62, po<0.001. This suggests that years with
posi-tive isotope anomalies are frequently characterised by higher snow accumulation rates. In contrast, precipitation during low snow accumulation years might be dominated by pre-cipitation from air masses that have travelled further and per-haps across West Antarctica (Emanuelsson et al., 2018) lead-ing to more depleted isotope values and lower snow accumu-lation rates than local air masses from the Ross Sea region.
ERAi SAT x 0.66 −0.38 –0.49 nss nss nss Nss nss ERAi Precip 0.66 x –0.67 –0.42 –0.49 0.37 0.39 0.44 nss
SIEJ −0.38 –0.67 x 0.45 0.55 –0.48 –0.48 –0.58 nss
4.4 Influence of climate drivers on prevailing conditions in the Ross Sea region
Seasonal biases and the enhancing or compensating effects of the relative phasing of SAM, ENSO and IPO conditions, on seasonal, annual and decadal timescales make linear as-sociations of climate conditions and their relationship with climate drivers in the South Pacific challenging. We use the Southern Annular Mode Index (SAMA) developed by Abram
et al. (2014) to test the fidelity of the SAM relationship with the climatic conditions in the Ross Sea over the past millen-nium (Table 2). The SAMA is highly correlated (r = 0.75)
with the SAM record developed by Marshall (2003) for their common time period (1957–2009). In addition, the South-ern Oscillation Index (SOI; Trenberth and Stepaniak, 2001), Niño 3.4 Index (Rayner et al., 2003b), Niño 4 Index (Tren-berth and Stepaniak, 2001) and the IPO Index (Henley et al., 2015) are used to investigate the influence of SST vari-ability in the eastern and central tropical Pacific on annual and decadal timescales (IPO). In addition, we take advantage of an 850-year reconstruction of the Niño 3.4 index (Emile-Geay et al., 2013) to investigate any long-term influence of the eastern Pacific SST on environmental conditions in the Ross Sea.
The correlation of ERAi data and modern ice core records covering the 1979–2012 CE period with indices of relevant climate drivers (Table 2) suggests that SAMA has an
en-during statistically significant relationship with temperature, snow accumulation and SIE in the Ross Sea, with the posi-tive SAM being associated with cooler temperatures, lower snow accumulation or precipitation and more extensive SIE. The correlations remain robust and at comparable levels us-ing a detrended SAMArecord. In contrast, ENSO (SOI, Niño
3.4 and 4) and ENSO-like variability (IPO) have only linear statistically significant relationships with ERAi precipitation (but not with RICE snow accumulation) and SIEJ. The
dy-namic relationship between the phasing of SAM, ENSO and
IPO maybe masking aspects of the interactions (Fogt and Bromwich, 2006; Marshall and Thompson, 2016). In 2010, an anomalously cold year is observed. If only the time series from 1979 to 2009 is considered, the correlations between RICE δD and these considered climate drivers becomes sta-tistically significant: SOI (r = −0.48, p = 0.006), Niño 3.4 (r = 0.48, p = 0.007), Niño 4 (r = 0.57, p = 0.001) and IPO (r = 0.44, p = 0.014). This further highlights the vul-nerability of this analysis to individual years due to the brevity of the time series further complicating a linear analy-sis between individual drivers and regional responses. More-over, statistically significant correlations might also be ob-tained if seasonal averages could be used for the comparison as ENSO events usually peak during the austral summer, in particular December (Turner, 2004). Nonetheless, this anal-ysis confirms previous findings that the Ross Sea region is sensitive to the cumulative, independent and dependent in-fluences of SAM, ENSO and the IPO.
5 Temperature and snow accumulation variability over the past 2.7 kyr
Decadally smoothed RICE isotope and snow accumulation records for the past 2.7 kyr (Fig. 6) are compared with pub-lished data from the Ross Sea region (Siple Dome – green), coastal East Antarctica (Talos Dome/TALDICE – purple; Taylor Dome – orange) and West Antarctica (WDC – red).
5.1 Regional temperature variability
We find that the RICE and Siple Dome (Brook et al., 2005) water isotope records share a long-term isotopic warming trend in the Ross Sea region. In contrast, WDC isotope (Steig et al., 2013) and borehole temperature data (Orsi et al., 2012) exhibit a long-term cooling trend for West Antarctica, while TALDICE (Stenni et al., 2002) and Taylor Dome (Steig et al.,
Figure 6.(a) Isotope records for the past 2700 years for RICE, Siple Dome (Brook et al., 2005), WDC (WAIS Divide Project Members, 2013), TALDICE (Stenni et al., 2011) and Taylor Dome (Steig et al., 1999, 2000; Sigl et al., 2014; PAGES2k Consortium, 2017); (b) snow accumulation data for RICE (Winstrup et al., 2017), WDC (Fudge et al., 2016) and Talos Dome (TD96). No snow accumulation data are available for Siple Dome or Taylor Dome; (c) reconstructions of climate indices for SAMA(Abram et al., 2014) and Niño 3.4 based on
HadSST2 (Emile-Geay et al., 2013). Colour coding identifies above- and below-average values. Grey shaded area emphasises period of negative SAMA; yellow shaded area emphasises period of synchronous warming at RICE, Siple Dome, WDC and TALDICE.
are shown for three periods: 660 BCE to 580 CE – dark blue; 581–1477 CE – light blue; and 1478–2012 CE – cyan. The 10-year average temperature for the most recent decade contained in the record (2002–2012, −25.78◦C) is shown in pink. (b) Frequency occurrences of decadal RICE snow accumulation variations: 10-year moving averages for 660 to 623 CE (dark blue), 624–1736 CE (light blue) and 1737– 2012 CE (cyan). The 10-year average for the most recent decade contained in the record (2002–2012, 0.2 m w.e.) is shown in pink.
1998, 2000) recorded stable-isotopic conditions for coastal East Antarctica in the western Ross Sea.
Elevation changes influence water isotope values (Vinther et al., 2009). The thinning of Roosevelt Island, inferred from the amplitude of arched isochrones beneath the crest of the divide and the depth–age relationship from the ice core (Con-way et al., 1999), is less than 2 cm a−1for the past 3.5 kyr. Thus, the surface elevation has decreased less than 50 m over the past 2.7 kyr. Assuming that these elevation changes are sufficient to influence vertical movement of the precipitat-ing air mass, such an elevation change could account for an isotopic enrichment of δD = ∼ 2 ‰ (Vinther et al., 2009), which is insufficient to explain the total observed increase of 8 ‰. Furthermore, the RICE δD trend is characterised by two step changes at 580 CE ± 27 years and 1477 CE ± 10 years (grey dotted lines in Fig. 6). These change points were iden-tified using a minimum threshold parameterisation to achieve a minimised residual error (Killick et al., 2012; Lavielle, 2005). At the identified change points, the decadal isotope values increase by ∼ 3 and ∼ 5 ‰, respectively, which sug-gests that elevation changes were not a principal driver. Using the temporal slope of 3.37 ‰ per degree ◦C, these abrupt temperature transitions could represent an increase in the average decadal temperature (Fig. 7a) from −28.5 to −27.7◦C and from −27.7 to −26.2◦C. An underlying
in-fluence from long-term thinning, accounting for a δD shift of 2.4 ‰, would exaggerate the observed warming of 2.3◦C by 0.7◦C, thus suggesting a minimum isotopic temperature warming of at least 1.6◦C. The modern decadal isotope tem-perature average (2003–2012) of −25.1◦C (pink bar, Fig. 7a) and ERAi temperature of −26.5◦C lie within the 1σ distri-bution of the natural decadal temperature variability in the past 500 years. We note that changes in atmospheric circu-lation and sea ice extent might also have contributed signif-icantly to the change in the observed isotopic shift, and we offer some suggestions in the following sections.
The Siple Dome ice core δ18O record exhibits a simi-lar isotope history to the RICE δD record. Siple Dome iso-tope data reveal an abrupt warming or isotopic enrichment at 605 CE, some 25 years later than in RICE but within the cumulative age uncertainty of the two records. After 605 CE, Siple Dome isotope temperatures remain stable, al-though recording somewhat warmer isotope temperatures from about 1875 CE. Late-Holocene elevation changes (thin-ning) at Siple Dome have been reported to be negligible (Price et al., 2007) and are unlikely to have caused the ob-served abrupt isotopic shift at 605 CE. In contrast to records from the western Ross Sea (Bertler et al., 2011; Rhodes et al., 2012; Stenni et al., 2002) and West Antarctica (Orsi et al., 2012), RICE and Siple Dome do not show an isotopic warming or cooling associated with the Medieval Warm Pe-riod (MWP) or the Little Ice Age (LIA), respectively.
The WDC δ18O record suggests a long-term isotope cool-ing of West Antarctica, confirmed by borehole tempera-ture reconstructions (Orsi et al., 2012). This trend is con-sistent with warmer than average temperatures during the MWP and cooler conditions during the LIA but may also reflect changes in elevation and decreasing insolation (Steig et al., 2013). The cooling trend is followed by an in-crease in temperature in recent decades (Orsi et al., 2012; Steig et al., 2009) consistent with an increase in marine air mass intrusions (Steig et al., 2013). We note that within 200 years of the onset of the isotopic warming at RICE (at 580 CE ± 27 years), the WDC borehole temperature and iso-tope data start to record a temperature decline, in line with the observed anti-phased relationship of WDC with RICE and Siple Dome. No notable change is observed in WDC water stable-isotope temperature data in the late 15th century. In contrast, WDC borehole temperature suggests the onset of a warming trend within the last 100 years, marking the modern divergence between WDC isotope and borehole records. The TALDICE and Taylor Dome water stable-isotope
tempera-tures do not exhibit a long-term trend over the past 2.7 kyr. Yet colder water stable-isotope temperature anomalies have been associated with the LIA period at both sites (Stenni et al., 2002), which coincide with cooler conditions at WDC and the intensified increase in isotope temperature at RICE.
The similarity between the RICE and Siple Dome isotope records suggests that the eastern Ross Sea was dominated by regionally coherent climate drivers over the past 2.7 kyr, perhaps receiving precipitation via similar air mass trajecto-ries. Overall this comparison shows that isotope temperature trends in the eastern Ross Sea (isotopic warming at RICE and Siple Dome) and West Antarctica (WDC cooling) were anti-phased for over 2 kyr (660 BCE to ∼ 1500 CE), while the western Ross Sea (TALDICE) remained stable, forming a distinct Ross Sea Dipole pattern. From the 17th century onwards this relationship changes. While WDC water stable-isotope temperatures continue to cool, from the 17th century, the WDC borehole temperature records a warming. At the same time, RICE and Siple Dome experience warmer iso-tope temperatures while TALDICE recovers from its coldest recorded isotope temperature during the study period.
5.2 Regional snow accumulation variability
Investigating long-term trends in snow accumulation records (Fig. 6b), the decadally smoothed RICE shows a discernible positive trend from about 600 CE of about 0.2 ± 0.1 cm w.e. per century (Winstrup et al., 2017) for the eastern Ross Sea, while WDC (Fudge et al., 2016) displays a decreasing trend for central West Antarctica. The RICE snow accumulation data reach a maximum in the 13th century, with a trend to-wards lower values from the late 17th century onto-wards of about −0.9 ± 0.6 cm w.e. per century (Winstrup et al., 2017). Since 1950 CE, this trend has steepened to -6.6 cm w.e. per century (Winstrup et al., 2017). Based on the negative corre-lation between RICE snow accumucorre-lation and SIC in recent decades, we interpret the long-term increase in snow accu-mulation as representing a long-term reduction in SIC in the Ross Sea, consistent with a long-term increase in RICE iso-tope temperature. The recent rapid decline in snow accumu-lation rates could be related to increases in sea ice condi-tions in the eastern Ross Sea, perhaps marking the modern onset of local sea ice expansion. The modern decadal average (2002–2012) of 20 cm w.e. a−1lies within the 2σ variability in decadal RICE ice core snow accumulation rates (Fig. 7). Talos Dome records its maximum snow accumulation rates at the end of the 13th century and reduced snow accumu-lation during the Little Ice Age (Stenni et al., 2002). Until the 15th century, RICE and WDC snow accumulation and isotope data show an expected positive correlation between their respective isotope and snow accumulation records. Re-gionally, RICE and WDC isotope and snow accumulation are anti-phased. From the 16th century onwards, this rela-tionship reverses and RICE and WDC snow accumulation are now in phase, suggesting below-average snow
accumu-lation in the eastern Ross Sea and West Antarctica. We note that from the 16th century onwards, snow accumulation at RICE and WDC displays a negative correlation with water stable isotope (RICE) and borehole temperature (WDC) re-constructions. At RICE this relationship is again positive for 1979–2012. During the 20th century, Talos Dome records an increase in snow accumulation of ∼ 11% in the western Ross Sea (Stenni et al., 2002), in contrast to the observed snow ac-cumulation decrease at RICE and WDC. However, the values are not unique within the variability in the 800 years captured in the Talos Dome record.
6 Drivers and patterns of decadal to centennial climate variability
Palaeo-reconstructions of the SAMA (Abram et al., 2014)
and Niño 3.4 (Emile-Geay et al., 2013) indices (Fig. 6) provide important opportunities to investigate the influence of dominant drivers of regional climate conditions over the past millennium. In particular, the Niño 3.4 index captures the ENSO signal originating in the central-eastern tropical Pacific associated with the PSA1 pattern. Emile-Geay et al. (2013) note that while the reconstructions based on three model outputs agree well on decadal to multi-decadal time periods, they show different sensitivities at centennial reso-lution (but not different signs). The SAM index (Thompson and Wallace, 2000; Thompson and Solomon, 2002a) was de-veloped during the late 20th century, at a time when SAM was characterised by a strong positive trend. The SAMA
re-construction showed that the modern SAM is now at its most positive state in all of the past millennium (Abram et al., 2014). As a consequence, the reconstructed SAMAis mainly
negative. To investigate the influence of positive and nega-tive anomalies of the SAMArelative to its average state over
the past 1 kyr, we plot the SAMA reconstruction by
indi-cating values as being above (light purple) or below (pur-ple) the long-term average of −1.3 rather than 0. The tra-ditional positive SAMA values (above 0, dark purple) are
also shown for reference. Assessing the relationship between RICE, Siple Dome, WDC and TALDICE, we identify three major time periods of change: 660 BCE to 1367 CE (long-term baseline), 1368 to 1683 CE (negative SAMA) and 1684
to 2012 CE (onset of the positive SAMA).
6.1 Long-term baseline 660 BCE to 1367 CE
We find that for over 2 kyr – from 660 ± 44 BCE to 1367 ±12 CE – the eastern Ross Sea (RICE and Siple Dome) shows an enduring anti-phase relationship with West Antarc-tica (WDC), while coastal East AntarcAntarc-tica in the western Ross Sea (TALDICE, Taylor Dome) remains neutral (Fig. 6). Moreover, with some minor exceptions, isotope and snow ac-cumulation records at RICE, WDC and TALDICE are posi-tively correlated.
lor Dome record also shows prolonged cold isotope tempera-ture anomalies during this time period. Previously published shorter records from the western Ross Sea from Victoria Lower Glacier in the McMurdo Dry Valleys (Bertler et al., 2011) and Mt Erebus Saddle (Rhodes et al., 2012) also sug-gest colder conditions in the western Ross Sea during this pe-riod, with more extensive sea ice and stronger katabatic flow. We observe that WDC and TALDICE show below-average snow accumulation values, while RICE snow accumulation changes from a long-term positive to a negative trend. Such trends are consistent with the reported increased SIE in the western Ross Sea (colder SAT and lower snow accumulation at TALDICE; cooler conditions with more extensive sea ice and stronger katabatic winds at Victoria Lower Glacier and Mt Erebus) and Bellingshausen Sea (less snow accumulation and colder SAT at WDC). In contrast, RICE records warmer isotope temperatures along with less and more variable snow accumulation, displaying a distinct Ross Sea Dipole. Coin-ciding with the sudden increase in RICE δD in 1492 CE is the decoupling of the local isotope temperature from snow accumulation, evident from the diversion of the RICE snow accumulation and δD trends. The reduction in snow accumu-lation might be linked to a negative SAM-induced weaken-ing of the ASL, perhaps leadweaken-ing to the development of fewer blocking events in the eastern Ross Sea. Alternatively, the abrupt change to warmer isotope temperatures at RICE might also point towards the development of the Roosevelt Island polynya. In recent decades, a Roosevelt Island polynya has been observed and merges at times with the much larger Ross Sea polynya (Morales Maqueda et al., 2004). In contrast to the Ross Sea Polynya (Sinclair et al., 2010), a local polynya could provide a potent source of isotopically enriched vapour for precipitation at RICE, perhaps exaggerating the actual warming of the area as interpreted from water stable-isotope data. We expect the influence of a Roosevelt Island polynya to have a reduced effect on the more distant Siple Dome, which is consistent with our observations.
6.3 Onset of the positive SAM – 1684 to 2012 CE At 1684 CE ±7 years, the SAMA increases and remains
above its long-term average until modern times while the
cumulation trends. Coincident positive SAM (purple SAMA
values in Fig. 6c) and La Niña events have been linked in recent decades to increases in SIE in the western Ross Sea and decreases in the Bellingshausen Sea (Stammerjohn et al., 2008). This is consistent with the notable reduction in snow accumulation at RICE and the trend towards warmer con-ditions and increased marine air mass intrusions into West Antarctica as inferred from WDC isotope data (Steig et al., 2013) but is inconsistent with the reduction in snow precipi-tation at WDC and the trend to warmer isotope temperatures at RICE. We interpret the continuation of warm RICE iso-tope temperatures to reflect the persistence of the Roosevelt Island polynya.
6.4 Dipole pattern on decadal to centennial timescales To investigate the drivers of decadal to centennial variabil-ity, we compare the linearly detrended time series of RICE water stable-isotope records with those from (i) Siple Dome and WDC (West Antarctica; Fig. 8a) and (ii) TALDICE (East Antarctica, western Ross Sea; Fig. 8b). The analysis suggests that from about 500 CE onwards, RICE and Siple Dome vari-ability are in phase with West Antarctic climate varivari-ability (WDC). In contrast, RICE and TALDICE isotope variability alternates between spatial pattern of in-phase (purple) and anti-phase (grey, Ross Sea Dipole) relationships. During the negative phase of the SAMA(Fig. 8), the anti-correlation
be-tween RICE and TALDICE is particularly strong.
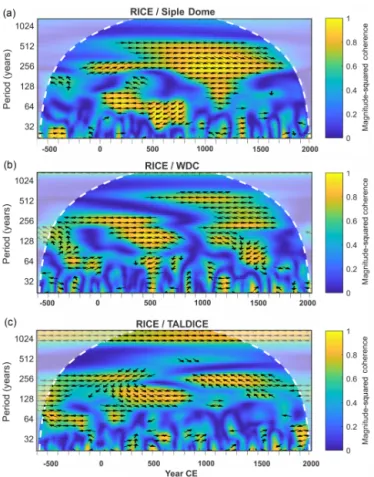
To assess the correlation of cyclicities apparent in the RICE, Siple Dome, WDC and TALDICE isotope records, wavelet coherence spectrum analyses were con-ducted (Fig. 9) on the time series shown in Fig. 8. The anal-ysis of RICE and Siple Dome (Fig. 9a) suggests that the two records positively correlate on a broad spectrum of frequen-cies with cyclicities between 200 and 500 years. The correla-tion is weakest during 660–100 BCE. A strong anti-phased coherence is also observed for the 30–70-year periodicity from 100 to 800 CE. The high coherency suggests that RICE and Siple Dome respond to similar forcings. The coherence analysis between RICE and WDC shows an enduring in-phase correlation from ∼ 1000 CE to today for the band-width of 200–700 years. An anti-phase coherence is found
Figure 8.Phasing of multi-decadal and centennial climate temper-ature variability at RICE, Siple Dome, WDC and TALDICE using detrended, normalised isotope records, smoothed with a 200-year moving average. RICE is compared with (a) Siple Dome and WDC and (b) TALDICE to investigate phase relationships of climate vari-ability in the eastern Ross Sea (RICE, Siple Dome) with West (WDC) and East Antarctica (TALDICE). WA: West Antarctica; EA: East Antarctica. The red shading indicates periods of synchroneity of RICE and Siple Dome records with WA. Grey shading indicates time periods where RICE (eastern Ross Sea) shows an anti-phase re-lationship (a Ross Sea Dipole) with TALDICE (western Ross Sea). Purple shading identifies times when RICE and EA are in phase. The normalised SAMAand Niño 3.4 records, smoothed with a
200-year moving average, are shown for comparison.
from 0 to 500 CE. The coherence analysis between RICE and TALDICE identifies strong relationships predominantly for the early part of the records, from 660 BCE to ∼ 800 CE, and a weak coherence from about 800 to 1700 CE, when RICE leads by ∼ 75–100 years. The analysis suggests that for the past 2.7 kyr the eastern Ross Sea (RICE, Siple Dome) and western West Antarctica (WDC) are climatologically closely linked in their response to forcings on decadal to centennial timescales and are positively correlated for the past 1.6 kyr. In contrast, the relationship between the western (TALDICE) and eastern (RICE, Siple Dome) Ross Sea is more variable.
7 Concluding remarks
The recent change to a strongly negative SAM (Marshall In-dex −3.12) in November 2016 coincided with a significant reduction in Antarctic SIE, including the Ross Sea, during the 2016/17 summer (Turner et al., 2017). Longer observa-tions are necessary to assess whether this recent trend con-tinues and indeed forces the reduced SIE, but it fuels ques-tions on the potential acceleration of future environmental change in the Antarctic/Southern Ocean region. To improve projections for the coming decades, an improved understand-ing of the interplay of teleconnections and local feedbacks is needed.
The Ross Sea region is a climatologically sensitive region that is exposed to tropical and midlatitude climate drivers.
Figure 9.Wavelet coherence and cross spectrum analysis of (a) RICE δD and Siple Dome δ18O, (b) RICE δD and WDC δ18O, and (c) RICE δD and TALDICE δ18O. The analysis was conducted on decadally averaged, detrended data, smoothed with a 200-year mov-ing average. The coherence is computed usmov-ing the Morlet wavelet and is expressed as magnitude-squared coherence (msc). The phase of the wavelet cross-spectrum is provide for values over 0.6 msc us-ing Welch’s overlapped averaged periodogram method (Kay, 1988; Rabiner et al., 1978). Arrows to the right indicate RICE is leading; arrows to the left indicate RICE is lagging. An upward or downward arrow represents quarter cycle difference.
The ASL has been shown to deepen during coinciding pos-itive SAM and La Niña events and to weaken during neg-ative SAM and El Niño events. Such interactions have far-reaching implications for the regional atmospheric and ocean circulations and sea ice (Turner et al., 2013; Raphael et al., 2016). Additionally, a negative (positive) IPO leads to cooler (warmer) SSTs in the Ross, Amundsen and Belling-shausen seas and has the potential to strengthen (in phase) or weaken (out of phase) the ENSO teleconnection (Henley et al., 2015). Furthermore, the phasing and strength of ENSO events and SAM have been shown to be time dependent (Fogt and Bromwich, 2006).
Our data suggest that changes in these dynamically linked climate patterns coincide with significant and abrupt changes in the past with implications for regional interpretations of trends, including temperature, mass balance and SIE. For
marine air mass intrusions into West Antarctica. Indeed, we observe that western West Antarctica (WDC borehole and isotope temperature) and the western Ross Sea (TALDICE) show cold temperatures during this time period that coin-cides with the Little Ice Age, while the eastern Ross Sea (RICE, Siple Dome) shows warmer or stable-isotope temper-atures. In the late 17th century, the SAMAchanges to
above-average values, concurrent with a change to strong La Niña-like conditions, a framework conducive to a deepening of the ASL. Now, West Antarctica (WDC borehole temperature), the eastern Ross Sea (RICE, Siple Dome) and the western Ross Sea (TALDICE) all experience warmer isotope tem-peratures. At the same time, however, we observe reduced snow accumulation at RICE and WDC and an increase at Ta-los Dome. We interpret this pattern to reflect an increase in SIE in the eastern Ross Sea with perhaps the establishment of the modern Roosevelt Island polynya as a local moisture source for RICE. The continued improvements of array re-constructions (Stenni et al., 2017; Thomas et al., 2017) and the assessment of isotope-enabled climate models are an ex-citing development to further our knowledge of the drivers and effects of past change and their implications for future projections.
8 Data availability
The following new RICE data are made available in this pa-per:
– RICE water stable isotopes (δD) have been archived at the PANGAEA data base: https://doi.org/10.1594/PANGAEA.880396 (Bertler et al., 2017).
– GPS and radar data have been archived at the U.S. Antarctic Program Data Center: https://gcmd.gsfc.nasa.gov/search/Metadata.do?entry= USAP-0944307&subset=GCMD (Kingslake et al., 2014; Matsuoka et al., 2015).
The following published RICE data used in this paper are accessible in the following way:
supplementary-information (WAIS Divide Project Members, 2013).
– WDC snow accumulation data were accessed via http: //www.usap-dc.org/view/dataset/601004 (Fudge et al., 2016).
– WDC borehole temperature was accessed via https: //nsidc.org/data/NSIDC-0638/versions/1 (Orsi et al., 2012).
– Talos Dome snow accumulation data were accessed via https://www.ncdc.noaa.gov/paleo/study/22712 (Stenni et al., 2002).
– TALDICE water stable-isotope data (δ18O) were ac-cessed via https://www1.ncdc.noaa.gov/pub/data/paleo/ pages2k/stenni2017antarctica/ (Stenni et al., 2017). – Siple Dome water stable isotopes (δ18O) were accessed
via https://www.nature.com/articles/nature12376# supplementary-information (WAIS Divide Project Members, 2013).
– Taylor Dome water stable isotopes (δ18O) were accessed via https://www1.ncdc.noaa.gov/pub/ data/paleo/pages2k/pages2k-temperature-v2-2017/ data-current-version/Ant-TaylorDome.Steig.2000.txt (Steig et al., 2000).
Sources of meteorological data and climate indices used in this paper are as follows:
– SAMA developed by Abram et al. (2014) was
ac-cessed via ftp://ftp.ncdc.noaa.gov/pub/data/paleo/ contributions_by_author/abram2014/abram2014sam. txt.
– The Niño 3.4 Index developed by Emile-Geay et al. (2013) was accessed via ftp://ftp.ncdc.noaa.gov/pub/ data/paleo/contributions_by_author/emile-geay2012/ emile-geay2012.xls.
– The Niño 3.4 Index (Rayner et al., 2003a) was accessed via http://www.esrl.noaa.gov/psd/gcos_wgsp/ Timeseries/Nino34/.
– The Niño 4 Index (Rayner et al., 2003a) was ac-cessed via https://www.esrl.noaa.gov/psd/gcos_wgsp/ Timeseries/Nino4/.
– SOI (Allan et al., 1991) was accessed via http://www. cru.uea.ac.uk/cru/data/soi/.
– The Ross–Amundsen Sea SIEJ developed by Jones
et al. (2016) was accessed via http://www.nature.com/ articles/nclimate3103#supplementary-information. – Byrd Station meteorological data (Bromwich et al.,
2013) were accessed via the Byrd Polar Research Cen-tre, Polar Meteorological Group, Ohio State University: http://www.polarmet.osu.edu/datasets/Byrd_recon/. – Meteorological data for Ferrell, Gill and Margaret AWS
were accessed via the Antarctic Meteorological Re-search Center and Automatic Weather Station Project https://amrc.ssec.wisc.edu.
– Data for McMurdo Station and Scott Base are ac-cessed via the MET-READER: https://legacy.bas.ac.uk/ met/READER/data.html (Turner et al., 2004).
– The IPO Index (Henley et al., 2015) was accessed via http://www.esrl.noaa.gov/psd/data/timeseries/IPOTPI/. – NB2014 were accessed via http://polarmet.osu.edu/
datasets/Antarctic_recon/ (Nicolas and Bromwich, 2014).
Supplement. The supplement related to this article is available online at: https://doi.org/10.5194/cp-14-193-2018-supplement.
Competing interests. The authors declare that they have no con-flict of interest.
Acknowledgements. Funding for this project was provided by the New Zealand Ministry of Business, Innovation, and Employment Grants through Victoria University of Wellington (RDF-VUW-1103, 15-VUW-131) and GNS Science (540GCT32, 540GCT12), and Antarctica New Zealand (K049), the US National Science Foundation (US NSF ANT-0944021, ANT-0944307, ANT-1443472), British Antarctic Survey Funding (BAS PSPE), the Center of Ice and Climate at the Niels Bohr Institute through the Carlsberg Foundation’s “North-South Climate Connection” project grant, and the Major State Basic Research Development Program of China (Grant No. 2013CBA01804). The authors appreciate the sup-port of the University of Wisconsin-Madison Automatic Weather Station Program for the data set, data display and information (NSF grant number ANT-1543305). We are indebted to Hedley Berge, Jeff Rawson, Margie Grant, Lou Albershardt, and Antarctica New Zealand staff at Scott Base and in Christchurch for their support of the RICE field seasons. We are grateful for the support by US 109th New York Air National Guard (NYANG) LC-130 Hercules
and Canadian Kenn Borek aircraft crews for their excellent support into and out of Roosevelt Island. Furthermore, we would like to thank Stephen Mawdesley, Grant Kellett, Ryan Davidson, Ed Hutchinson, Bruce Crothers and John Futter of the Mechanical and Electronic Workshops of GNS Science for technical support for the international RICE core progressing campaigns. We would like to thank Beaudette Ross for conducting gas isotope measurements at the Scripps Institution of Oceanography, University of California, San Diego. We are grateful to Diane Bradshaw and Bevan Hunter for their assistance in naming the New Zealand ice core drill. We would like to thank Barbara Stenni for advice and discussions on the Talos Dome and TALDICE records. We thank two anonymous reviewers to help us make important improvements to this paper. This work is a contribution to the Roosevelt Island Climate Evolution (RICE) Program, funded by national contributions from New Zealand, Australia, Denmark, Germany, Italy, the People’s Republic of China, Sweden, the UK and the USA. Logistics support was provided by Antarctica New Zealand (K049) and the US Antarctic Program.
Edited by: Hugues Goosse
Reviewed by: two anonymous referees
References
Abraham, J. P., Baringer, M., Bindoff, N. L., Boyer, T., Cheng, L. J., Church, J. A., Conroy, J. L., Domingues, C. M., Fasullo, J. T., Gilson, J., Goni, G., Good, S. A., Gorman, J. M., Gouretski, V., Ishii, M., Johnson, G. C., Kizu, S., Lyman, J. M., Macdonald, A. M., Minkowycz, W. J., Moffitt, S. E., Palmer, M. D., Piola, A. R., Reseghetti, F., Schuckmann, K., Trenberth, K. E., Velicogna, I., and Willis, J. K.: A review of global ocean temperature observa-tions: Implications for ocean heat content estimates and climate change, Rev. Geophys., 51, 450–483, 10.1002/rog.20022, 2013. Abram, N. J., Mulvaney, R., Vimeux, F., Phipps, S. J., Turner, J., and
England, M. H.: Evolution of the Southern Annular Mode during the past millennium, Nat. Clim. Change, 4, 564–569, 2014. Allan, R. J., Nicholls, N., Jones, P. D., and Butterworth, I. J.: A
Fur-ther Extension of the Tahiti-Darwin SOI, Early ENSO Events and Darwin Pressure, J. Climate, 4, 743–749, 10.1175/1520-0442(1991)004<0743:afeott>2.0.co;2, 1991.
Anderson, R. F., Ali, S., Bradtmiller, L. I., Nielsen, S. H. H., Fleisher, M. Q., Anderson, B. E., and Burckle, L. H.: Wind-Driven Upwelling in the Southern Ocean and the Deglacial Rise in Atmospheric CO2, Science, 323, 1443–1448,
https://doi.org/10.1126/science.1167441, 2009.
Arblaster, J., Meehl, G., and Karoly, D.: Future climate change in the Southern Hemisphere: Competing effects of ozone and greenhouse gases, Geophys. Res. Lett., 38, L02701, https://doi.org/10.1029/2010GL045384, 2011.
Bakker, P., Clark, P. U., Golledge, N. R., Schmittner, A., and We-ber, M. E.: Centennial-scale Holocene climate variations am-plified by Antarctic Ice Sheet discharge, Nature, 541, 72–76, https://doi.org/10.1038/nature20582, 2017.
Bertler, N. A. N., Barrett, P. J., Mayewski, P. A., Fogt, R. L., Kreutz, K. J., and Shulmeister, J.: El Niño sup-presses Antarctic warming, Geophys. Res. Lett., 31, L15207, https://doi.org/10.1029/2004GL020749, 2004.