HAL Id: hal-00546703
https://hal.archives-ouvertes.fr/hal-00546703
Submitted on 15 Dec 2010
HAL is a multi-disciplinary open access
archive for the deposit and dissemination of
sci-entific research documents, whether they are
pub-lished or not. The documents may come from
teaching and research institutions in France or
abroad, or from public or private research centers.
L’archive ouverte pluridisciplinaire HAL, est
destinée au dépôt et à la diffusion de documents
scientifiques de niveau recherche, publiés ou non,
émanant des établissements d’enseignement et de
recherche français ou étrangers, des laboratoires
publics ou privés.
Tracking an ion complexing agent within bilayers
Amélie Banc, P. Bauduin, Olivier Diat
To cite this version:
Amélie Banc, P. Bauduin, Olivier Diat. Tracking an ion complexing agent within bilayers. Chemical
Physics Letters, Elsevier, 2010, 494 (4-6), pp.301-305. �10.1016/j.cplett.2010.05.087�. �hal-00546703�
A. Banc and P. Bauduin and O. Diat1
1Institut de Chimie S´eparative de Marcoule, UMR 5257
(CEA/CNRS/UM2/ENSCM), BP 17171, 30206 Bagnols sur C`eze, France
In this Letter, we show the benefit of using a lyotropic lamellar phase as a self assembled model system to investigate the distribution of a lipophilic molecule at a hydrophilic/hydrophobic interface. For complexing agents used for ion transfer in liquid/liquid extraction it is essential to determine their interfacial activity. Coupling scattering and spectrometry techniques, we show that it is possible to determine accurately the amount of this type of molecule at the interface.
INTRODUCTION
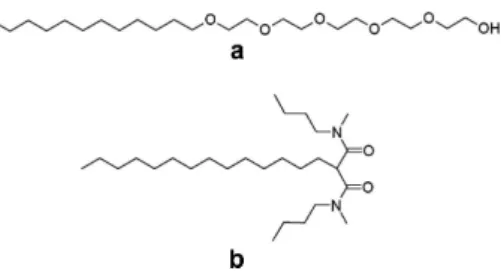
Investigation of localization, partitioning and orienta-tion of molecules (small molecules [1], peptides [2], mem-brane proteins [3]...) inserted into bilayers is ubiqui-tous in membrane related phenomena, especially for bi-ological issues. Vesicles and lyotropic lamellar phases (Lα) are good model systems for membrane and are usually probed by various techniques such as NMR [1], fluorescence quenching [4], ATR-FTIR [5], X-ray scat-tering [6], molecular dynamics [7] etc. The advantage of Lα is the ability to confine host molecules into nu-merous stacked bilayers at the thermodynamic equilib-rium and among which the interactions are very sen-sitive to weak effects [8]. Herein, we precisely char-acterize the insertion of a lipophilic complexing agent within a lamellar phase of surfactant using a simple combination of polarized light microscopy, X-ray scat-tering and µ-Raman spectroscopy experiments. This first study will allow later to track the complexing agent within the organic components as a function of interacting ions diluted in the aqueous phase. The host molecule here is N1, N3-dimethyl-N1, N3 -dibutyl-2-tetradecylmalonamide (DMDBTDMA), generally stud-ied as extractant to separate minor actinides from high level radioactive liquid wastes by liquidliquid extraction processes in the nuclear industry [9]. The lamellar phase is made with a non-ionic surfactant (to get a neutral host system for future studies with interacting ions) taken in the alkyl poly(ethylene oxide) series, pentaethyleneglycol dodecyl ether (C12E5) (Fig.1). C12E5 is a well-known surfactant which forms a fluid lamellar phase at room temperature [10, 11]. This liquidcrystalline system was formulated with the aim to study the interfacial behav-ior of DMDBTDMA which is, at present, insufficiently known to develop precise predictive models of the sol-vent extraction process [12, 13]. The evolution of the lamellar phase boundary within the phase diagram, as well as the lamellar structural parameters were analyzed and confirm the insertion of extractants into membranes. Then, for the first time, µ-Raman experiments were per-formed on oriented lamellar phase domains to probe the orientation of the confined host molecules. The whole re-sult enables to identify and quantify equilibrium between
FIG. 1: Molecular structures of C12E5(a) and DMDBTDMA
(b).
extractants involved in the interfacial activity and those embedded within bilayers as an oily component.
EXPERIMENTAL SECTION
C12E5 was obtained from NIKKO Ltd. (high purity grade > 99%) and used as received. DMDBTDMA was obtained from PANCHIM and was purified on an alumina column to eliminate traces of surface active impurities. LiNO3(1 M) solution was prepared using ultrapure water (resistivity 18.2 MΩ cm) and LiNO3 salt (reagent grade) from Sigma. Samples were formulated adding the salted solution to a premix of C12E5and DMDBTDMA. Sample were homogenised with a succession of centrifugations and were left several days at 25◦C to reach equilibrium. SAXS measurements using Mo-radiation (λ = 0.71˚A) were performed on a bench built by XENOCS. The scat-tered beam was recorded using a large online scanner detector (diameter: 345 mm, from MAR Research) lo-cated at 750 mm from the sample stage. A large Q range (2 × 10⁻² to 2.5 ˚A−1) was covered thanks to an off centre detection. The collimation is applied using a 12 : ∞ multilayer XENOCS mirror (for Mo-radiation) coupled to two sets of FORVIS scatterless slits [14] pro-viding a 0.8 × 0.8 mm2 X-ray beam at the sample posi-tion. Pre-analysis of data was performed using FIT2D software, taking into account the electronic background of the detector (the flatfield is homogeneous) and the empty cell subtraction. The scattered intensities are ex-pressed versus the magnitude of scattering vector Q = (4π/λ) sin(θ/2), where λ is the wavelength of incident
2 radiation and θ the scattering angle. Experimental
reso-lution was ∆Q/Q = 0.05.
Microscopic observations were performed on a ZEISS Axio Imager A1m microscope equipped with crossed po-larisers. In order to establish the phase diagrams, tem-perature scan was realised with a stage temtem-perature LINKAM controller.
Raman spectra were recorded at room temperature on a LabRAM Aramis confocal µ-spectrometer from Horiba Jobin Yvon, using a 532 nm laser. An Olympus BX41 microscope equipped with a 50× objective was used to focus the laser beam on oriented domains preliminary located by polarized light microscopy. We carried out a preliminary study of the anisotropy of the Raman ten-sors characteristic of our samples collecting polarized Ra-man spectra of the isotropic components of the sample: the 1 M LiNO3 solution and the preliminary mixture of DMDBTDMA and C12E5 (80/20). Bands associated with isotropic Raman tensors display the same intensity in parallel (VV) and crossed (VH) polarizations contrary to anisotropic ones. We have observed that elongation vibrations (µ) of CH2 (2900 cm−1), OH (around 3400 cm−1), C=O (1647 cm−1), and CO (810 and 840 cm−1) are characterized by anisotropic Raman tensors when at 1300 cm−1, a vibration mode associated to an isotropic Raman tensor is observed. This vibration mode was later used to normalize the intensity of all our spectra after their baseline correction with the spectrometer associ-ated software.
For microscopic observations and acquisition of Raman spectra, flat capillaries (thickness 50 µm or 200 µm) were filled with the samples and sealed on glass slides with a UV curing adhesive (Norland Optical Adhesive 81).
RESULTS AND DISCUSSION Scattering experiment
Mixtures of C12E5/DMDBTDMA (up to 70/30 M) were hydrated with a 1 M brine, to be in the ionic strength range applied in extraction systems [15]. In this work, LiNO3 salt was chosen, being a commonly used anion, and Li+ being a non complexant cation for the extractant. The monophasic lamellar domain for various mixtures was determined as function of C12E5/DMDBTDMA weight fraction (φ) and tempera-ture, using polarized light microscopy. In Fig. 2a, the 80/20 system is compared with the one of the 100/0 also hydrated with 1 M LiNO3, which is similar to the pure C12E5/water system. It appears that the addition of DMDBTDMA shifts the lamellar domain to lower mem-brane fractions and lower temperatures. It is consistent with a modification of the spontaneous curvature of the aggregates towards water. It can be explained with the packing parameter (P) concept [16]. P, which
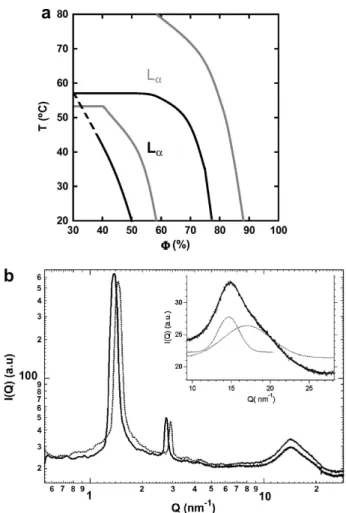
character-FIG. 2: Comparison between C12E5/DMDBTDMA (80/20)
and (100/0) lamellar phases. (a) Identification of the lamel-lar phase domains of the C12E5/DMDBTDMA 80/20 (black
lines) and 100/0 (grey lines) systems. (b) X-ray scatter-ing spectra of the 80/20 (full line) and the 100/0 (dashed line) lamellar phases at C12E5/DMDBTDMA weight fraction
Φ = 70% (inset: decomposition of the wide angle scattering part).
izes the geometry of amphiphilic molecules, is related to the shape of the aggregates formed in water: P = 1 for zero curvature objects like bilayers, P < 1 or >1 for di-rect or reverse aggregates respectively. P value of C12E5 is very sensitive to the hydration of polar heads and is modulated with temperature and concentration [10]. On the other hand, DMDBTDMA which is not soluble in wa-ter, and display a small polar head, is characterized by P > 1. Increasing the amount of extractant molecules, bi-layers aggregates are formed at higher water content than for the reference, which is consistent with the localization of DMDBTDMA within the bilayers.
The lamellar phases were characterized by X-ray scat-tering. Spectra (Fig. 2b) display the first and second or-der Bragg peaks at q0and 2q0, characteristic of the lamel-lar phase. Moreover, a wide peak observed at lamel-large Q-vector is analyzed using two GAUSSIAN signals roughly
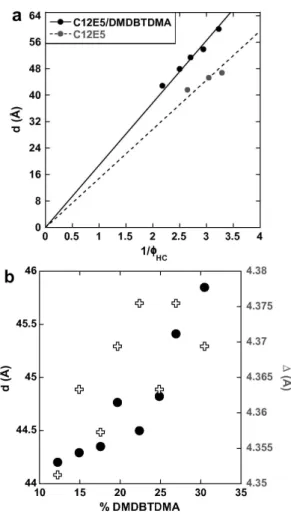
FIG. 3: (a) Dilution laws of C12E5/DMDBTDMA 80/20 and
100/0 systems fitted according to Eq. (1). The range of ΦHC is fixed by the stability phase boundaries and shows
that the lamellar phase containing the extractant molecule can be slightly more diluted. (b) Evolution of the lamellar periodicity (full dots) and the characteristic distance of the bilayer liquid order (empty crosses) versus the molar percent-age of DMDBTDMA into the bilayers of a lamellar phase at Φ = 70%.
centered at qw= 19.8 nm−1and qb= 14.4 nm−1 (see in-set of Fig. 2b). Both contributions can be assigned to the correlation distances characteristic of the liquid order in the aqueous phase [17], and within the bilayers [18, 19], respectively. The former is constant whatever the dilu-tion. Defining d the periodicity of the lamellar phase ob-tained with the position of Bragg peaks d = 2Π/q0, ΦHC the volume fraction of DMDBTDMA and alkyl chains of C12E5into the sample, and δHC the hydrocarbon thick-ness of bilayers, Fig. 3a displays the evolution of lamellar periodicities as a function of the inverse of ΦHC. As poly-oxyethylene groups were considered to be in the aqueous region of the phase [20], we fitted our data using the fol-lowing dilution law:
d = δHCΦHC (1) For calculations we used the following density values:
dC12 = 0.803 [21], dC12E5 = 0.963 (from supplier) and dDM DBT DM A= 0.906 (measured). We can observe that the variation of lamellar periodicity d is not perfectly lin-ear for the pure C12E5as a function of 1/ΦHC. This was previously observed [22] and was attributed to a change in the bilayer thickness with dilution [23]. This can have different origins (evolution of polyoxyethylene heads con-formation [24], interpenetration of alkyl chains [22], de-fects [25], ). For the C12E5/DMDBTDMA 80/20 system, the evolution of d appears more linear than for the 100/0 system. It attests to a more classical behavior of the dilu-tion law characterizing a lamellar phase with a constant thickness of the bilayers and weak bilayer undulations. Slopes of the linear fits in Fig. 3 indicate the average hy-drocarbon bilayer thicknesses: δHC = 14.0 ˚A for C12E5 (100/0), and δHC = 18.8 ˚A for C12E5 /DMDBTDMA 80/20. The polar head area of C12E5 deduced from the geometrical relationship AC12E5 = 2.VHC/δHC is 50.1 ˚
A2/molecule, which is consistent with the data from the literature [26]. On Fig. 3b, the increase in the lamellar periodicity and in the averaged distance within the bilay-ers (∆ = 2Π/qb) with the extractant molar fraction are displayed for Φ = 70 %. Both evolutions confirm the in-sertion of DMDBTDMA into the bilayers. The ∆ values range from that of pure surfactant (∆S = 4.35˚A) towards that of pure extractant (∆E = 4.58˚A) in their liquid state, respectively. Preliminary cryo-microscopic obser-vations and temperature variation [27, 28] studies con-firming also that no topological defects have to be taken into account along a dilution of our lamellar phase, the lamellar periodicity values were directly converted into hydrocarbon bilayer thicknesses using the dilution law (see Equation.2). Assuming a constant polar area per molecule at the hydrophilic/hydrophobic interface and an ideal mixing of both amphiphilic species the bilayer thickness can be expressed as a function of the reparti-tion of extractant molecules between the interface and the aliphatic part of the bilayer:
δHC = V A = 2 (1 − x)VC12+ xVDM DBT DM A (1 − x)AC12E5+ xκADM DBT DM A (2)
with Vi molecular volumes determined from density values, Ai polar head areas (AC12E5 = 50˚A
2
/molecule, ADM DBT DM A= 100˚A
2
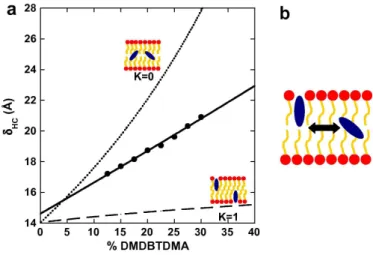
/molecule [13, 29]), x the molar fraction of DMDBTDMA among the organic components and K the fraction of DMDBTDMA participating to the interfacial area. Two extreme cases are plotted on Fig. 4:
(i) K = 0, the extractant molecules are considered as buried within the bilayer and a significant increase in the bilayer thickness is expected.
(ii) K = 1, all extractant molecules participate to the in-terfacial area and a weak increase in the bilayer thickness should be observed.
4
FIG. 4: (a) Evolution of the hydrocarbon bilayer thickness δHC versus the molar percentage of DMDBTDMA within
the bilayers: the dotted and dashed lines display the models considering extractant molecules buried in the bilayer and at the interface of the bilayer, respectively. The experimental data (large dots), are fitted using Eq. 2. (b) Scheme of the equilibrium model proposed to adjust our data.
A good adjustment of our data requires K = 0.44 and AC12E5 = 48˚A
2
/molecule. It validates our equilibrium model and indicates that 44% of extractant molecules are localized at interfaces whatever the ratio within the lamellar phase.
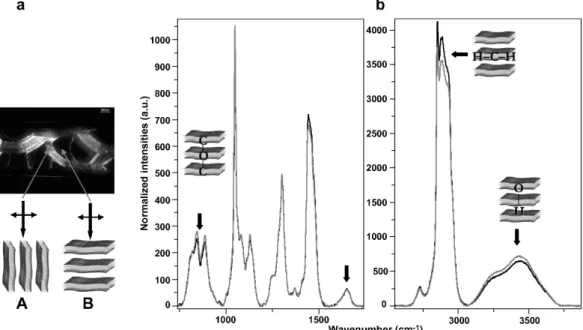
µ-Raman experiments
In order to reinforce the model described in Eq. 2, we performed polarized µ-Raman experiments on oriented domains of lamellar phases to qualitatively characterize the orientation of molecules. Planar and homeotrope oriented domains were localized by polarized light mi-croscopy (see Fig. 5a) and their Raman spectra were obtained using the naturally polarized laser beam of the spectrometer (see Fig. 5). We simultaneously analyzed the stretching vibrations of OH groups between 3100 and 3700 cm−1, the stretching modes of CH2 and CH3 around 2900 cm−1, the characteristic bands of oxyethy-lene groups at 810 and 840 cm−1 [30], and the carbonyl stretching vibration at 1647 cm−1 [31]. Considering that the Raman signal is maximum for Raman tensors ori-ented parallel to the polarization of the incident laser beam [32], we measured different intensities as a func-tion of the orientafunc-tion of the lamellar phase. We found out that the orientation of OH and oxyethylenes bonds is preferentially in the direction perpendicular to the bilay-ers whereas the CH2and CH3tensors are oriented in the plane of the membrane. These orientations are consistent with the normal orientation of the surfactant molecules within the bilayers as expected. However, the carbonyl
band from the polar head of the extractant molecules has the same intensity whatever the orientation of the system. It indicates that the orientation distribution of the carbonyls bonds is isotropic into the system. This is in accordance with the model of equilibrium for which half part of extractant molecules behave as oil, without preferential orientation within the bilayers.
CONCLUSION
In summary, we identified and characterized a mixed lamellar phase which allows us to investigate interfacial properties of extractant molecules (weak amphiphiles by definition that can play the role of co-surfactants). Re-sults indicate that the insertion of DMDBTDMA in a C12E5bilayer induces a decrease in the spontaneous cur-vature of the interface, by establishing equilibrium of ex-tractant molecules within the bilayer: roughly, half of the extractant is buried within the organic part in the membrane, whereas the other half is adsorbed at the bilayer/water interface. As we demonstrate that this type of lyotropic lamellar phase is a good support sys-tem for tracking a complexing extractant molecule at a liquid/liquid interface, further works are currently in progress to study the effect of ion complexation reaction on the interfacial properties. Moreover, we think that the approach developed in this Letter is not only inter-esting in the extraction field but in a more general way to study partitioning of hydrophobic molecules (cholesterol, drugs, . . .) inserted into bilayers.
ACKNOWLEDGEMENTS
We would like to thank Pr. T. Zemb for fruitful and stimulating discussions, Bruno CORSO for his assistance in SAXS experiments and Dr. R. Leparc for preliminary measurements in polarized Raman spectroscopy. This work was supported by the European ACSEPT network.
[1] H.A. Scheidt and D. Huster. The interaction of small molecules with phospholipid membranes studied by 1H NOESY NMR under magic-angle spinning1. Acta Phar-macologica Sinica, 29(1):35–49, 2008.
[2] T.J. McIntosh. The 2004 Biophysical Society-Avanti Award in Lipids address: roles of bilayer structure and elastic properties in peptide localization in membranes. Chemistry and physics of lipids, 130(2):83–98, 2004. [3] J.A. Killian. Hydrophobic mismatch between proteins
and lipids in membranes. Biochimica et Biophysica Acta (BBA)-Reviews on Biomembranes, 1376(3):401– 415, 1998.
[4] S.D. Zucker, W. Goessling, E.J. Bootle, and C. Sterritt. Localization of bilirubin in phospholipid bilayers by
par-FIG. 5: µ-Raman spectroscopy performed on oriented lamellar phases. (a) Identification of oriented domains by polarized light microscopy. Spectra are performed on two kinds of configurations: (A) with the laser beam polarization oriented perpendicular to the bilayers, on planar domains and (B) with the laser beam polarization oriented parallel to the bilayers, on homeotropic domains. (b) Raman spectra of the C12E5/DMDBTDMA 80/20 oriented lamellar phase for configurations A (grey line) et B
(black line).
allax analysis of fluorescence quenching. Journal of Lipid Research, 42(9):1377, 2001.
[5] I. Martin, E. Goormaghtigh, and J. M. Ruysschaert. At-tenuated total reflection ir spectroscopy as a tool to in-vestigate the orientation and tertiary structure changes in fusion proteins. Biochimica et Biophysica Acta (BBA) - Biomembranes, 1614(1):97 – 103, 2003. Membrane Fu-sion.
[6] EZ Radlinska, T. Gulik-Krzywicki, F. Lafuma, D. Langevin, W. Urbach, and CE Williams. Modi-fication of the lamellar phase in C12E5/water system by a random hydrophilic-hydrophobic polyelectrolyte. Journal de Physique II, 7(10):1393–1416, 1997.
[7] R. Vijayan and P.C. Biggin. A Steroid in a Lipid Bilayer: Localization, Orientation, and Energetics. Biophysical journal, 95(7):L45–L47, 2008.
[8] A. Aroti, E. Leontidis, M. Dubois, and T. Zemb. Effects of monovalent anions of the Hofmeister series on DPPC lipid bilayers part I: swelling and in-plane equations of state. Biophysical journal, 93(5):1580–1590, 2007. [9] K.L. Nash and G.J. Lumetta. Advanced Separation
Tech-niques for Nuclear Fuel Reprocessing and Radioactive Waste Treatment. 2010.
[10] D.J. Mitchell, G.J.T. Tiddy, L. Waring, T. Bostock, and M.P. McDonald. Phase behaviour of polyoxyethylene surfactants with water. Mesophase structures and par-tial miscibility (cloud points). Journal of the Chemical Society, Faraday Transactions 1, 79(4):975–1000, 1983. [11] R. Strey, R. Schom
”acker, D. Roux, F. Nallet, and U. Olsson. Dilute lamel-lar and L3 phases in the binary water-C12E5 system. J. Chem. Soc. Faraday Trans, 86:2253–2261, 1990.
[12] J. Szymanowski. Kinetics and interfacial phenomena. Solvent Extraction and Ion Exchange, 18(4):729–751,
2000.
[13] C. Erlinger, D. Gazeau, T. Zemb, C. Madic, L. Lefran¸cois, M. Hebrant, and C. Tondre. Ef-fect of nitric acid extraction on phase behavior, mi-crostructure and interactions between primary aggre-gates in the system dimethyldibutyltetradecylmalon-amide (DMDBTDMA)/n-dodecane/water: a phase anal-ysis and small angle x-ray scattering (SAXS) charac-terisation study. Solvent Extraction and Ion Exchange, 16(3):707–738, 1998.
[14] Y. Li, R. Beck, T. Huang, M.C. Choi, and M. Divinagra-cia. Scatterless hybrid metal-single-crystal slit for small-angle X-ray scattering and high-resolution X-ray diffrac-tion. Journal of Applied Crystallography, 41(6):1134– 1139, 2008.
[15] G.Y.S. Chan, M.G.B. Drew, M.J. Hudson, P.B. Iveson, J.O. Liljenzin, M. Sk˚alberg, L. Spjuth, and C. Madic. Solvent extraction of metal ions from nitric acid solu-tion using N, N-substituted malonamides. Experimen-tal and crysExperimen-tallographic evidence for two mechanisms of extraction, metal complexation and ion-pair formation. Journal of the Chemical Society, Dalton Transactions, 1997(4):649–660, 1997.
[16] J.N. Israelachvili, D.J. Mitchell, and B.W. Ninham. The-ory of self-assembly of hydrocarbon amphiphiles into mi-celles and bilayers. Journal of the Chemical Society, Fara-day Transactions 2, 72:1525–1568, 1976.
[17] G. Hura, J.M. Sorenson, R.M. Glaeser, and T. Head-Gordon. A high-quality x-ray scattering experiment on liquid water at ambient conditions. The Journal of Chem-ical Physics, 113:9140, 2000.
[18] T.T. Mills, S. Tristram-Nagle, F.A. Heberle, N.F. Morales, J. Zhao, J. Wu, G.E.S. Toombes, J.F. Nagle, and G.W. Feigenson. Liquid-liquid domains in bilayers
6
detected by wide angle x-ray scattering. Biophysical jour-nal, 95(2):682–690, 2008.
[19] T.T. Mills, G.E.S. Toombes, S. Tristram-Nagle, D.M. Smilgies, G.W. Feigenson, and J.F. Nagle. Order param-eters and areas in fluid-phase oriented lipid membranes using wide angle x-ray scattering. Biophysical journal, 95(2):669–681, 2008.
[20] S.S. Funari and G. Rapp. X-ray Studies on the C12EO2/Water System. J. Phys. Chem. B, 101(5):732– 739, 1997.
[21] C. Tanford. Micelle shape and size. The Journal of Phys-ical Chemistry, 76(21):3020–3024, 1972.
[22] E. Kurtisovski, N. Taulier, R. Ober, M. Waks, and W. Urbach. Molecular origin of model membrane bend-ing rigidity. Physical review letters, 98(25):258103, 2007. [23] E. Ruckenstein and M. Manciu. On the stability of ly-otropic lamellar liquid crystals and the thicknesses of their lamellae. Langmuir, 17(18):5464–5475, 2001. [24] A. Tonegawa, K. Ohno, H. Matsuura, K. Yamada, and
T. Okuda. A Combined Raman and Deuterium NMR Spectroscopic Study on the Molecular and Phase Struc-ture of a Nonionic Surfactant C12E5- Water System. J. Phys. Chem. B, 106(51):13211–13223, 2002.
[25] S.S. Funari, M.C. Holmes, and G.J.T. Tiddy. Intermedi-ate lyotropic liquid crystal phases in the C16EO6/wIntermedi-ater system. The Journal of Physical Chemistry, 98(11):3015– 3023, 1994.
[26] M.J. Rosen, A.W. Cohen, M. Dahanayake, and X.Y. Hua. Relationship of structure to properties in surfac-tants. 10. Surface and thermodynamic properties of
2-dodecyloxypoly (ethenoxyethanol) s, C12H25 (OC2H4) xOH, in aqueous solution. The Journal of Physical Chem-istry, 86(4):541–545, 1982.
[27] O. Dhez, S. K
”onig, D. Roux, F. Nallet, and O. Diat. Lamellar-to-nematic phase transition in a lipid-surfactant mixture. The European Physical Journal E: Soft Matter and Bio-logical Physics, 3(4):377–388, 2000.
[28] P. Moreau, L. Navailles, J. Giermanska-Kahn, O. Mondain-Monval, F. Nallet, and D. Roux. Dislocation-loop-mediated smectic melting. EPL (Europhysics Letters), 73:49, 2006.
[29] P. Bauduin, F. Testard, L. Berthon, and T. Zemb. Rela-tion between the hydrophile/hydrophobe ratio of malon-amide extractants and the stability of the organic phase: investigation at high extractant concentrations. Physical Chemistry Chemical Physics, 9(28):3776–3785, 2007. [30] V.S. Marinov, Z.S. Nickolov, and H. Matsuura.
Ra-man Spectroscopic Study of Water Structure in Aque-ous Nonionic Surfactant Solutions. J. Phys. Chem. B, 105(41):9953–9959, 2001.
[31] V.A. Shashilov, V.V. Ermolenkov, T.G. Levitskaia, and I.K. Lednev. Metal ion binding by a bicyclic diamide: Deep UV Raman spectroscopic characterization. J. Phys. Chem. A, 109(32):7094–7098, 2005.
[32] M. Tanaka and RJ Young. Review Polarised Raman spectroscopy for the study of molecular orientation dis-tributions in polymers. Journal of Materials Science, 41(3):963–991, 2006.