HAL Id: hal-00089802
https://hal-insu.archives-ouvertes.fr/hal-00089802
Submitted on 28 Sep 2006
HAL is a multi-disciplinary open access archive for the deposit and dissemination of sci-entific research documents, whether they are pub-lished or not. The documents may come from teaching and research institutions in France or abroad, or from public or private research centers.
L’archive ouverte pluridisciplinaire HAL, est destinée au dépôt et à la diffusion de documents scientifiques de niveau recherche, publiés ou non, émanant des établissements d’enseignement et de recherche français ou étrangers, des laboratoires publics ou privés.
In situ high-pressure and high-temperature bubble
growth in silicic melts
Caroline Martel, Hélène Bureau
To cite this version:
Caroline Martel, Hélène Bureau. In situ high-pressure and high-temperature bubble growth in sili-cic melts. Earth and Planetary Science Letters, Elsevier, 2001, 191, pp.115-127. �10.1016/S0012-821X(01)00407-1�. �hal-00089802�
In situ high-pressure and high-temperature bubble growth
in silicic melts
Caroline Martel a, and Hélène Bureau a, b
a Bayerisches Geoinstitut, Universität Bayreuth, D-95440, Bayreuth, Germany – Present
Adress – UMR6113 - ISTO
b LPS-CEA/CNRS-CE Saclay, F-91191, Gif-sur-Yvette, France
Abstract
We present the first investigation of in situ high-pressure and high-temperature bubble growth in silicic melts. In a hydrothermal diamond-anvil cell, a haplogranite melt (79 wt% SiO2) is
hydrated then subjected to cooling and decompression. With decreasing pressure, water exsolves from the melt and bubbles grow. The whole experiment is observed through an optical microscope and video-recorded, so that bubble nucleation, bubble growth, and the glass transition are directly monitored. Bubbles nucleate and expand in melt globules having radii from 15 to 70 μm. Bubbles reached 3.6–9.1 μm in radius within 6.1–11.7 s (until the glass transition is attained) while temperature decreases from 709–879°C to 482–524°C, corresponding to decompressions from 7.0–21.9 to 3.4–15.2 kbar. Bubbles nucleated either in a single event occurring within the first second or in successive pulses over a period of up to 7 s when the melt globules are in contact with a diamond culet of the cell. In these experiments, bubble growth can be fitted to the cube root or a logarithm of time, mainly ascribable to the combination of large water oversaturations due to rapid cooling and decompression. At pressures of 3.4–15.2 kbar, we measure glass transition temperatures that are 20–80°C higher than those calculated at atmospheric pressure.
Author Keywords: Author Keywords: bubbles; high pressure; high temperature; growth
1. Introduction
Magma degassing occurs during volcanic eruptions due to the exsolution of the volatiles dissolved in the melt at depth. This results from the decrease of the volatile solubility in melts with decreasing pressure [1]. Bubbles grow by diffusion of the volatiles dissolved in the melt through the melt–vapor interface and by gas expansion as pressure decreases. These processes drastically change the physical and chemical properties of the magmas, the flow properties within the conduit, and therefore the ascent rates that finally control the eruption regime. Therefore, much effort has been devoted to understand the dynamics of bubble growth in magmas in order to model volcanic eruptions.
Bubble growth models have evolved from the consideration of a single bubble expanding in a superheated infinite one-phase system [2] to many identical cells of one bubble surrounded by melt, in which the bubble grows from a volatile-oversaturated melt at constant pressure and temperature [3, 4 and 5] or under decompression [3, 5, 6 and 7]. Theoretical results are obtained by solving equations of volatile diffusion in the melt, viscous deformation of the melt, and mass balance of volatiles at the bubble interface. At constant pressure and temperature and for relatively long durations, models predict that bubble growth is proportional to a square root of time mainly controlled by the volatile diffusivity in the melt. Theoretical models have been experimentally tested at atmospheric pressure under increasing temperature using heating stage devices [8, 9 and 10]. These in situ methods allow the direct observation of the process of bubble growth and enable the precise observation of the timescale of vesiculation. However, these experiments better simulate bubble growth in domes (under cooling at constant pressure) than during magma ascent in the conduit (under decompression at nearly constant temperature). To better simulate bubble growth in ascending magmas, experiments have been performed in rapid-quench autoclaves, in which bubbles nucleate at constant pressure and temperature from an oversaturated rhyolitic melt [11 and 12] or under controlled decompression [13]. After quench, bubble sizes and number density are measured. Although the procedure better compares with natural process, it is not an in situ observation and does not allow the monitoring of the entire vesiculation process.
Here, we present the first in situ high-pressure and high-temperature study of bubble growth in silicic melts using a hydrothermal externally heated diamond-anvil cell. The procedure allows us to observe and measure the timescales of bubble nucleation, bubble growth, and the glass transition that can be compared to theoretical and analytical models.
2. Materials and methods
2.1. Starting materialsThe starting material is a synthetic bubble-free haplogranite glass (HPG8, SiO2: 78.6, Al2O3:
12.5, Na2O: 4.6, K2O: 4.2 wt%, microprobe analyses). This glass was synthesized by fusing a
mixture of dry powders of Si and Al oxides with Na and K carbonates at 1400–1675°C and 1 atm. The fused batches were loaded into a box furnace and stirred until it becomes homogeneous and devoid of bubbles. In order to enhance the further hydration in the diamond-anvil cell, we started with pre-hydrated glasses. This pre-hydration was performed by sealing the required amount of HPG8 glass powder and distilled water into Pt capsules and annealing it for 6 days at 1000°C and 3 kbar (Institut für Mineralogie, Hannover, Germany).
The water content of the hydrated glass was measured by Fourier transform infrared spectroscopy at 2.4 wt%. Thin fragments of glass were crushed to the size corresponding to the sample chamber (<100 μm thick, 300 μm Ø).
2.2. Experiments
Bubble nucleation and growth are observed in situ at high pressures and high temperatures in a modified Bassett-type hydrothermal diamond-anvil cell [14 and 15]. In this cell, the sample is contained in a hole bored in the center of a rhenium gasket, compressed by two type-I diamonds of 0.21 carat with 1 mm flats. Heating is achieved by passing a high electrical current through molybdenum wires around tungsten carbide seats holding the diamonds. During the entire experiment, an Ar–H2 gas mixture (2 vol% H2) is introduced into the cell to
prevent oxidation of the diamonds and the molybdenum heater. The temperature is measured by two thin wire K-type thermocouples attached to the diamonds. The temperature in the sample chamber is calibrated against these thermocouples by measuring the melting points of NaNO3, CsCl, NaCl, sulfur, and ice in the cell at room pressure. The calibration curve has a
standard error of ±2°C. Temperatures may be measured every 0.1 s.
Pressures at any given temperature may be computed from the equation of state of water [16 and 17] and the knowledge of its density at a known temperature. The pressure estimation during the experiments is based on the fact that the sample cavity is filled with water and remains of constant volume on cooling [14 and 15]. In order to stabilize the volume of the sample chamber during cooling, the hole of the gasket was first filled with water and an air bubble to give the desired bulk density and cycled through the relevant temperature range several times, until the homogenization temperature of the fluid becomes virtually constant. The initial sample chamber diameter is 500 μm. During gasket stabilization this diameter is reduced to about 400 μm, and then diminishes progressively during the successive experiments until the available volume becomes too small for good observation. This is due to the fact that during heating, the metal gasket softens and yields under the force applied to the diamonds. Variations in the volume of the sample cavity modify the density of the fluid (which becomes higher for each heating–cooling cycle), so that pressure increases with successive experiments.
For an experiment, the cell is loaded with the sample (pieces of glass), water and an air bubble and heated to the desired temperature. The water density prevailing during the experiment is calculated [18] by measuring the homogenization temperature of the air bubble after cooling (100–200°C). At these low temperatures, we assume that the fluid has properties similar to pure water, based on the low solubility of silicate glasses in water at these conditions [19]. This density is used for pressure calculation at the run conditions [16 and 17]. The error on the calculated pressure is estimated to be maximum ±2 kbar.
3. Results
3.1. Progress of the experiment
The whole experiment can be described in the following steps. The first step is the melting of the glass fragments and their hydration at a given temperature, which defines the pressure and therefore the melt water content (both calculated at the conclusion of the experiment). Once globules of silicate melts have equilibrated with the aqueous phase at the chosen maximum
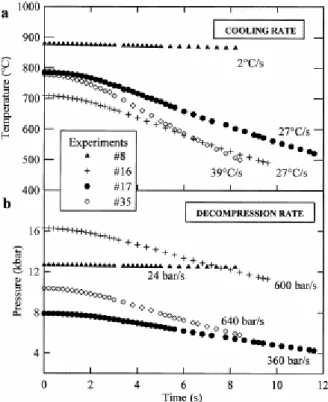
temperature, we switch off the power of the heater (corresponding to TIME=0 s), causing a non-linear cooling rate of 2–8°C/s during the first second to 32°C/s after 2 s. This cooling induces decompression rates of 300–600 bar/s. For one experiment (#8), cooling was manually controlled (without switching off the furnace) at a rate of 2°C/s, giving a decompression rate of 24 bar/s (Fig. 1). Because water solubility decreases with decreasing pressure and temperature [1] in this second step, water exsolves from the melt. Water exsolution is physically observed by bubble nucleation in the melt globules. As temperature and pressure both decrease, these bubbles grow until the glass transition temperature is reached (except for experiment #8) marking the end of the experiment. As the experiments are video-recorded, together with temperature and time, the processes and the timescales of bubble nucleation, bubble growth, and glass transition are precisely observed and the bubble sizes may be measured on frame-captured images every 0.2 s using an image analysis software. Very few bubbles (zero to five, usually only one) can be satisfactorily measured per experiment due to the limitation of the focus of the microscope. Indeed, the focus (fixed during the decompression) gives us a thin layer through the whole volume of the sample chamber, and therefore a small number of bubbles. Among these potentially measurable bubbles, we have to rule out the coalescing bubbles and the moving bubbles that go out of focus. The experimental conditions are reported in Table 1.
Initial temperatures range from 709 to 879°C and corresponding water pressures are between 7.0 and 21.9 kbar [16]. We calculated the water contents in the melt after the model of [20], which is valid for haplogranite compositions at temperatures of 500–1350°C and pressures up to 8 kbar. This model requires water fugacities that we calculated after [21]. We extrapolated the calculation of [20] for pressures higher than 8 kbar (up to 22 kbar). This may be justified as we compute an initial water content of 22±3 wt% for experiment #15 (750°C, 15.5 kbar) which is in good agreement with the 26±8 wt% determined in situ by infrared spectroscopy measurements using the same diamond-anvil cell, for a haplogranite composition, at pressure and temperature conditions similar to our experiment #15 [22].
Fig. 1. Cooling rates (a) and corresponding decompression rates (b) of four selected experiments.
3.2. Bubble nucleation
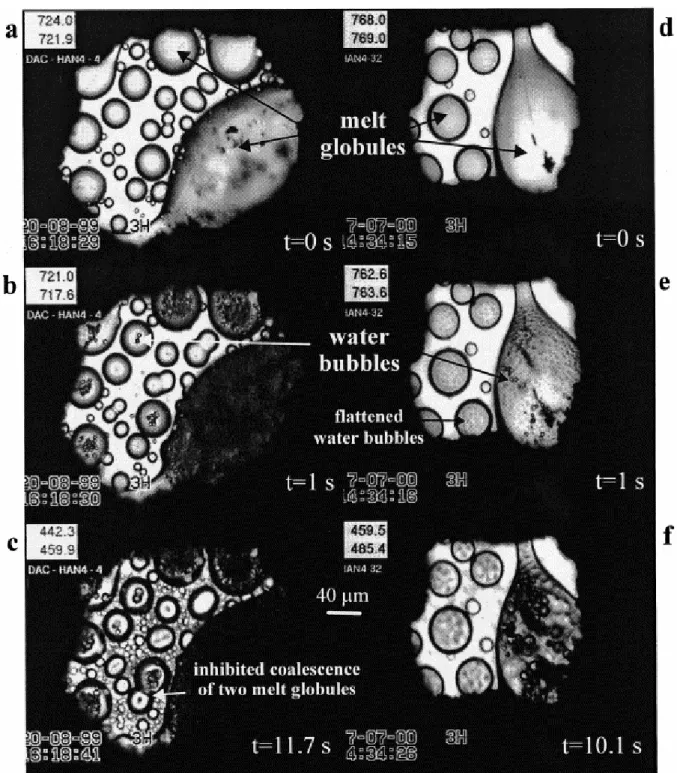
Bubbles nucleated in crystal-free melt globules of radius sizes from 20 to 70 μm (Fig. 2). No nucleation occurred in melt globules below 15 μm in radius and within the outer rim of 10–22 μm of larger globules. We observe two different types of bubble nucleation, an intrinsic mode where bubbles nucleate at random within the melt globules and an extrinsic mode where bubbles nucleate at diamond–melt interfaces when globules touch the culets. Intrinsic nucleation prevails for initial pressures >9.5 kbar (Table 1) and can be delayed up to 1 s, depending on the size of the melt globule. For instance in experiment #27, at t=0.2 s, the first bubbles occur in the two globules with radii >50 μm, followed by nucleation in the 39 μm radius globule at 0.6 s, the last bubbles occurring in the 34 μm globule at 1.0 s. We emphasize here that only one nucleation event occurs per melt globule, leading to round bubbles. The extrinsic nucleation mode is restricted to initial pressures <9.5 kbar and leads to many flattened (non-measurable) bubbles that are actually hemispheres wetted on the lower-diamond culet. This main nucleation event is followed by further intrinsic nucleations (giving measurable round bubbles) within the same melt globule occurring over periods up to 7 s (Fig. 2e,f; Table 1). This type of nucleation is particularly well illustrated in experiment #31 (the lowest initial pressure), in which a late nucleation event occurred at t=5.4 s in a 67 μm radius melt globule, strongly obscuring the observation of the previous bubbles.
Fig. 2. Frame-captured images of experiments #4 (a–c) and #32B (d–f). Top pictures are taken at 0 s time, when the power of the heater was switched off. Melt globules are devoid of crystals and bubbles. The middle pictures are at t=1 s, showing that water exsolved and bubbles grew in the melt globules. The bottom pictures are at the glass transition, after 11.7 and 10.1 s for experiments #4 and #32B, respectively. Temperatures (not corrected) given by the two thermocouples and time appear on each picture on the upper and bottom left corners, respectively. Note that pictures e and f of #32B show flattened water bubbles resulting from the contact between the melt globules and the lower-diamond culet.
3.3. Bubble growth
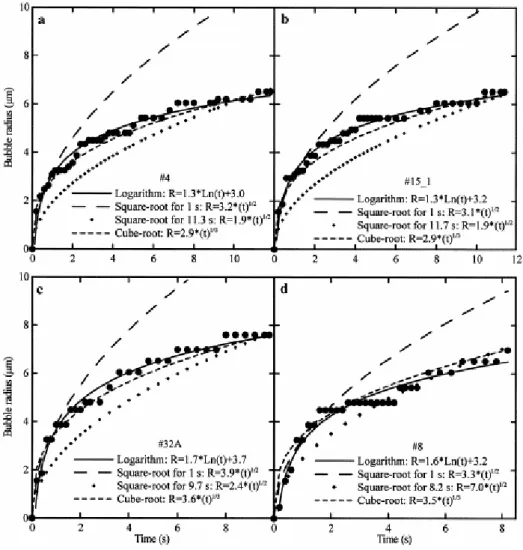
Bubbles expanded during 6.1–11.7 s, reaching radii between 3.6 and 9.1 μm for temperature differences of 192–313°C, corresponding to decompressions of 2.9–6.6 kbar and water losses of 4.7–22.6 wt% (Table 1). The bubble measured in experiment #8 reached 7 μm in radius for a temperature decrease of 12°C, corresponding to a decompression of 0.2 kbar. Comparing bubble sizes in experiments #26 and #32B performed at similar pressure and temperature show that the radius of the melt globule in which the bubble expanded (46 and 60 μm, respectively) has no significant influence on the final bubble radius (8.4 and 8 μm, respectively). At pressures below 10 kbar, bubbles have an average radius of 7.5±1.5 μm, compared to 6.1±0.8 μm above 10 kbar ( Table 1). Fig. 3 displays the measured bubble radius versus time of four selected experiments. Bubble radii seem to expand in steps which length increases with time. Unfortunately, the measurement errors (precision is not better than ±0.3 μm) do not enable us to discern between a step by step and a continuous growth with time. The final radii of the melt globules grew at most 0.5 μm relative to their initial radius (before bubble nucleation).
Fig. 3. Bubble growth. a: Experiment #4; b: experiment #15; c: experiment #32A; d: experiment #8. The plain circles represent the measured bubble radius (±0.3 μm) as a function of time. The logarithm law (plain line) is a fit of these experimental data. The coefficients of the square-root laws are calculated for the bubble radius at 1 s (long-dashed line) and final time (diamonds). The coefficient of the time cube-root law is defined for the bubble radius at the final time (short-dashed line).
We observed little bubble coalescence, mainly occurring at the very first stage of the bubble growth. Little coalescence results from both little bubble movement within the melt and a drastic increase of melt viscosity as temperature drops [23]. Coalesced bubbles were not considered in the measurements.
3.4. Bubble quench – glass transition
Bubbles cease expansion when the melt viscosity reaches a high threshold value at temperatures close to the glass transition temperature (Tg). Visible evidence for achieving
high melt viscosities is the inhibition of the coalescence process between melt globules as illustrated in Fig. 2c. We determined Tg when all bubbles cease growth and movement within
the melt globules, corresponding to temperatures between 482 and 524°C over a water content range of 6.6–8.3 wt% at pressures between 3.4 and 15.2 kbar (Table 1). For a given pressure,
Tg can vary up to 40°C (e.g. at 4.3–4.4 kbar), ascribable to the fact that the glass transition is actually a progressive process occurring over a range of several tens of degrees [24].
4. Discussion
4.1. Bubble nucleationThe lack of bubble nucleation both in melt globules below 15 μm in radius and within an outer rim of 10–22 μm in larger melt globules probably reflects diffusive water escape from the melt into the surrounding water medium. Any further consideration first requires the determination of the initial water diffusivities in the melt. Zhang and Behrens [25] have recently proposed a calculation of the water diffusivity in rhyolitic melts at temperatures between 400 and 1200°C, pressures up to 8.1 kbar and for water contents <8 wt%. Although the initial water contents in our experiments are >12 wt%, we calculated the initial water diffusivity for the five first experiments in Table 1 (for which initial pressures are ≤8.1 kbar) and found values between 8×10⁻⁹ and 4×10⁻⁸ m2/s (#31 and #32A, respectively). These values do not fall in the common range of water diffusivities in rhyolitic melts ( 10−11–10−12 m2/s, [26, 27 and 28]), but are more comparable to those in basaltic melts [26 and 29]. The similarity with water diffusion in basalts also translates to comparable viscosities (initial viscosities <104 Pa s [30], extrapolated for water contents >8 wt%). The combined increase of
water content (>8 wt%) and pressure (>8.1 kbar) would lead to faster diffusivities [25]. We use the simple diffusion equation x2 Dw×t (where x is the distance in m, here the globule radius, Dw the diffusivity in m2/s and t the time in s) to determine how fast water can diffuse
from the melt globules to the surrounding water medium. Water diffusivities of the order of 10−9 m2/s would lead to water depletion in a 15 μm radius melt globule within 0.2 s. This depletion is fast enough to explain the absence of bubble nucleation in globules <15 μm in radius and within the outer 10–20 μm rims of larger globules.
In globules >40 μm in radius, the delay to bubble nucleation is always <0.4 s, which corresponds to decompressions <30 bars. This agrees with the low supersaturation pressures required to initiate heterogeneous nucleation as reported by [12].
The extrinsic nucleation prevailing at pressures <9.5 kbar implies that the melt globules sank down on the diamond. The calculated density contrast between the hydrated melt globules and the water is lower at low than high pressures (melt density [31]−water density [16]=1805 and 2637 kg/m3 at 7.0 and 21.9 kbar for experiments #31 and #5, respectively). This would favor
the flotation of the melt globules at low pressures, in contrast to the observation. We propose that the flotation of the melt globules at high pressures is due to the narrowing of the immiscibility gap between water and melt at the approach of the supercritical conditions that results in a density increase of the fluid by silica enrichment while a density decrease of the melt by water addition. At pressures <9.5 kbar, the melt globules tend to sink (as predicted by the density contrast) and the contact between the diamond and the melt provides a preferential site for bubble nucleation by substantially reducing the theoretical supersaturation pressure. We propose that this localized (extrinsic) nucleation creates gradients in the melt water content, i.e. water enrichment towards the far-field melt relative to the melt at the diamond boundary, so that further successive intrinsic nucleations can take place in the far-field melt as decompression goes on.
4.2. Bubble growth law
While most of the published theory and analytical solutions on bubble growth assume constant temperature and pressure, the processes in our experiments are rather complex, especially because they involve the simultaneous variation of many time-dependent parameters, such as temperature, pressure, and water content (thus, viscosity, density, and diffusivity). Therefore, development of analytical solutions of our bubble growth during cooling-induced decompressions is kept for future purposes. In this section, we compare our experimental bubble sizes with published growth models. Because our experimental conditions are quite remote from near-equilibrium bubble growth we expect that their sizes should remain smaller than equilibrium values. Close to equilibrium, Navon and Lyakhovsky [32] have shown that bubble radii (Req) may be expressed by:
Req3=S03(Cwi−Cw)(ρm/ρw)
where S03=3/(4πNd), in which Nd is the bubble number density (in m−3) per melt globule; Cwi
is the initial water content of the melt (Table 1); Cw the melt water content [20]; ρm and ρw the
density of the hydrated melt [31] and the water in the bubble [16], respectively (the four last parameters being calculated at a given time). The bubbles in experiment #8, for which the decompression rate is only 24 bar/s, presumably grow the closest to equilibrium: at t=5.8 s and t=8.2 s, the calculated Req (counting 40 bubbles in the 70 μm in radius melt globule) is
5.5 and 6.3 μm in comparison to 4.8 and 7.0±0.3 μm, respectively. However, in the experiments where we could determine Nd (with an intrinsic nucleation), measured bubbles
are always smaller than equilibrium sizes. For instance, in experiment #35 (four bubbles in the melt globule of 28 μm in radius), the calculated equilibrium radius at t=3.8 s and t=6.4 s equals 9.0 and 10.7 μm instead of measured radius of 6.0 and 7.0±0.3 μm, respectively (the final equilibrium radius would be 11.3 μm, but the bubble was quenched with 7.6 μm in radius). In experiment #4 (two bubbles in the melt globule of 22 μm in radius), the calculated equilibrium radius at t=3.8 s and t=6.4 s equals 8.9 and 13.2 μm instead of measured radius of 4.8 and 5.4±0.3 μm, respectively. This non-equilibrium degassing is ascribable to both the rapid decompression (299–583 bar/s) and the viscous quench that occurs approaching the glass transition.
Having verified that bubble growth is slower than quasi-equilibrium models, we may compare our experimental data with literature models for bubble growth.
4.2.1. Growth proportional to the square root of time
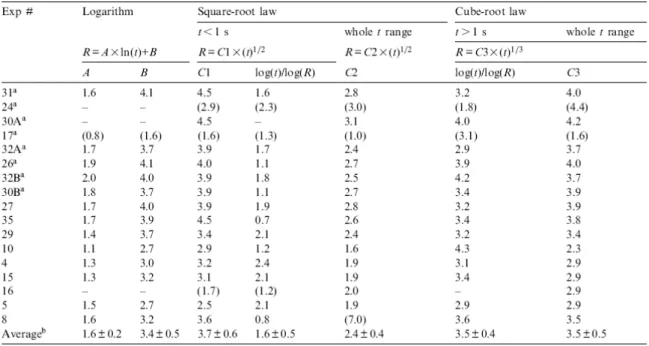
Bubble growth approaching equilibrium for constant pressure, temperature, viscosity and diffusivity has been found to be proportional to a square root of time. Although all these parameters are drastically varying during our experiments, we tested that law because it is the one used in the literature. The law is given by R=C2×(t)1/2, where R is the bubble radius in μm, t the time in s, and C2 a constant that we calculated for the final bubble radius (Table 2). As expected, this law significantly misfits the experimental bubble growth (Fig. 3). In addition, restricting the growth to the first second, during which the cooling rate is very low, the inverse of the slopes in the log(R) versus log(t) coordinates gives 1.6±0.5 instead of 2.0 for a true square-root law (Table 2).
Table 2. Bubble growth laws
We applied the analytical solution of [11] for isothermal and isobaric diffusivity-controlled bubble growth in rhyolites, based on the numerical model of [4] and defined by:
R2=[2×Dw×ρm×(Cwi−Cwf)/ρw×t]−[2×Dw×η×ρm×(2×Cwi+Cwf)×log(ΔP/η×t)/3×Pf×ρw)]
where ρm is the density of the hydrated melt [31], ρw the water density in the bubble [16], Cwi
and Cwf the initial and final water contents of the melt, respectively [20], ΔP the
decompression, η the melt viscosity [30] and Dw the water diffusivity [25], the two last
parameters being extrapolated to water contents >8 wt%. This analytical solution is poorly sensitive to melt viscosity, but strongly relies on water diffusivity. We calculated final radii of 181 and 445 μm instead of 8 and 7.6 μm measured in experiments #31 and #32A, respectively. Therefore, a growth proportional to a square root of time largely overestimates the size of bubbles expanding during a cooling-induced decompression. Integrating the cooling effect on water diffusivity, melt viscosity, melt and gas densities in the analytical solution of [11] does not reconcile the experimental and analytical data.
4.2.2. Growth proportional to the cube root of time
Although it has never been used to describe bubble growth, we investigated the law following the cube root of time, given by R=C3×(t)1/3, where C3 is a constant determined for the final radius (Table 2). We found that bubble growth nearly follows the cube root of time, although such a law often slightly overestimates the bubble size during the first seconds and systematically underestimates it after 2 s. This size underestimation is also suggested by the 3.5±0.4 value given by the inverse of the slopes in the log(R) versus log(t) coordinates, instead of 3.0 for a perfect cube-root law (Table 2). However, Fig. 3 shows that the deviation between the experimental and calculated data, although systematic, is still included within the analytical error on the radius measurements. Approximate fit to a cube root of time means that there is a linear relationship between bubble volume and time, which may be explained if growth is dominated by decompressive expansion of the bubbles.
4.2.3. Growth proportional to the logarithm of time
The experimental data are most closely fit to a logarithmic curve (R=A×ln(t)+B; Fig. 3 with parameters A and B given in Table 2). Although each set of conditions of pressure and temperature gives unique values for A and B, these parameters vary little over the set of experiments (1.6±0.2 and 3.4±0.5, respectively). This is in keeping with the small variability of the final bubble radii (7.5±1.5 μm below 10 kbar, 6.1±0.8 μm above 10 kbar) that may be explained by the strong non-linearity of the water density with pressure, resulting in little volume changes of the bubbles at high pressures compared to low pressures for a given temperature. The bubble growth in experiment #8 with controlled decompression is also satisfactorily fitted by the logarithmic law, suggesting that even bubbles growing nearer to equilibrium can follow this law. In the literature, the only reference to a logarithmic law is that ensuing from the numerical model of [26], after the authors incorporated parametric interactions between closely spaced bubbles resulting from small cooling (ΔT<100°C). These authors found that the logarithmic growth particularly applies to low pressures (<0.1 kbar) or high water oversaturation. Although our experiments cannot be compared to their simulation, we, like them, ascribe the strong deviation from a square root of time to the combined effects of cooling (12°C in experiment #8 or between 192 and 313°C for the other experiments), high water oversaturation in the melt and concurrent decompression.
4.3. Glass transition
The experiments we performed allow us to provide data on glass transition temperatures (Tg)
at high pressures (3.4–15.2 kbar) that can be compared with the current models valid for atmospheric pressures. Dingwell [33] combined Tg measurements from the literature to
propose a Tg calculation for haplogranite composition as a function of water content (≤8.1
wt%) at atmospheric pressure (exception of data acquired at 2.5 kbar) and for a cooling rate of 0.1°C/s. We first have to modify this calculation for the cooling rates prevailing in our experiments. The isokom of log(η)=12.4 Pa s given by [33] gives a shift factor k=11.4, that can be used to calculate the isokom for q=32°C/s, following log(η)=k−log(q)=9.9 Pa s. A melt viscosity decrease of 2.5 log units at 500°C corresponds to a temperature increase of 110°C [30], so that we can calculate Tg (±10°C) for a cooling rate of 32°C/s after [33] following: Tg
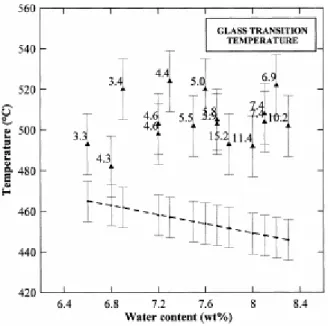
(K)=(786–83.47×ln(Cw))+110. The calculated Tg values are 20–80°C lower than the measured Tg (Fig. 4). Therefore, the effect of pressures of 3.3–15.2 kbar on the Tg determination is an
water contents increasing from 6.6 to 8.3 wt% does not appear in the measured Tg, probably
due to the large errors in the Tg determinations.
Fig. 4. Glass transition temperatures (Tg) as a function of the final water content. The plain triangles are the observed Tg (±15°C) labelled with the final pressures in kbar. The dots are the Tg (±10°C) calculated after [33] at atmospheric pressure for a cooling rate of 32°C/s. The dashed line is the best linear fit of the calculated Tg.
4.4. Applications to natural volcanic systems
Although the experiments are not directly applicable to magma ascent in volcanic systems, this study provides a major step in the understanding of bubble growth process that is necessary for further investigations of magma rheology and eruption mechanisms. During experiments, both temperatures and pressures decrease at a fast rate unlike their variations during magma ascent. However, degassing and crystallization of the ascending magma cause temperature fluctuations that have significant impacts on the bubble growth dynamics [26]. We emphasize here that the effects of cooling and rapid decompression cause growth to strongly deviate from the square root of time that applies during isothermal degassing. Second, our diamond-anvil cell operates at pressures between 5 and 25 kbar, which is probably not relevant to the degassing of rhyolites in a volcanic conduit. A more relevant study would imply either lower pressures (<2 kbar, therefore water contents <6 wt%) for a rhyolite composition, or basalt compositions with a CO2 fluid phase at the present pressure
range. However, we present a new technique providing in situ data that were never collected before. Technical and strategic changes of the present device to make it relevant to volcanic systems are quite straightforward.
If the results are not quantitatively applicable to natural volcanic systems, they are probably of qualitative relevance: (1) single versus several nucleation events that lead to characteristic bubble size distributions in natural erupted products is a hotly debated task. Our results suggest that during magma ascent, an early bubble nucleation on preferential sites (i.e. crystals) would result in gradients in the gas dissolved in the melt and subsequent generations of degassing events; (2) bubble growth during cooling is probably relevant to what happens in volcanic domes; (3) the glass transition is a major process that drastically changes the physical properties of melts so that its precise determination (especially under pressure) is
crucial, and (4) this experimental study provides a novel data base and growth laws that can be used for further developments of analytical solutions of bubble growth.
Acknowledgements
This project was funded by the ‘Visiting Scientists’ Program’ and the EU ‘IHP-Access to research Infrastructures’ program (Contract No. HPRI-1999-CT00004 to D.C. Rubie) of the Bayerisches Geoinstitut. We would like to thank M. Wilke for the hydration experiment of the starting material, K. Klasinski for technical assistance on the diamond-anvil cell, H. Keppler, S. Mackwell, C. Mourtada-Bonnefoi for helpful discussions, B.C. Schmidt and M.P. Semet for improving the manuscript, O. Navon and J. Gardner for constructive reviews.[AC]
References
1. F. Holtz, H. Behrens, D.B. Dingwell and W. Johannes, H2O solubility in haplogranitic
melts: compositional, pressure, and temperature dependence. Am. Mineral. 80 (1995), pp. 94– 108.
2. L.E. Scriven, On the dynamics of phase growth. Chem. Eng. Sci. 10 (1959), pp. 1–10. 3. A. Toramaru, Numerical study of nucleation and growth of bubbles in viscous magmas. J.
Geophys. Res. 100 (1995), pp. 1913–1931.
4. A.A. Proussevitch, D.L. Sahagian and A.T. Anderson, Dynamics of diffusive bubble growth in magmas: isothermal case. J. Geophys. Res. 98 (1993), pp. 22283–22307.
5. J. Barclay, D.S. Riley and R.S.J. Sparks, Analytical models for bubble growth during decompression of high viscosity magmas. Bull. Volcanol. 57 (1995), pp. 422–431.
6. Y. Bottinga and M. Javoy, MORB degassing: bubble growth and ascent. Chem. Geol. 81 (1990), pp. 255–270.
7. A.A. Proussevitch and D.L. Sahagian, Dynamics of coupled diffusive and compressive bubble growth in magmatic systems. J. Geophys. Res. 101 (1996), pp. 17447–17455.
8. O. Navon, A. Chekhmir and V. Lyakhovsky, Bubble growth in highly viscous melts: theory, experiments, and autoexplosivity of dome lavas. Earth Planet. Sci. Lett. 160 (1998), pp. 763–776.
9. N.S. Bagdassarov, D.B. Dingwell and M.C. Wilding, Rhyolite magma degassing: an experimental study of melt vesiculation. Bull. Volcanol. 57 (1996), pp. 587–601.
10. Y. Liu and Y. Zhang, Bubble growth in rhyolitic melt. Earth Planet. Sci. Lett. 181 (2000), pp. 251–264.
11. V. Lyakhovsky, S. Hurwitz and O. Navon, Bubble growth in rhyolitic melts: experimental and numerical investigation. Bull. Volcanol. 58 (1996), pp. 19–32.
12. S. Hurwitz and O. Navon, Bubble nucleation in rhyolitic melts: experiments at high pressure, temperature, and water content. Earth Planet. Sci. Lett. 122 (1994), pp. 267–280. 13. J.E. Gardner, M. Hilton and M.R. Carroll, Experimental constraints on degassing of magma: isothermal bubble growth during continuous decompression from high pressure.
Earth Planet. Sci. Lett. 168 (1999), pp. 201–218.
14. A.H. Shen, W.A. Bassett, I.M. Chou, Hydrothermal studies in a diamond anvil cell: pressure determination using the equation of state of H2O, in: Y. Syono, M.H. Manghnani
(Eds.), High Pressure Research: Applications to Earth and Planetary Sciences, Geophysical Monograph 67 of the American Geophysical Union, Washington, DC, 1992, pp. 61–68. 15. W.A. Bassett, A.H. Shen and M. Bucnum, A new diamond anvil cell for hydrothermal studies to 2.5 GPa and from 190 to 1200°C. Rev. Sci. Instrum. 64 (1993), pp. 2340–2345. 16. A. Saul and W. Wagner, A fundamental equation for water covering the range from the melting line to 1273 K at pressures up to 25 000 MPa. J. Phys. Chem. 18 (1989), pp. 1537– 1565.
17. W. Wagner, A. Saul and A. Prub, International equations for the pressure along the melting and along the sublimation curve of ordinary water substance. J. Phys. Chem. Ref.
Data 23 (1993), pp. 515–527.
18. L. Haar, J.S. Gallagher, G.S. Kell, NBS/NRC Steam Tables. Thermodynamic and Transport Properties and Computer Programs for Vapor and Liquid States of Water in SI Units, McGraw Hill, New York, 1984.
19. A. Paul, Chemistry of Glasses, 2nd edn., Chapman and Hall, 1990, 367 pp.
20. Y. Zhang, H2O in rhyolitic glasses and melts: measurement, speciation, solubility, and
diffusion. Rev. Geophys. 37 (1999), pp. 493–516.
21. K.-D. Grevel and D. Chatterjee, A modified Redlich-Kwong equation of state for H2–H2O
fluid mixtures at high pressures and at temperatures above 400°C. Eur. J. Mineral. 4 (1992), pp. 1303–1310.
22. H. Bureau and H. Keppler, Complete miscibility between silicate melts and hydrous fluids in the upper mantle: experimental evidence and geochemical implications. Earth Planet. Sci.
Lett. 165 (1999), pp. 187–196.
23. R.A. Herd and H. Pinkerton, Bubble coalescence in basaltic lava: its impact on the evolution of bubble populations. J. Volcanol. Geotherm. Res. 75 (1997), pp. 137–157.
24. D.B. Dingwell, The brittle–ductile transition in high-level granitic magmas: material constraints. J. Petrol. 38 (1997), pp. 1635–1644.
25. Y. Zhang and H. Behrens, H2O diffusion in rhyolitic melts and glasses. Chem. Geol. 169
26. A.A. Proussevitch and D.L. Sahagian, Dynamics and energetics of bubble growth in magmas: Analytical formulation and numerical modelling. J. Geophys. Res. 103 (1998), pp. 18223–18251.
27. Y. Zhang, E.M. Stolper and G.J. Wasserburg, Diffusion of water in rhyolitic glasses.
Geochim. Cosmochim. Acta 55 (1991), pp. 441–456.
28. M. Nowak and H. Behrens, An experimental investigation on diffusion of water in haplogranitic melts. Contrib. Mineral. Petrol. 126 (1997), pp. 365–376.
29. Y. Zhang and E.M. Stolper, Water diffusion in a basaltic melt. Nature 351 (1991), pp. 1393–1404.
30. K.U. Hess and D.B. Dingwell, Viscosities of hydrous leucogranitic melts: non-arrhenian model. Am. Mineral. 81 (1996), pp. 1297–1300.
31. R.L. Lange, I.S.E. Carmichael, Thermodynamic properties of silicate liquids with emphasis on density, thermal expansion and compressibility, in: J. Nicholls, K.J. Russel (Eds.), Modern Methods of Igneous Petrology: Understanding Magmatic Processes, Reviews in Mineralogy 24, Mineral. Soc. Am., 1990, pp. 25–64.
32. O. Navon, V. Lyakhovsky, Vesiculation processes in silicic magmas, in: J.S. Gilbert, R.S.J. Sparks (Eds.), The Physics of Explosive Volcanic Eruptions, Geol. Soc. London Special Publications 145, 1998, pp. 27–50.
33. D.B. Dingwell, The glass transition in hydrous granitic melts. Phys. Earth Planet. Int.