HAL Id: hal-01802795
https://hal.umontpellier.fr/hal-01802795
Submitted on 26 Nov 2019HAL is a multi-disciplinary open access archive for the deposit and dissemination of sci-entific research documents, whether they are pub-lished or not. The documents may come from teaching and research institutions in France or abroad, or from public or private research centers.
L’archive ouverte pluridisciplinaire HAL, est destinée au dépôt et à la diffusion de documents scientifiques de niveau recherche, publiés ou non, émanant des établissements d’enseignement et de recherche français ou étrangers, des laboratoires publics ou privés.
Monthly reference change value of cardiac troponin in
hemodialysis patients as a useful tool for long-term
cardiovascular management
Stéphanie Badiou, A. Boudet, H. Leray-Moragues, A. Rodriguez, Anne-Sophie
Bargnoux, A.M. Dupuy, Jean-Paul Cristol
To cite this version:
Stéphanie Badiou, A. Boudet, H. Leray-Moragues, A. Rodriguez, Anne-Sophie Bargnoux, et al.. Monthly reference change value of cardiac troponin in hemodialysis patients as a useful tool for long-term cardiovascular management. Clinical Biochemistry, Elsevier, 2016, 49 (15), pp.1195 - 1198. �10.1016/j.clinbiochem.2016.05.015�. �hal-01802795�
Monthly reference change value of cardiac troponin in hemodialysis
patients as a useful tool for long-term cardiovascular management
☆
S. Badiou a,b, A. Boudet a, H. Leray-Moragues c,d, A. Rodriguez a,d, A.S. Bargnouxa,b, A.M. Dupuy a, J.P. Cristol a,b,⁎
a Department of Biochemistry, Montpellier University Hospital, Montpellier, France b PhyMedExp, University of Montpellier, INSERM U1046, CNRS UMR 9214, 34295 Montpellier Cedex 5, France
c Nephrology, GCS HELP Dialysis Center, Montpellier, France d Dialysis Research and Training Institute, Montpellier, France
☆ Conflict of interest and source of funding for this work: none for all authors.
⁎ Corresponding author at: Department of Biochemistry, Lapeyronie Hospital, F34295 Montpellier, France.
E-mail address: jp-cristol@chu-montpellier.fr (J.P. Cristol).
Abstract
Purpose of research: Circulating cardiac troponin (cTn) has been identified as a risk factor for
cardiovascular and overall mortality in patients undergoing hemodialysis. However, its interpretation remains difficult due to the high prevalence of patients with cTn level beyond the 99th percentile. Determining the cTn reference change value (RCV) may help in assessing a clinically significant change of cTn during regular follow-up of patients. We aimed to determine the long-term RCV of cTn in such patients and to calculate the perdialytic reduction rate of cTn.
Design and methods: To calculate RCV, high-sensitivity (hs)-cTnT (Roche), hs-cTnI
(Abbott), and cTnI-ultra (Siemens)were determined every month before the midweek dialysis session over a 3-month period in 36 stable hemodialysis patients. cTn was also measured after the midweek dialysis session to calculate the cTn removal rate.
Results: The mean RCV (95% confidence interval) was 22% (18–26) for hs-cTnT versus 53%
(34–73) for hs-cTnI versus 65% (45–84) for cTnI-ultra. Log-normal RCV (%) was −19/+25 for hs-cTnT, −33/+96 for hs-cTnI, and−39/+115 for cTnI-ultra. The index of individuality was b0.6 regardless of the cTn assay used. A significantly greater reduction rate was observed for hs-cTnT (48%) than for hs-cTnI (30%, p b 0.001) and cTnI-ultra (29%, p b 0.05).
Conclusions: These results underline the need to use the RCV approach rather than cutoff points to identify the critical change in long-term serial cTn levels. In addition, RCV should be determined for each available assay due to significant differences between assays. Removal of cTn during hemodialysis sessions should also be considered if acute coronary syndrome is suspected during a session.
Keywords: Hemodialysis Reference change value Hs-troponin Acute coronary syndrome
Cardiovascular risk
1. Introduction
Circulating cardiac troponin (cTn) level is commonly used as a biomarker for diagnosing myocardial infarction (MI) using the 99th percentile as a cutoff and considering kinetic measures [1]. With the emergence of high-sensitivity (hs)-cTn, circulating levels below the
99th percentile are detected in N50% of presumably healthy volunteers, thus extending its field of interpretation. Indeed, circulating cTn level has been suggested as a prognostic factor in different populations including the elderly [2], those with chronic heart failure [3], and those undergoing hemodialysis (HD) [4]. It has been previously reported that HD patients evidenced chronic elevation of cTn levels [5], leading to inconclusive interpretation of a single cTn value above the 99th percentile.
Therefore, serial measures of circulating cTn are needed to distinguish between acute coronary syndrome (ACS) and chronic elevation of cTn in HD. However, the magnitude of cTn change in HD that is clinically relevant both for MI diagnosis and for the worsening of chronic cardiac disease remains to be defined. Indeed, parameters including renal removal impairment, adsorption onto dialyzer membranes [6], or change in troponin molecular structure [7] could influence cTn levels, particularly cTnI. In the general population, algorithms based on the 99th percentile and/or relative and absolute changes of cTn during the kinetics have been proposed for MI diagnosis [1]. However, there are no recommendations to define the clinical change of long-term cTn in patients with high cardiovascular risk such as HD patients.
In this context, knowledge of cTn reference change value (RCV) is necessary to better interpret cTn levels in the regular follow-up of HD patients. The concept of RCV considers both the analytical and biological variations of a biomarker in order to determine which percentage change between two consecutive measurements may be considered as a critical difference [8]. Biological variations depend on intra- and inter individual variations assessed through coefficients of variation (CV) within (CVi) and between (CVg) subjects, respectively. The determination of RCV for a biomarker in the healthy population is not always transposable to specific clinical conditions, as recently demonstrated in HD patients [9]. To date, only limited data are available for longterm RCV of cTn in this population.
The aim of the present study was therefore to calculate long-term RCV of different cTn assays including cTnT and cTnI in patients with end-stage renal disease on stable HD maintenance, as well as to assess the reduction rate of cTn during an HD session.
2. Patients and methods
This longitudinal study included stable patients with end-stage chronic kidney disease undergoing hemodialysis thrice a week at the GCS HELP Dialysis Center at Montpellier (France). All patients enrolled were monitoring for their cTn every month for a 3-month period after receiving oral information and providing written consent. The study was approved by the local ethics committee and was declared under the number DC-2008-417.
Patients were included if they were clinically stable, without cardiovascular events or change in dialysis conditions during the study period. Peripheral blood samples were collected before dialysis during a midweek session into evacuated tubes containing heparin as an anticoagulant. In addition, samples were drawn before and after dialysis in the last month of the study, to assess the removal rate of cTn. The reduction rate was corrected for hemo concentration using Bergson's formula: [c]before − ([c]after × (1 + (weight before − Weight after) / 0.2 × weight after)) / [c]before). Here, [c] corresponds to the concentration of the molecule [10].
Hs-cTnT was measured by the chemiluminescent method using a Cobas8000/e602 analyzer and an hs-cTnT STAT reagent (Roche®) corresponding to our routine method. The samples were measured over the 3-month study period using multiple calibration curves. The manufacturer's claim was a CV10% at 13 ng/L, the 99th percentile at 14 ng/L, and a CVa at 2.7% at 17.7 ng/L. A previous study in our laboratory revealed a 2.4% CVa for hs-cTnT using a pool of plasma at 11 ng/L on a Cobas8000/e602 analyzer [11].
STAT hs-cTnI was measured on frozen aliquots with the chemiluminescent method on an Architect i1000 (Abbott®), which is used in our laboratory for other routine methods. All samples were measured using a single calibration curve. The manufacturer's claim was a CV 10% at 4.7 ng/L, the 99th percentile at 26.2 ng/L, and CVa of 3.4% for a level of 43 ng/L.
cTnI-ultra was determined on frozen aliquots using an acridinium ester-based assay on an ADVIA Centaur (Siemens®) device used in our laboratory for other routine methods. All samples were measured using a single calibration curve. The manufacturer's claim was a CV10% at 30 ng/L, the 99th percentile at 40 ng/L, and CVa at 5.3% for a level of 80 ng/L. RCV was calculated as RCV=21/2 ∗ Z ∗ CVt, with a Z-score of 1.96 for p b 0.05 and a CVt 2 = Cvi 2 + CVa 2. A log-normal RCV was calculated according to the formula proposed by Fokkema et al. [12], as log transformation is recommended for biomarkers with skewed distribution. The total CV (CVt) was individually calculated using the results of serial measures. CVi was obtained after removing the analytical variation to CVt according to the formula CVi=(CVt 2−CVa 2)1/2. The index of individuality (II) was assessed through the ratio CVi/CVg, with CVg calculated as the between-subject variation.
3. Results
Thirty-six HD patients fulfilled the inclusion criteria. The median age was 75.6 ± 17.2 years, and 27.8% (n = 10) were women. All patients were treated thrice a week by hemodia-filtration with a Fresenius 5008/5008Mix dialysis system (Fresenius Medical Care, Germany), using polysulfone (91.5%) (Fresenius FX 800 and 100 (86%), Asahi APS (5.5%)) and AN69 (Evodial, Hospal, 8.5%) membranes. The duration of the dialysis session was 220 ± 25 min with an intradialytic weight loss of 1.82 ± 1.02 kg and a Kt/Veq of 1.63 ± 0.25 according to the Daugiras equation.
At the first measurement, the median and interquartile (Q1;Q3) values for cTn (ng/L) were 76 (56;100), 23 (13;34), and 23 (15; 38) for the Roche, Abbott, and Siemens assays, respectively. The mean of cTn was higher than the median values for each cTn assay, revealing a right-skewed distribution. The cTn values were below the 99th percentile value provided by manufacturers (i.e., b14 ng/L for the Roche hs-cTnT, b26.2 ng/L for the Abbott hs-cTnI, and b40 ng/L for the Siemens cTnI-ultra) in, respectively, 0%, 62%, and 77% of patients. The level of cTn did not increase over the period study, regardless of the assay used. The individual kinetics of cTn for each assay are presented in Fig. 1. The mean reduction rate of cTn during a dialysis session calculated using a correction for hemo-concentration was significantly higher for cTnT (48% (43–51)) than for hs-cTnI (30% (22–37), p b 0.001) and for cTnI-ultra (29% (25–44), p b 0.05). We noted a return to value below the 99th percentile for four patients with hs-cTnT, five patients with hs-cTnI, and none for cTnI-ultra. The median cTn and interquartile of cTnI before and after the last dialysis session are presented in Fig. 1.
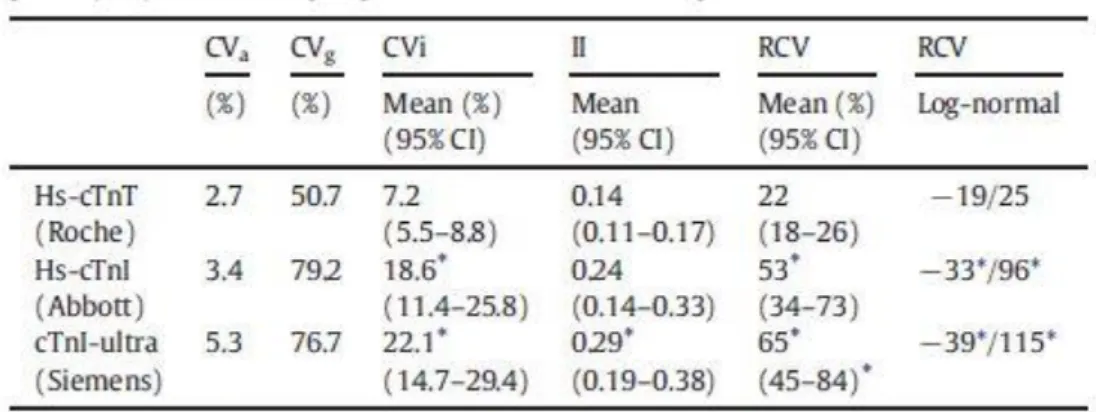
The results for the calculation of RCV, CVi, CVg, and II are presented in Table 1. The CVi values were significantly higher for both cTnI compared with cTnT, whereas II was b0.6 for all assays. The RCV for both cTnI (upper 50%) was significantly higher than the RCV for cTnT (22%). Asymmetric RCV using the log-normal approach confirmed the significantly higher RCV for cTnI compared to cTnT for both decrease and increase.
4. Discussion
This study highlights the difficulties of interpreting cTn levels in the HD population. Indeed, as previously reported, the cTn levels are elevated and frequently exceed the 99th percentile, which is generally recognized as an alert threshold value. In addition, RCV values and low II strongly suggest that serial measurements are needed to obtain clinically relevant information.
Recently, the European Society of Cardiology (ESC) proposed an alternative 0/1-h rapid rule-out and rule-in algorithm for non-ST elevation ACS based on basal levels or very short (1-h) kinetic studies. A rule-in cutoff value of 52 ng/L has been validated for the Roche hscTnT and been proposed for the Abbott hs-cTnI assays, based on a single hs-cTn determination [1]. For hs-cTnT, 81% of our HD cohort exceeded the threshold established in the general population, whereas 15% of our patients exceeded the threshold for hs-cTnI. These repartitions highlight the complexity of cTn interpretation in HD. Nevertheless, considering the complexity of their condition, HD patients should be considered for further workup. Furthermore, clinicians must particularly focus on the laboratory method used for cTn measurement. This is because its interpretation depends on the characteristics of the test used, including the cutoff point, RCV, and additional clearance rates for HD patients.
Beyond the diagnosis of MI, cTn was evidenced as a predictive factor of mortality in asymptomatic HD patients, even with classical cTnT [13] and hs-cTnT or cTnI [4,14]. Cardiovascular disease is known to be the first cause of mortality in HD, although often asymptomatic. Thus, regular follow-up of cTn may improve the clinical management of these high-risk patients. In this approach, determining long-term RCV of cTn is useful in assessing the significant change indicating worsening or occurrence of chronic cardiac disease. In the present study, RCV was significantly higher for both cTnI (Roche and Abott assays) compared with cTnT (Siemens assay), highlighting the need for determining RCV for each available cTn assay. Indeed, our results support that a change around 20% for hs-cTnT measured every month can be considered as a non-critical variation, whereas this change could be around 50% for hs-cTnI and 60% for cTnI-ultra. A more fine-tuned approach can be used with the log-transformed RCV, which allows distinguishing between variation of cTn in rise or fall.
The CVi and RCV observed are close to the weekly (hs-cTnT and hs-cTnI) and monthly (hs cTnT and sensitive cTnI) data previously reported in HD patients [15,16]. They support the need to define different magnitude changes of cTn between HD patients and the general population, especially in absolute values. The use of cTn during HD sessions will be even more difficult if ACS is suspected. Indeed, the variation of cTn during the HD session may interfere in kinetic interpretation [5]. Although previous studies measured cTn before and after HD [5], only a few used hs-cTn [17]. Contrary to previous data reporting no change in cTnT, the present study showed a mean removal of cTnT at 48% using hemo-diafiltration. Of note, this reduction rate, corrected for hemo-concentration, appeared higher than the first reported rate using the same hs-cTnT assay [17]. Further, it is worth noting that lower removal of cTnI was observed compared to hs-cTnT. This finding was in discordance with
previous data reporting higher adsorption onto polysulfone membrane dialysis for cTnI compared to cTnT [6].
___________________________________________________________________________ Fig. 1. Individual evolution of cTn over the 3-month period (M1, M2, and M3) and effect of a dialysis session on cTn level for each assay. The box plot represents median, first and third quartile, as well as minimum and maximum values.
___________________________________________________________________________
The limitations of this study were the number of patients included and the relatively short follow-up period. However, this study was designed to provide information on three cTn assays in parallel. It was also difficult to ensure the cardiac stability of our population outside acute events. This was established through an overall clinical and biological stability.
Table 1 Intra individual coefficient of variation (CVi, %), inter individual coefficient of variation (CVg, %)), index of individuality (II), and reference change value (RCV, %) for cardiac troponin (cTn) in hemodialysis patients. CVa was claimed by the manufacturer.
In conclusion, this study determined the long-term RCV of several cTn assays in patients on regular maintenance HD for improved use of cTn in a context of chronic elevation of cTn. Our data evidenced higher biological variations with the cTnI assay compared to cTnT, highlighting the need to determine RCV for all available assays for identifying the magnitude of a critical change. These results strongly suggest that a serial monitoring of cTn, for instance, on a monthly or quarterly basis, could be included in the follow-up of HD patients. The long-term evolution of cTn in this population could be interpreted according to the RCV determined in a stable HD population.
References
[1] M. Roffi, C. Patrono, J.P. Collet, C. Mueller, M. Valgimigli, F. Andreotti, et al., ESC guidelines for themanagement of acute coronary syndromes in patients presenting without persistent ST-segment elevation: task force for the Management of Acute
Coronary Syndromes in patients presenting without persistent ST-segment elevation of the European Society of Cardiology (ESC), Eur. Heart J. 2015 (2015).
[2] N. Kuster, K. Monnier, G. Baptista, A.M. Dupuy, S. Badiou, A.S. Bargnoux, et al., Estimation of age- and comorbidities-adjusted percentiles of high-sensitivity cardiac troponin T levels in the elderly, Clin. Chem. Lab. Med. 53 (2015) 691–698.
[3] C.G. Jungbauer, J. Riedlinger, S. Buchner, C. Birner, M. Resch,M. Lubnow, et al., Highsensitive troponin T in chronic heart failure correlates with severity of symptoms, left ventricular dysfunction and prognosis independently from N-terminal pro-btype natriuretic peptide, Clin. Chem. Lab. Med. 49 (2011) 1899–1906.
[4] A.S. Bargnoux, N. Kuster, L. Patrier, A.M. Dupuy, G. Tachon, F. Maurice, et al., Cardiovascular risk stratification in hemodialysis patients in the era of highly sensitive troponins: should we choose between hs-troponin I and hs-troponin T? Clin. Chem. Lab. Med. (2015).
[5] D. Wayand, H. Baum, G. Schatzle, J. Scharf, D. Neumeier, Cardiac troponin T and I in end-stage renal failure, Clin. Chem. 46 (2000) 1345–1350.
[6] D.C. Gaze, P.O. Collinson, Cardiac troponin I but not cardiac troponin T adheres to
polysulfone dialyser membranes in an in vitro haemodialysis model: explanation for lower serum cTnI concentrations following dialysis, Open Heart 1 (2014), e000108.
[7] R. Ziebig, A. Lun, B. Hocher, F. Priem, C. Altermann, G. Asmus, et al., Renal elimination of troponin T and troponin I, Clin. Chem. 49 (2003) 1191–1193.
[8] C.G. Fraser, E.K. Harris, Generation and application of data on biological variation in clinical chemistry, Crit. Rev. Clin. Lab. Sci. 27 (1989) 409–437.
[9] Z. Corte, C. Garcia, R. Venta, Biological variation of cardiac troponin T in patientswith end-stage renal disease and in healthy individuals, Ann. Clin. Biochem. 52 (2015) 53–60. [10] J.W.B. Bergström, No change in corrected B2-microglobulin concentration after cuprophane haemodialysis, Lancet 1 (1987) 628–629.
[11] A.M. Dupuy, C. Lozano, S. Badiou, A.S. Bargnoux, N. Kuster, J.P. Cristol, Biological variability of hs-cardiac troponin T on the Roche Cobas 8000/e602(R) immunoanalyzer, Clin. Chim. Acta 425 (2013) 62–63.
[12] M.R. Fokkema, Z. Herrmann, F.A. Muskiet, J. Moecks, Reference change values for brain natriuretic peptides revisited, Clin. Chem. 52 (2006) 1602–1603.
[13] F.S. Apple, M.M. Murakami, L.A. Pearce, C.A. Herzog, Predictive value of cardiac troponin I and T for subsequent death in end-stage renal disease, Circulation 106 (2002) 2941–2945.
[14] D. McGill, G. Talaulikar, J.M. Potter, G. Koerbin, P.E. Hickman, Over time, highsensitivity TnT replacesNT-proBNP as themost powerful predictor of death in patients with dialysis-dependent chronic renal failure, Clin. Chim. Acta 411 (2010) 936–939.
[15] K.M. Aakre, T. Roraas, P.H. Petersen, E. Svarstad, H. Sellevoll, O. Skadberg, et al., Weekly and 90-minute biological variations in cardiac troponin T and cardiac troponin I in hemodialysis patients and healthy controls, Clin. Chem. 60 (2014) 838–847.
[16] W. Mbagaya, A. Luvai, B. Lopez, Biological variation of cardiac troponin in stable haemodialysis patients, Ann. Clin. Biochem. 52 (2015) 562–568.
[17] M.S.R.Wolley, E. Curry, J. Davidson, H.White, H. Pilmore, Variation in and prognostic importance of troponin T measured using a high-sensitivity assay in clinically stable haemodialysis patients, Clin. Kidney J. 6 (2013) 7.