HAL Id: hal-03086357
https://hal.uca.fr/hal-03086357
Submitted on 22 Dec 2020
HAL is a multi-disciplinary open access
archive for the deposit and dissemination of
sci-entific research documents, whether they are
pub-lished or not. The documents may come from
teaching and research institutions in France or
abroad, or from public or private research centers.
L’archive ouverte pluridisciplinaire HAL, est
destinée au dépôt et à la diffusion de documents
scientifiques de niveau recherche, publiés ou non,
émanant des établissements d’enseignement et de
recherche français ou étrangers, des laboratoires
publics ou privés.
Oxygen Regeneration by Algae Cultivation in
Photo-Bioreactor for ISS Cabin Technology
Demonstrator
Dominique Chapuis, Stefano Nebuloni, Paolo Dainesi, Céline Laroche, David
Duchez, Claude-Gilles Dussap, Marco Volponi, Christel Paille
To cite this version:
Dominique Chapuis, Stefano Nebuloni, Paolo Dainesi, Céline Laroche, David Duchez, et al..
Oxy-gen ReOxy-generation by Algae Cultivation in Photo-Bioreactor for ISS Cabin Technology Demonstrator.
International Conference on Environmental Systems, Jul 2020, Lisbonne, Portugal. �hal-03086357�
ICES-2020-264
Oxygen Regeneration by Algae Cultivation in
Photo-Bioreactor for ISS Cabin Technology Demonstrator
Dominique Chapuis1, Stefano Nebuloni1, and Paolo Dainesi1
RUAG Slip Rings SA, 1260 Nyon, Switzerland
Céline Laroche2, David Duchez2 and Claude-Gilles Dussap2
Université Clermont Auvergne, CNRS, SIGMA Clermont, Institut Pascal, F-63000 Clermont-Ferrand, France and
Marco Volponi3 and Christel Paillé3
Directorate Of Technology, Engineering And Quality (TEC), Esa Estec, Keplerlaan 1, 2200ag Noordwijk, The Netherlands
Oxygen regeneration from ambient carbon dioxide is a fundamental technology building block for future life support systems for space applications. BIORAT1 Phase B2 project consists in the development of the Preliminary Design Review (PDR) level design of an On Board Demonstrator (OBD) to be hosted in European Drawer Rack 2(EDR2) facility on board of the ISS. The core of the OBD is a Photo-Bioreactor (PBR) filled with spirulina (Limnospira indica PCC 8005) producing oxygen from carbon dioxide and light by photosynthesis. A Liquid Loop (LL) transports the oxygen & carbon dioxide dissolved into the cultivation medium liquid between the Photobioreactor (PBR) and the ISS cabin ambient air. The Gas Exchange Module (GEM) enables the exchange of Oxygen & Carbon Dioxyde separates the cultivation medium liquid to the ambient air while keeping the liquid inside the LL. The design of this flight hardware is supported by tests results obtained with a Bread Board Model (BBM). In this paper, we present the results of the long duration spirulina cultivation test performed with the BBM. allowing verification of the long term functionality of the PBR & LL including the GEM. The PBR performances together with correlation to the model of the cultivated algae growth and oxygen production are presented. Future development and expected results and perspectives are also presented and discussed.
Nomenclature
εPBR = Hardware O2 production correction coefficient
I0 = Incident light intensity (W/m2)
𝑚𝑚̇𝑥𝑥,𝑃𝑃𝑃𝑃𝑃𝑃 = Biomass production rate (g/s)
𝑀𝑀𝑥𝑥 = Biomass molar mass (g/mol)
𝑛𝑛̇ = Molar production rate (mmol/hr)
qf = Feed flow rate (mL/min)
qLL = Liquid Loop flow rate (mL/min)
ρx = Biomass concentration (g/L)
VLL = Liquid Loop volume (L)
𝜉𝜉 = Stoichiometric coefficient (molO2/molx)
[𝑂𝑂2] = Dissolved oxygen concentration (mol/L)
BBM Bread Board Model
BRT1 Biorat1 1 Dominique.chapuis@ruag.com 2 Celine.laroche@uca.fr
EDR2 European Drawer Rack 2
ESA European Space Agency
GC Gas Conditioning
GEM Gas Exchange Module
GL Gas Loop
ISS International Space Station
LED Light-Emitting Diode
LL Liquid Loop
LSS Life Support System
OBD On Board Technology Demonstrator
PBR PhotoBioreactor
PDMS Polydimethylsiloxane
PDR Preliminary Design Review
P&D Piping and Instrumentation
I. Introduction
ife Support is one of the key leading technical challenges to enable future long term human spaceflight missions. Following the objective of minimizing the re-supply of essential consumables such as air, water and oxygen, the study presented in this paper aims at improving the scientific and technical understanding of air regeneration systems based on photosynthetic process. The implementation of bio-regenerative solutions becomes more and more apparent and appealing as the duration of the mission increases. For the last 30 years, the MELISSA (Micro-Ecological Life-Support System Alternative) project, inspired by an aquatic ecosystem, has been set up to be a model for the study of regenerative life-support systems for long-term space missions (Refs. 3, 5, 8). MELISSA loop is organized in six major compartments, coupled together in a closed circulatory loop. One of these compartment contain photosynthetic cyanobacteria for air revitalisation to supply the crew compartment.
Current systems for O2 generation and CO2 capture on International Space Station (ISS) are based on
physicochemical principles (Ref. 14), namely the electrolysis of H2O and the scrubbing of CO2 from the cabin
atmosphere and the subsequent reduction to CH4 (which is for the most part vented currently). Algal
PhotoBioreactors (PBR) represent an interesting alternative: spirulina as Limnospira indica PCC 8005 (formerly, known as Arthrospira platensis) bear great promises at supporting the carbon-to-oxygen regeneration functionality through photosynthesis. However, microgravity could have a non negligible impact on microorganisms in liquid culture (Refs. 4, 9). Gravity affects a microbial (bioreactor) culture at 2 main scales: (i) it has a direct physical effect on the gas/liquid transfer, and more generally on fluid dynamics and mixing of bioreactor; and (ii) it affects the physiology and metabolism of microorganisms themselves. Ref. 6 has reviewed the algal research in space, concluding that even though a large number of spaceflight experiments were conducted (mainly with Chlorella sp.), data were still quite limited, and no experiments have successfully reported in-flight growth rate of algae. Since, the Arthrospira-B experimentwas launched on December 15th 2017 on board the SpaceX CRS-13 / Falcon 9 rocket for a 5 weeks experiment operated within the Biolab facility system of the Columbus module in ISS, with the aim to explore the Limnospira indica PCC 8005 behaviour in instrumented photobioreactor in space conditions., In this experiment, batch cultures of Limnospira indica PCC 8005 were successfully performed with cultivation durations exceeding 800 hours, In order to achieve an efficient gaz-liquid transfer, the PBRs consisted of a culture chamber and a gaz chamber separated by an hydrophobic membrane. Results have shown that biomass and oxygen productions fitted with the predictive model developed, thus demonstrating the suitability of the chosen strain and technology for atmosphere regeneration in microgravity (Ref. 7). However, these experiments were conducted at small scale (50mL culture chamber and 24mL for the gaz chamber).
In order to reach the required level of maturity for an operational Life Support System (LSS), preparation testing and validation steps are needed to characterize and well understand the system functionalities to secure future developments. The ISS provides the necessary conditions (microgravity & closed environment) to test and validate the technology and its performances. In this context the project BIORAT1 (BRT1), founded by the European Space Agency (ESA), aims at developing an On Board Demonstrator (OBD), a technological and scientific platform to be tested in the Columbus module of ISS see Figure 1.a (left). Its initial purpose was to recycle the carbon dioxide (CO2) into oxygen (O2) in a closed Gas Loop (GL) to support the respiration of 3 mices. A preliminary evaluation of
this system has been performed in laboratory condition (Ref. 10). The goal of the BIORAT1 has been modified, the
closed GL has been open to the ISS air cabin. Instead to support mices respiration, the system will partially support the respiration of the ISS crew see Figure 1.b (right).
The BRT1 OBD must operate with a controlled O2 production rate in continuous cultivation for a period of times
extended to 90 days and use the carbon dioxide from the cabin air as main source of carbon instead to relying on the carbonate content of the modified Zarrouk medium (Ref. 1).
Due to the numerous process dynamics (Biomass concentration, nitrate contentration, dissolved O2, dissolved
CO2, pH, PBR liquid content etc..) and process manipulated variables (light intensity, harvesting flow rate, feeding
flow rate, PBR internal pressure etc..) implied in the continuous cultivation, a high level of automation is required in order to keep the process in the correct operational space, therefore the process dynamics must be well characterized and predictable. This study focuses primarily on the development, testing and characterization of the PBR and the Gas Exchange Module (GEM) in preparation to a Preliminary Design of the OBD.
Figure 1.a (left) Columbus module credit NASA. Figure 1.b (right) BRT1 On board demonstratorflow principle (GC means Gas Conditioning).
II. Objective of the Study
This paper provides a technical description of the test set-up including the support equipment, and overview of the test sequence and test results, comparison with mathematical model and conclusions. The objectives of the study are:
a) to collect and analyze life time data for a duration beyond 15 days of continuous operations b) to characterize the functional performances of the developed PBR
c) to validate the functional performances of the GEM
d) to analyze and compare data with existing mathematical model
III. Methodology
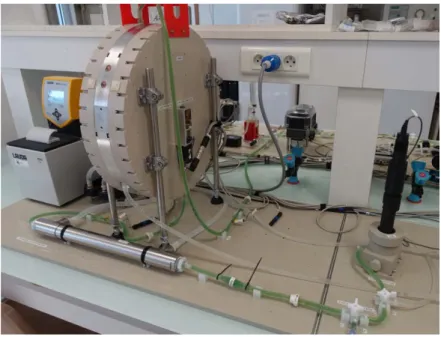
A. Bread Board Description
From the OBD concept and main functionalities, a prototype, Bread Board Model (BBM), has been designed in order to validate the critical functions.
The emphasis of this BBM is the validation of the O2 production & transfer from the PBR to the ambient,
therefore it integrates a representative LL with a PBR and GEM. The other elements have not been integrated or have been simplified.
From a Piping and Instrumentation diagram (P&ID) (see Figure 2), the BBM is constituted by different interconnected elements each one dedicated at specific functions:
BRT1 OBD PBR GEM Inlet GC Outlet GC Liquid Loop Crew Gas Loop Columbus cabin O2 CO2 O2 O2 CO2 CO2 Solid Loop
1. The LL hosts the primary fluidic elements aimed at the oxygen regeneration. The PBR and GEM are part of it. The LL is equipped with pressure, temperature, pH and dissolved oxygen sensors, to provide monitoring functionalities. The LL has a fixed volume and its working pressure is monitored and controlled by the overpressure from the feed source.
2. The gas loop (GL) provides controlled air composition flow rate by mixing compressed air and pure CO2. The working concentration of CO2 has been set at 4000 ppm. The GL interfaces with the gas
exchange system and it is equipped with pressure and CO2 sensors allowing monitoring of Carbon
exchange rates. The GL outlet is released in the room atmosphere.
3. The Solid Loop in charges to feed and control the biomass concentration in the LL by harvesting in the OBD has been simplified with a feed tank and outflow tank in the BBM. (The harvesting function is necessary, because the O2 production by photosynthesis implies a proportional biomass production. To
keep the PBR in a functional range and allow a continuous cultivation, the produced Biomass must be removed from the LL). In order to regulate the biomass concentration in the LL (including the PBR), a precise volumetric pump controls the outflow flow rate of the LL. Because the LL is a fixed volume, the feed flow rate qf is equal to the outflow flow rate.
The system has been designed to account for the required functionalities as well as maintenance and utilization requirements, including sterilization, filling and emptying operations.
This BBM is an evolution of an existing prototype (see Ref. 1110) with the inclusion of major upgrades in order to improve the overall prototype reliability: redesign of the PBR mixing mechanism, elimination of optional features such as recirculating loops and harvesting filters.
Figure 2. Piping & Instrumentation Diagram of the BBM The P&ID diagram above allows to easily support a functional description of the system:
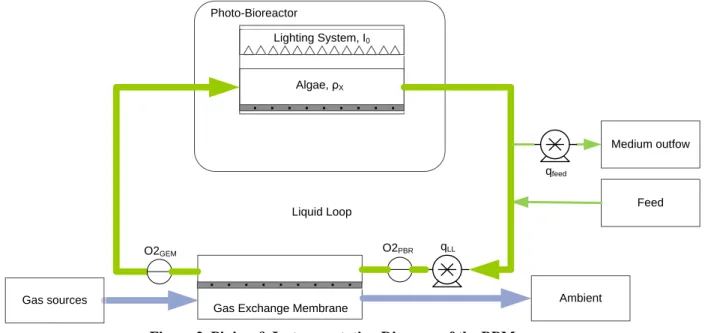
The PBR (see Figure 3) serves as O2 production unit by cultivating the cyanobacteria Limnospira indica PCC
8005 in a liquid phase medium (Zarrouk). Its functionality is primarily regulated via the incident light intensity from a LEDs panel and the working biomass concentration. Proper pH, temperature, nutrients and dissolved inorganic carbon values are required to guarantee the correct functionality of this element. Mixing is requested in order to provide homogenous cultivations conditions in the PBR.
PBR Main characteristics:
• Maximum incident light intensity: 100W/m2
• Nominal O2 productivity: 6.75 mmol/h
• Maximum working biomass concentration: 2.0 g/L • PBR volume: 2.6 L
Feed Lighting System, I0
Photo-Bioreactor
Algae, ρX
Gas Exchange Membrane Ambient
Gas sources Liquid Loop Medium outfow qLL O2PBR O2GEM qfeed
• Illuminated Surface: 0.26m2
• Maximum working pressure: 2 bar relative
Figure 3. PBR during life test with visible cyanobacteria in LL.
The Gas Exchange Modules (GEMs) are critical components. GEM are made of numerous hollow fibers (lumen) arranged in parallel with regard to the LL flow. The gas transfer occurs by complex convective-diffusing mass transfer. In order to have good gas transfer performance, these hollow fibers have relatively small internal diameters. This however poses a limit to the size of the flowing biomass. Two types of membrane have been used during the life test.
GEM Type 1 characteristics are: • Material: Diffusive PDMS • Surface: 1m2
• Lumen internal diameter: 190 microns GEM Type 2 characteristics are:
• Material: Porous PP • Surface: 1.4m2
• Lumen internal diameter: 200 to 220 microns
A peristaltic pump in the LL generates the medium circulation in the LL from the PBR to the GEM. Its maximal flow rate is up to 2L/min.
Two sensors positioned at the GEM liquid inlet and outlet measures respectively the dissolved O2 concentration
from the PBR and from the GEM. These two sensors in conjunction with the LL flow rate are used to compute the amount of oxygen exchanged at the GEM and then the O2 production rate.
B. Test Flow
After manufacturing and assembly operations, including dedicated component-level testing and detailed inspections, the system has gone through final readiness check including leak and basic functional tests in preparation to the test sequence which includes following main steps:
1. Disinfection: purpose of this activity is to reduce the level of bacterial contamination prior to inoculation step. Chemical disinfection (NaOH based) combined with autoclaving of parts have been implemented as disinfection method.
2. Final Integration and Filling: the system is then filled with a modified (according to Refs. 1, 12) Zarrouk medium (an aqueous solution made of salts and nutrients) along with the inclusion of latest elements (e.g. GEM). The filling procedure comprises an extended list of functional and health check
tests, going from basic leak tightness verifications to reference gas transfer performance tests, checking the status of the system and its components.
3. Cultivation: starting with the inoculation of the cyanobacteria, the first part of the cultivation (quasi-batch cultivation) is executed at low O2 productivities and with a very low harvesting rate. After a
predetermined biomass concentration is reached, the O2 productivity is raised to nominal and the
harvesting operations are initiated to keep biomass concentration within acceptable limits.
4. Disposal: at the conclusion of the test sequence a dedicated shut down procedure, followed by disinfection, rinsing and emptying operations is executed
C. Model
Dissolved oxygen balance equation is expressed in the following form:
𝑉𝑉𝐿𝐿𝐿𝐿𝑑𝑑𝑑𝑑𝑑𝑑[𝑂𝑂2] = 𝑛𝑛̇𝑃𝑃𝑃𝑃𝑃𝑃− 𝑛𝑛̇𝐺𝐺𝐺𝐺𝐺𝐺 (1)
Where [O2] is the dissolved oxygen concentration in the liquid loop (perfectly mixed hypothesis assumed,
supported by the large time-scale separation of convective mixing and O2 dynamics), VLL is the liquid loop volume
participating to the dynamics, nPBR is the O2 production rate (mol/s) provided by the Photo-bioreactor, and nGEM is
the oxygen transfer rate occurring at the Gas Exchange Module interface from the liquid loop towards the
environment. The Gas Exchange Module transfer rate is evaluated based on component specifications (area, mean mass transfer coefficient) and operating parameters (air composition on gas loop side, flow rates); the transfer rate, expressed in the form reported in Eq. (2), can be directly measured:
𝑛𝑛̇𝐺𝐺𝐺𝐺𝐺𝐺= 𝑞𝑞𝐿𝐿𝐿𝐿([𝑂𝑂2]𝑃𝑃𝑃𝑃𝑃𝑃− [𝑂𝑂2]𝐺𝐺𝐺𝐺𝐺𝐺) (2)
Where qLL is the liquid flow rate passing through the membrane module, and [O2]PBR and [O2]GEM are the
dissolved oxygen concentrations entering and exiting the module respectively. Similarly, the biomass balance equation can be written in the following form:
𝑉𝑉𝐿𝐿𝐿𝐿𝑑𝑑𝑑𝑑𝑑𝑑[𝜌𝜌𝑥𝑥] = 𝑚𝑚̇𝑥𝑥,𝑃𝑃𝑃𝑃𝑃𝑃− 𝑞𝑞𝑓𝑓𝜌𝜌𝑥𝑥 (3)
Where ρx is the biomass concentration (g/L), mx,PBR is the biomass production rate in the photo-bioreactor, qf is
the feed rate (controllable via a volumetric pump). The biomass production rate and the oxygen production rate 𝑛𝑛̇𝑂𝑂2,𝑃𝑃𝑃𝑃𝑃𝑃 are related by:
𝑛𝑛̇𝑂𝑂2,𝑃𝑃𝑃𝑃𝑃𝑃=𝑚𝑚̇𝑥𝑥,𝑃𝑃𝑃𝑃𝑃𝑃𝐺𝐺𝑥𝑥 𝜉𝜉 (4)
With ξ a stoichiometric constant given by Ref.13, Mx = 23.7 g/mol the biomass molar mass.
Ultimately the biomass production rate so the O2 production rate, under proper working conditions (temperature
range 35°C-36°C, pH range 8.5-10.5, abundance of nutrients and carbonates) can be solely expressed as a function of two variables: 1) incident light intensity (I0) and 2) biomass concentration. For simple geometries the relationship
can be implemented in an analytical form (Ref.2).
The presented model thus allows an a-priori evaluation of the O2 production rate 𝑛𝑛̇𝑃𝑃𝑃𝑃𝑃𝑃𝑎𝑎 ; it has been implemented
during the design phase for sizing and verifications steps. As the purpose of the test campaign is assess model applicability to the existing hardware, a further variable (available for regression) has been introduced to adjust and optimize the prediction: a hardware-related correction coefficient (εPBR) is included in the above equations which
scales the actual O2 (biomass as-well) production rate from the pure theoretical value:
𝑛𝑛̇𝑂𝑂2,𝑃𝑃𝑃𝑃𝑃𝑃𝑎𝑎 = 𝜀𝜀𝑃𝑃𝑃𝑃𝑃𝑃∙ 𝑛𝑛̇𝑂𝑂2,𝑃𝑃𝑃𝑃𝑃𝑃(𝐼𝐼0, 𝜌𝜌𝑥𝑥) (5)
Expected order of magnitude for the identified variable is ~1.
IV. Results
A. Biomass Evolution
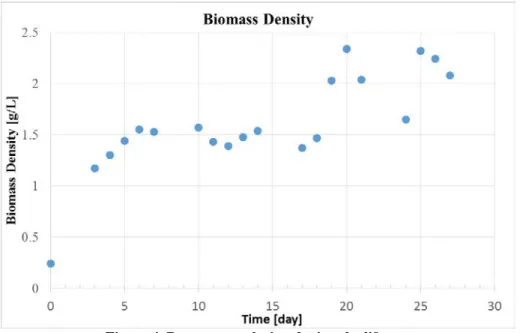
Biomass density has been monitored during the execution of the experiment via dry mass measurements on samples taken every working day. The introduced biomass at the inoculation has been approx. 0.84 g, thus leading to a 0.24 g/L initial biomass concentration. Light intensity has been kept constant at 20 W/m2 for the entire duration of the first quasi-batch phase, during which the feeding pump was operated at low values (qf = 50 µL/min).
After 2.5 days, the feed flow rates has been enabled and controlled manually in order to perform a continuous cultivation above 1g/L of dry mass concentration. The light intensity has been set at 40W/m2 in order to get a O2
After 18 days, the feed flow rates has been controlled manually in order to perform a continuous cultivation above 2g/L of dry mass concentration until the end of the experiment day #27.
These biomass concentrations validate that the current BBM design is able to perform continuous cultivation in a range of 1g/L to 2g/L dry mass concentration. In addition, with 27 days of operation, its exceeds the initial tests objectives of 15 days of operations.
Figure 4. Dry mass evolution during the life test
Another critical aspect of this design is that the spirulina is pumped through the LL and in particularly the GEM. Observations of samples with a microscope (Figure 5 and Figure 6) does not show algae particles nor debris. The increase of their size compared to the inoculum size (see Table 1) shows the compatibility of this design including the two types of GEM with the cultivation of spirulina.
Figure 5 – Inoculum microscopic views at inoculation Day#0
Figure 6 – Cultivation medium microscopic views at Day#27
Time Average size [µm] Number of spirulina per sample Day#0 166 61 Day#3 247 70 Day#4 229 124 Day#7 227 148 Day#10 213 166 Day#17 288 136 Day#19 271 133
Table 1. Spirulina size over time
B. Biomass and O2 Production Correlation
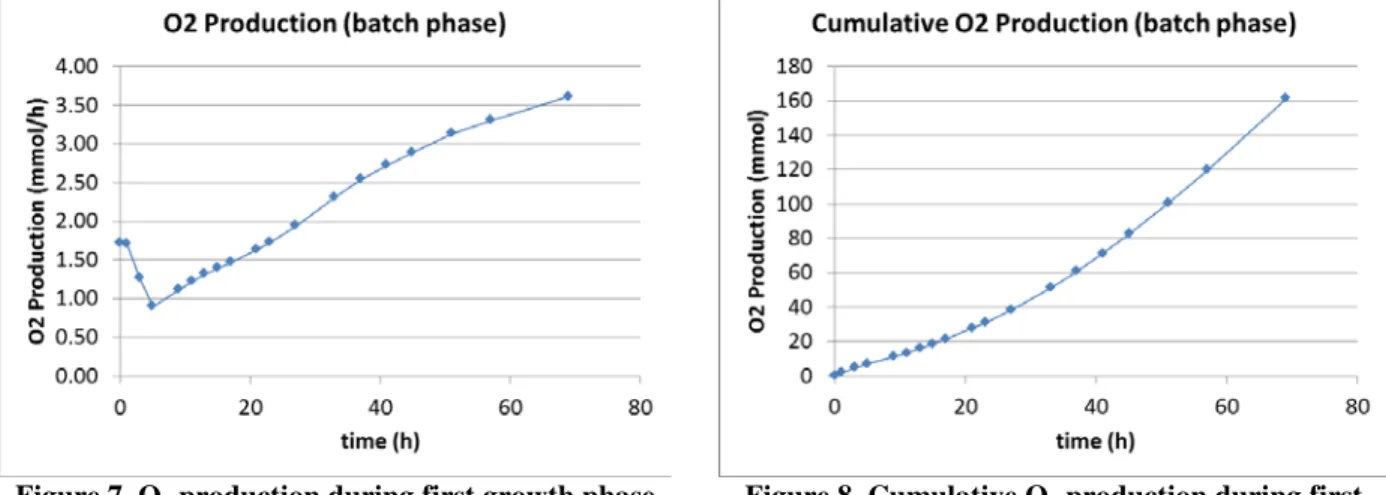
Light intensity has been kept constant at 20 W/m2 for the entire duration of the first quasi-batch phase, during which the feeding pump was operated at low values (qf = 50 µL/min). After 69 hours, the biomass concentration
(dry mass) was measured at 1.17 g/L. Figure 7 shows the O2 production rate during the quasi-batch phase and Figure
8 shows the corresponding cumulative O2 production.
Figure 7. O2 production during first growth phase
after inoculation (biomass density raising from 0.24 g/L to 1.17 g/L)
Figure 8. Cumulative O2 production during first
growth phase (batch) after inoculation
This first phase (0h to 69h) of the test allows a comparison between the measured produced amount of oxygen (exchanged via the GEM) and the measured biomass variation in the liquid loop. The equivalent measured stoichiometric coefficient (mols of oxygen over mols of biomass) is 1.2±0.1 in good agreement with the theoretical range of 1.317 - 1.372 “photosynthetic quotient” given in Ref. 13.
C. Light intensity-O2 Production Model Correlation
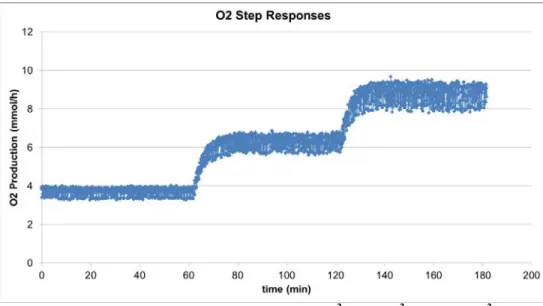
After approximately 70h of experiment, a step response sequence has been executed. Light intensity has been varied between 20 W/m2, 35 W/m2 and 50 W/m2 respectively and dissolved oxygen data acquired. Stabilization time (relative variation > 95%) from one condition to the next has been evaluated in the order of 15 minutes.
Figure 9. O2 Production step responses (20 W/m 2
, 35 W/m2 and 50 W/m2)
These acquired data allow for comparison between the existing mathematical model and test data. The included correction coefficient (εPBR) takes into account various factors associated to measurements uncertaintities and to the
geometrical specificities of the PBR design which are extremely complex to model and therefore lumped into a single empirical parameter. Possible identified factors are listed below:
• O2 production rate measurement error that depend on dissolved O2 measurement, Liquid-Loop flow rate sensing and Henry coefficient of the cultivation medium.
• Biomass concentration in PBR, that is measured by sampling.
• Shadowing effects (mixing system wipers) & Border effects (the model is based on infinitely large 2D domain) within the Photo-bioreactor working volume
• Effective illumination distribution within the illuminated area (discrete LEDs vs. perfectly homogenous light source, reflections are refractions effect on the windows)
• Effective mass scattering and mass absorption coefficients (biomass size/shape distribution dependent) A single-variable regression is preformed to find the best fit that minimizes the variance of the error between the predicted (model) values and the measured values.
The minimization of the variance leads to:
εPBR = 0.953 (correlated equivalent PBR coefficient)
Light Intensity (W/m2) Measured ndot_O2 (mmol/hr) Model ndot_O2 (mmol/hr) Model Error (%) 20 3.7 4.69 26.7 35 6.3 6.61 4.90 50 8.8 7.98 -9.31
Table 2. O2 production rate measurement vs. model
With following additional data:
- Mean quadratic error of correlated model 1 : 0.765 mmol/h - Maximum absolute error of correlated model 1: 0.99 mmol/h
- Validity of correlation (biomass range): 1.17 g/L, light intensity 20-50 W/m2
As expected, the calculated value εPBR is close to unity, meaning that the uncorrelated model has already a fairly
good (and in some cases already acceptable) level of representation of the system behaviour in terms of O2
production predictability. With the correlated model, the prediction error is expected to be around 5%. around the nominal design point (6.75 mmol/h target continuous production).
V. Conclusion
The results achieved with the BRT1 OBD BBM are very goods. The life test duration of 27 days exceeded by far the initial duration objective of 15 days. The performance in term of O2 production rate and biomass concentration
operation range have been demonstrated during the tests. The observation of cyanobacteria under microscope and the evolution of their average size over the entire experiment shows that the BBM design does not generate excessive shear stress to the biomass, (including the Gas Exchange Module), therefore the design is suitable for long term operation.
The measured Biomass-O2 Production Correlation and the Light intensity-O2 production model are consistent
with the literature. This validate the growth-model used by RUAG so far in order to design the BRT1 OBD. The consolidation of this growth model is a mandatory step in order to have an autonomous control system of the BRT1 process. Future works aim to upgrade the present BBM design with additional OBD demonstrator functionalities such as an automated control of O2/biomass production rate, automated control of the harvesting (Solid Loop), and a
life test duration up to 90 days.
Acknowledgments
The authors would thank the followings persons for their contributions to the success of this BBM biological test campaign: Mickael Miler, Christophe Modoux from RUAG, Alicia Dahuron from UCA & Dries Demey from Qinetiq Space.
References
Periodicals1. Cogne, G., Lehmann, B., Dussap, C.-G., and Gros, J.-B., “Uptake of macrominerals and trace elements by the
cyanobacterium Spirulina platensis (Arthrospira platensis PCC8005) under photoautotrophic conditions: Culture medium optimization. “ Biotechnol. Bioeng Vol. 81, 2003, pp. 588–593.
2.
Farges, B., Laroche, C., Cornet, J-F., and Dussap, C-G., “Spectral Kinetic Modeling and Long-Term Behavior Assessment of Arthrospira platensis Growth in Photobioreactor Under Red (620 nm) Light Illumination,” Biotechnology Progress, 9 Jan 2009, pp. 151-162.
3. Hendrickx, L., De Wever, H., Hermans, V., Mastroleo, F., Morin, N., Wilmotte, A., Janssen, P., and Mergeay, M.,
“Microbial ecology of the closed artificial ecosystem MELiSSA (Micro-Ecological Life Support System Alternative): Reinventing and compartmentalizing the Earth’s food and oxygen regeneration system for long-haul space exploration missions. Research in Microbiology”, Space Microbiology, Vol. 157, 2006, pp. 77–86
4. Kacena, M.A., Merrell, G.A., Manfredi, B., Smith, E.E., Klaus, D.M., and Todd, P., “Bacterial growth in space flight:
logistic growth curve parameters for Escherichia coli and Bacillus subtilis”. Appl Microbiol Biotechnol, Vol. 51, 1999, pp. 229– 234.
5. Lasseur, C., Brunet, J., Weever, H. de, Dixon, M., Dussap, G., Godia, F., Leys, N., Mergeay, M., and Straeten, D.V.D.,
“MELiSSA: The European project of Closed Life Support System”, Gravitational and Space Research, Vol. 23, 2010.
6. Niederwieser, T., Kociolek, P., and Klaus, D., “A review of algal research in space”, Acta Astronautica, Vol. 146, 2018,
pp. 359–367.
7. Poughon, L., Laroche, C., Creuly, C., Dussap, C-G., Paille, C., Lasseur, C., Monsieurs, P., Heylen, W., Coninx, I.,
Mastroleo, F., and Leys, N., "Limnospira indica PCC8005 growth in photobioreactor: model and simulation of the ISS and ground experiments", Life Sciences in Space Research, Vol. 25, 2020, pp. 53-65,
8.
Walker, J., and Granjou, C.,“MELiSSA the minimal biosphere: Human life, waste and refuge in deep space”, Futures, Vol. 92, 2017, pp. 59–69.
9.
Walther, I., Bechler, B., Müller, O., Hunzinger, E., and Cogoli, A., “Cultivation of Saccharomyces cerevisiae in a bioreactor in microgravity”, Journal of Biotechnology, Biology Under Microgravity Conditions in Spacelab IML-2, Vol. 47, 1996, pp. 113–127.
Proceedings
10. Demey, D., Hermans, V., Cornet, J., Leclercq, J., Lasseur, C., Delahaye, A., "BIORAT: Preliminary Evaluation of
Biological Life Support in Space Environment," SAE Technical Paper 2000-01-2384, 2000, https://doi.org/10.4271/2000-01-2384.
11. Chapuis, D., Nebuloni, S., Dainesi, P., Gass, S., Laroche, C., Duchez, D. Dussap, C-G., Demey, D., Delahaye, A., Gerbi,
O., and Paillé, Cl. “BIORAT: Oxygen Recycling between an Algae Photo-bioreactor and a Consumer.”, joint Agrospace-MELISSA Workshop, May 2018
Reports, Theses, and Individual Papers
12. Cornet, J-F. “Etude cinétique et énergétique d’un photobioréacteur. Etablissement d’un modèle structuré. Applications à
un écosystème clos artificiel, ” PhD thesis, 1992, Université Paris XI.
13. Cornet, J-F., “Procédés Limités par le Transfert de Rayonnement en Milieu Hétérogène,” Université Blaise Pascal -
Clermont-Ferrand II, 2007, pp.295-296 Electronic Publications
14. NASA,
"International Space Station Environmental Control and Life Support System" (PDF), http://www.nasa.gov/centers/marshall/pdf/104840main_eclss.pdf Retrieved 25 January 2010.