HAL Id: hal-02537032
https://hal.umontpellier.fr/hal-02537032
Submitted on 8 Apr 2020
HAL is a multi-disciplinary open access
archive for the deposit and dissemination of
sci-entific research documents, whether they are
pub-lished or not. The documents may come from
teaching and research institutions in France or
abroad, or from public or private research centers.
L’archive ouverte pluridisciplinaire HAL, est
destinée au dépôt et à la diffusion de documents
scientifiques de niveau recherche, publiés ou non,
émanant des établissements d’enseignement et de
recherche français ou étrangers, des laboratoires
publics ou privés.
lipids storage and insulin sensitivity via CHOP10
mRNA regulation
O Fabre, T. Salehzada, Karen Lambert, Y Boo Seok, A Zhou, Jacques
Mercier, Catherine Bisbal
To cite this version:
O Fabre, T. Salehzada, Karen Lambert, Y Boo Seok, A Zhou, et al.. RNase L controls terminal
adipocyte differentiation, lipids storage and insulin sensitivity via CHOP10 mRNA regulation. Cell
Death and Differentiation, Nature Publishing Group, 2012, 19, pp.1470 - 1481. �10.1038/cdd.2012.23�.
�hal-02537032�
RNase L controls terminal adipocyte differentiation,
lipids storage and insulin sensitivity via CHOP10
mRNA regulation
O Fabre
1, T Salehzada
1, K Lambert
1, Y Boo Seok
2, A Zhou
2, J Mercier
1,2,3and C Bisbal*
,1Adipose tissue structure is altered during obesity, leading to deregulation of whole-body metabolism. Its function depends on
its structure, in particular adipocytes number and differentiation stage. To better understand the mechanisms regulating
adipogenesis, we have investigated the role of an endoribonuclease, endoribonuclease L (RNase L), using wild-type and RNase
L-knockout mouse embryonic fibroblasts (RNase L
!/!-MEFs). Here, we identify C/EBP homologous protein 10 (CHOP10), a
dominant negative member of the CCAAT/enhancer-binding protein family, as a specific RNase L target. We show that RNase L
is associated with CHOP10 mRNA and regulates its stability. CHOP10 expression is conserved in RNase L
!/!-MEFs, maintaining
preadipocyte state while impairing their terminal differentiation. RNase L
!/!-MEFs have decreased lipids storage capacity,
insulin sensitivity and glucose uptake. Expression of ectopic RNase L in RNase L
!/!-MEFs triggers CHOP10 mRNA instability,
allowing increased lipids storage, insulin response and glucose uptake. Similarly, downregulation of CHOP10 mRNA with
CHOP10 siRNA in RNase L
!/!-MEFs improves their differentiation in adipocyte. In vivo, aged RNase L
!/
!mice present an
expanded adipose tissue, which, however, is unable to correctly store lipids, illustrated by ectopic lipids storage in the liver and
in the kidney. These findings highlight RNase L as an essential regulator of adipogenesis via the regulation of CHOP10 mRNA.
Cell Death and Differentiation (2012) 19, 1470–1481; doi:10.1038/cdd.2012.23; published online 23 March 2012
In the past 50 years, the incidence of obesity and related
metabolic disorders has increased markedly, reaching a
worldwide epidemic scale. Obesity is associated with several
health problems, including insulin resistance, type 2 diabetes,
fatty liver disease, atherosclerosis, degenerative disorders,
airway diseases and some cancers.
Obese individuals suffer from a higher adiposity level
resulting from an increased adipocytes number (hyperplasia)
and/or size (hypertrophy).
1Adipose tissue is involved in
metabolic regulation and particularly lipids storage, insulin
sensitivity and glucose uptake.
2It has therefore a central role
in controlling whole-body glucose and lipids homeostasis.
Adipose tissue functions depend on its structure defined
by adipocytes number and differentiation stage; this structure
is altered during obesity.
3Understanding the mechanisms
implicated in the regulation of adipocyte differentiation should
help elucidate adipose tissue development and its link to
metabolic diseases.
After activation by various factors, such as hormones,
adipogenesis occurs in successive phases leading from
preadipocytes to mature adipocytes. Particularly, the
expan-sion phase of preadipocytes precedes their differentiation to
adipocytes.
4,5Like other differentiation pathways,
adipogen-esis involves sequential and orderly expression of many
factors triggering a whole activation/inactivation cascade of
genes expression. Among the several transcription factors
known to have a significant role in promoting adipogenesis,
two of them have a central role by regulating several
downstream target genes: the CCAAT/enhancer-binding
protein
a (C/EBPa) and the nuclear receptor peroxisome
proliferator-activated receptor
g2 (PPARg2). C/EBPa and
PPAR
g2 expression and activity are required for the adipose
tissue development, insulin sensitivity and maintenance of
mature adipocyte functions, such as triglycerides synthesis
and storage. Their expression is closely regulated at different
levels; in particular, their transcription is regulated by other
members of the C/EBP family (
b,d),
6which expression
precedes the induction of C/EBP
a and PPARg2. Terminal
adipogenesis is also regulated by another C/EBP family
member named C/EBP homologous protein 10 (CHOP10).
By forming heterodimers with other C/EBPs, CHOP10
functions as a dominant negative member of the C/EBP
family. In preadipocytes, it forms a heterodimer with C/EBP
b,
inhibiting its DNA-binding activity. This inhibition of C/EBP
b is
Received 16.8.11; revised 03.2.12; accepted 08.2.12; Edited by H-U Simon; published online 23.3.12
1U1046 Physiologie et me´decine expe´rimentale du cœur et des muscles-INSERM-Universite´ Montpellier 1-Universite´ Montpellier 2, Montpellier, France;2Department of
Chemistry, Cleveland State University, Cleveland, OH, USA and3CHRU Montpellier, De´partement de Physiologie Clinique, Montpellier, France
*Corresponding author: C Bisbal, U1046 Physiologie et me´decine expe´rimentale du cœur et des muscles-INSERM-Universite´ Montpellier 1-Universite´ Montpellier 2, Montpellier 34295, France. Tel: þ 33 467 415 217; Fax: þ 33 467 415 231; E-mail: Catherine.Bisbal@inserm.fr
Keywords: adipogenesis; CHOP10; RNase L; insulin response
Abbreviations: aP2, adipocyte protein 2; C/EBP, CCAAT/enhancer-binding protein; CHOP10, C/EBP homologous protein 10; DMEM, Dulbecco’s modified eagle medium; EEF1a, eukaryotic elongation factor 1a; Fabp4, fatty acid-binding protein 4; FCS, fetal calf serum; Glut4, glucose transporter 4; H&E, hematoxylin and eosin; MEFs, mouse embryonic fibroblasts; M-MLV, Moloney murine leukemia virus; 6-NBDG, 6-(N-(7-nitrobenz-2-oxa-1,3-diazol-4-yl) amino)-2-deoxy-glucose; NBT, nitroblue tetrazolium; OAS2, oligoadenylate synthetase 2; PPARg, peroxisome proliferator-activated receptor g; q-PCR, real-time quantitative PCR; RLI, RNase L inhibitor; RNase L, endoribonuclease L; ROS, reactive oxygen species; RT, reverse transcription; SDS-PAGE, sodium dodecyl sulfate-polyacrylamide gel electrophoresis
necessary for the expansion phase of preadipocytes before
terminal differentiation.
7Thus, downregulation of CHOP10
allows C/EBP
b release and the transactivation of C/EBPa and
PPAR
g, which expression is essential for terminal adipocyte
differentiation and the expression of most genes
characteriz-ing fat cells.
7Moreover, CHOP10 has been implicated in the
production of reactive oxygen species (ROS),
8important
regulators of adipocyte differentiation and insulin response.
9As now demonstrated by several studies, an essential
mechanism of gene expression control is through mRNA
stability regulation.
10,11One nuclease firmly implicated in
cellular mRNA stability is the endoribonuclease L (RNase
L).
12RNase L is an ubiquitous endoribonuclease, which
activity is strictly dependent on an oligoadenylate, the 2-5A,
synthesized by the 2-5A synthetase(s).
12,13RNase L
reg-ulates mRNAs stability during their translation and its activity
is negatively regulated by RLI (RNase L inhibitor).
14–16We
have previously shown that RNase L and its inhibitor RLI are
induced during differentiation and control gene expression
and cell fate during myogenesis.
11,17Transcriptome analysis
of myoblasts overexpressing RNase L allowed us to identify
some mRNA targets of RNase L, among which CHOP10
mRNA.
11As CHOP10 is a conductor of adipogenesis,
7we
were interested in studying the role of RNase L in
adipogen-esis and insulin sensitivity. Hence, we used wild-type (WT)
and
RNase
L-knockout
mouse
embryonic
fibroblasts
(MEFs),
18adipogenesis of MEFs induced by hormonal
treatment being a well-established model system for the
study of adipocyte differentiation.
19Here, we show that
RNase L directly regulates CHOP10 mRNA. Indeed, we
demonstrate that RNase L is associated with CHOP10 mRNA
and controls CHOP10 expression by regulating its mRNA
stability. As CHOP10 expression is maintained after induction
of adipocyte differentiation in RNase L
!/!-MEFs, this leads
to the impairment of terminal adipocyte differentiation, the
decrease in insulin sensitivity and glucose uptake, and to
increased ROS production. Conversely, expression of ectopic
human RNase L (Hu-RNase L) or transfection of
CHOP10-siRNA (siCHOP) in RNase L
!/!-deficient cells triggers
CHOP10 mRNA instability, decreases ROS level and allows
an increase in lipids storage, insulin response and glucose
uptake. Consolidating these results, RNase L
!/!mice present
an expansion of their adipose tissue (hyperplasia) and a
defect in lipids storage. Our results highlight RNase L as an
essential regulator of the adipogenesis processes and insulin
response by regulating CHOP10 mRNA stability.
Results
Lack of RNase L impairs adipogenesis. MEFs are
interesting cell models to study the specific role of a factor
during adipogenesis, as they can differentiate into mature
adipocytes after hormonal stimulation.
19To explore RNase L
function during adipogenesis at a molecular level, we
used WT-MEFs and RNase L-knockout MEFs (RNase
L
!/!-MEFs).
18RNase L
!/!-MEFs did not express mouse RNase L protein,
as the first exon of RNase L gene was deleted in the RNase
L
!/!mouse.
18However, these cells expressed an equivalent
level of RLI as WT-MEFs (Figure 1A). WT-MEFs and RNase
L
!/!-MEFs present the same viability under our experimental
conditions, as shown in Figure 1B.
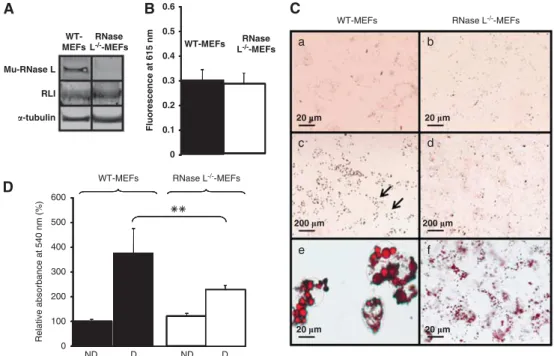
First, we compared lipids accumulation in WT-MEFs and
RNase L
!/!-MEFs before and after adipocyte differentiation.
If WT-MEFs and RNase L
!/!-MEFs both increased their lipids
content after differentiation (Figure 1C, compare a and e to b
and f, respectively), their lipids staining with oil red O showed a
very different pattern. Indeed, when observed at a lower
magnification, lipids staining in WT-MEFs was not uniform,
small groups of highly labeled cells being separated by
unlabeled cells (Figure 1C, c). On the other hand, lipids
staining in RNase L
!/!-MEFs revealed a low but uniform
labeling of cells, indicating that more cells accumulated lipids
(Figure 1C, d). However, observation of lipids staining
at a greater magnification showed that RNase L
!/!-MEFs
accumulated smaller lipid droplets than WT-MEFs (Figure 1C,
compare e and f). This difference in lipids accumulation was
confirmed by quantification: RNase L
!/!-MEFs accumulated
1.7 time lesser lipids than WT-MEFs (Figure 1D). This
impairment in lipids storage, a major adipocyte function, was
confirmed by studying expression of two proteins specifically
expressed in mature adipocytes: adipocyte protein 2 (aP2)/
fatty acid-binding protein 4 (Fabp4), involved in intracellular
lipids trafficking,
20and perilipin, a lipid droplet-associated
protein
21(Figure 2A). As illustrated in Figure 2A, aP2/Fabp4
is less expressed in RNase L
!/!-MEFs than in WT-MEFs
(compare Figure 2A, a and b). Surprisingly, even if we
observed an increase in lipids accumulation after
differentia-tion of RNase L
!/!-MEFs (Figures 1C and D), we were unable
to detect perilipin surrounding lipid droplets in these cells
(compare Figure 2A, c and d). The same result was obtained
by western blot, using an anti-perilipin antibody (data
not shown). These results indicated impairment in lipids
accumulation and storage in RNase L
!/!-MEFs.
Genes expression during adipocyte differentiation.
Adipogenesis involves a differentiation switch that activates
a new program of gene expression. As previously shown
during myoblast differentiation,
11RNase L activity is induced
throughout adipocyte differentiation of WT-MEFs. Indeed,
OAS2 (oligoadenylate synthetase 2) mRNA is induced
(Figures 2B and C); OAS2 synthesizes the 2-5A allowing
RNase L activation.
12,13In parallel, RLI mRNA expression is
decreased 6 days after induction of adipocyte
differen-tiation. To explore the molecular basis through which RNase
L deficiency impairs adipogenesis, we also followed
expression levels of mRNAs coding for factors involved in
adipogenesis (C/EBP
a, CHOP10 and PPARg2), lipids
metabolism (aP2/Fabp4) and insulin response (Glut4:
glucose transporter 4; Figures 2B and C). The expression
profiles of these mRNAs during the differentiation were
modified in RNase L
!/!-MEFs compared with WT-MEFs.
Induction of C/EBP
a, aP2/Fabp4 and PPARg2 was much
lower in RNase L
!/!-MEFs. Importantly, Glut4 mRNA was
not induced in the absence of RNase L but increased
410
times in WT-MEFs. Contrarily, CHOP10 mRNA expression
was maintained at a high level during the differentiation in
RNase L
!/!-MEFs as it declined
470% in WT-MEFs from
confluence to day 6 of differentiation (Figures 2B and C).
ROS production. In RNase L
!/!-MEFs, we noted a higher
CHOP10 expression than in WT-MEFs (Figures 2B and C).
This constant expression of CHOP10 could favor increased
ROS production.
22,23Indeed, as shown in Figure 2D, the
level of ROS was significantly higher in RNase L
!/!-MEFs
compared with WT-MEFs.
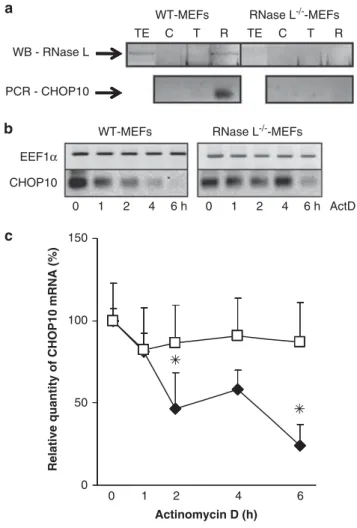
RNase L is associated with CHOP10
messenger-ribonucleoprotein
complex
(mRNP)
and
regulates
CHOP10 mRNA stability. We were particularly interested
in the differential CHOP10 mRNA expression that we noticed
between WT-MEFs and RNase L
!/!-MEFs, CHOP10 being,
as described in the introduction, an essential regulator of
adipogenesis. RNase L has no great sequence specificity
and cleaves single-stranded RNA at UpNp sequences.
12Moreover, RNase L has no specific RNA recognition motif
sequence allowing its direct interaction with mRNA.
However, we have previously shown that RNase L could
participate to mRNPs via its interaction with RNA-binding
proteins.
15To analyze if RNase L is associated with mRNP
containing
CHOP10
mRNA,
we
immunoprecipitated
cytoplasmic mRNPs with a specific monoclonal antibody
raised against RNase L in RNase L
!/!-MEFs and WT-MEFs
cell extracts. By real-time quantitative PCR (q-PCR), we
could specifically amplify and detect CHOP10 mRNA in the
mRNPs immunoprecipitated with a specific antibody against
RNase L (Figure 3a). The presence of RNase L protein
associated with CHOP10 mRNA was only observed in
WT-MEFs and no interaction between RNase L and
CHOP10 mRNA could be identified without any antibody or
using an irrelevant antibody (
a-tubulin; Figure 3a). These
results confirmed the specificity of the constated interaction.
To confirm that RNase L regulates CHOP10 mRNA stability,
we then compared CHOP10 mRNA stability in WT-MEFs
and RNase L
!/!-MEFs after transcription inhibition by the
actinomycin D treatment. In RNase L
!/!-MEFs, we clearly
observed a stabilization of CHOP10 mRNA compared with
WT-MEFs (Figures 3b and c).
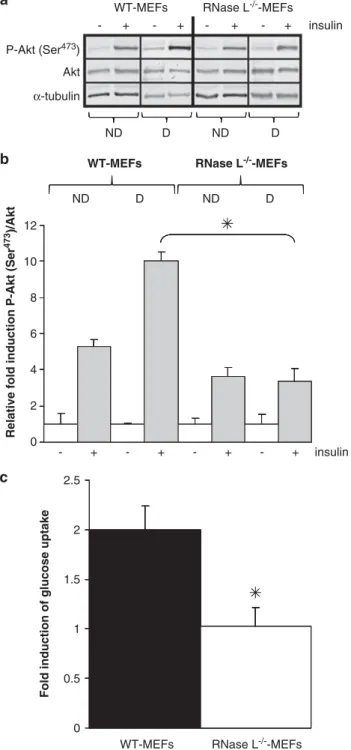
Insulin response. RNase L
!/!-MEFs presented altered
adipocyte properties such as lipids accumulation (Figures
1C, D and 2A), Glut4 expression (Figures 2B and C) and a
higher ROS level (Figure 2D) compared with WT-MEFs.
All these features are indicative of lower insulin response in
RNase L
!/!-MEFs. So we measured Akt phosphorylation at
serine 473 (Ser
473) before and after insulin treatment of
WT-MEFs and RNase L
!/!-MEFs. Akt phosphorylation was
significantly lower in RNase L
!/!-MEFs than in WT-MEFs
(Figures 4a and b). Akt phosphorylation is crucial for the
intracellular signal transduction of insulin leading to glucose
uptake by adipocytes.
24Measurement of glucose uptake in
RNase L
!/!-MEFs also showed a defect in insulin response
of these cells compared with WT-MEFs (Figure 4c). Indeed,
no increase in glucose uptake after insulin treatment of
RNase L
!/!-MEFs was observed while it was increased two
times in WT-MEFs after insulin treatment. Glucose uptake
WT-MEFs Mu-RNase L RLI !-tubulin Fluorescence at 615 nm 0 0.1 0.2 0.3 0.4 0.5 0.6 WT-MEFsWT-MEFs RNase L-/--MEFs
20 "m 20 "m 200 "m 200 "m 20 "m 20 "m ND WT-MEFs 0 100 200 300 400 500 600 Relative absorbance at 540 nm (%) RNase
L-/--MEFs LRNase-/--MEFs
RNase L-/--MEFs D ND D a b c d e f
Figure 1 RNase L and RLI expression, viability and lipids accumulation in WT-MEFs and RNase L!/!-MEFs. (A) WT-MEFs and RNase L!/!-MEFs proteins were analyzed by western blot with antibodies against mouse RNase L and mouse RLI.a-tubulin antibody was used as an indicator of proteins quantity loading. (B) Cells viability was measured in WT-MEFs and RNase L!/!-MEFs by measuring fluorescence emission at 615 nm of PrestoBlue reagent reduced by living cells. Error bars refer to the S.D. obtained in four independent experiments. (C) WT-MEFs and RNase L!/!-MEFs were induced to differentiate in ADM. Cells were fixed and stained with oil red O to reveal lipids accumulation at day 0 (a and b) and after 6 days of differentiation (c–f). Cells were observed at a magnification of # 40 (a, b, e and f) or # 5 (c and d). Arrows in (c) indicate groups of differentiated cells observed at upper magnification in e. (D) After staining with oil red O, lipids were quantified in WT-MEFs and RNase L!/!-MEFs at day 0 (ND) and day 6 after induction of adipocyte differentiation (D) by spectrophotometric analysis at 540 nm, following elution of cell retained oil red O with ethanol. The amount of lipids in WT-MEFs at day 0, was set to 100%. Error bars refer to the S.D. obtained in four independent experiments conducted in duplicate. **P ¼ 0.009 RNase L!/!-MEFs compared with WT-MEFs at day 6
was equivalent in WT-MEFs and RNase L
!/!-MEFs without
insulin treatment (data not shown). This basal glucose
uptake in the absence of insulin would be due to Glut1
activity, being that WT-MEFs and RNase L
!/!-MEFs
expressed similarly this glucose receptor (data not shown).
Ectopic expression of RNase L in RNase L
!/!-MEFs
restored terminal adipocyte differentiation. To verify that
the impairment of adipocyte differentiation observed in
RNase L
!/!-MEFs was specifically due to the absence of
RNase L, we generated RNase L
!/!-MEFs-based stable cell
lines by transfection with an empty pcDNA3 vector (V-RNase
L
!/!-MEFs) or with a vector containing Hu-RNase L
complementary
DNA
(cDNA;
Hu-RNase
L
!/!-MEFs;
Figure 5a).
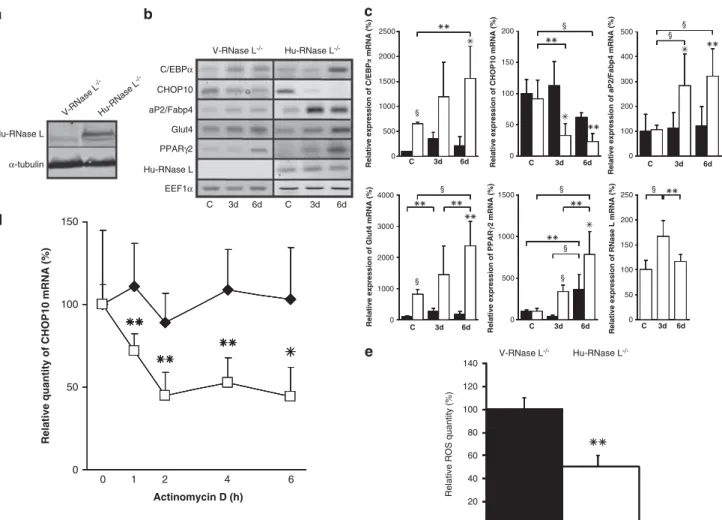
Interestingly, ectopic expression of RNase L restored high
expression of C/EBP
a, aP2/Fabp4, PPARg2 and Glut4 mRNA
during adipocyte differentiation of Hu-RNase L
!/!-MEFs.
Moreover, RNase L expression led to a decreased CHOP10
mRNA level during differentiation of these cells (Figures 5b
and c). Actinomycin D experiments in V-RNase L
!/!-MEFs
and Hu-RNase L
!/!-MEFs confirmed that this downregulation
of CHOP10 mRNA was due to a decrease of its stability
(Figure 5d). Beside, this lower CHOP10 mRNA level was
accompanied by a reduced ROS level (Figure 5e). Moreover,
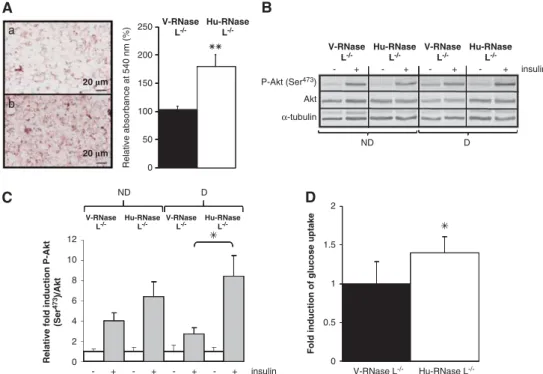
lipids accumulation (Figure 6A), insulin response (Figures 6B
and C) and glucose uptake (Figure 6D) were also significantly
14000 § § § § § § § 0
Relative expression of Glut4
mRNA (%) 100 200 § § 10000 12000 0 200 400 600 800 1000
Relative expression of PPAR
# 2 mRNA (%) 0 500 1000 1500 2000 2500
Relative expression of aP2/Fabp4
mRNA (%) 0 50 100 150
Relative expression of CHOP10
mRNA (%) 0 500 1000 1500
Relative expression of C/EBP
! mRNA (%) 0 50 100 150
Relative expression of RLI
mRNA (%) 0 50 100 150 200 250 300 350
Relative expression of OAS2
mRNA (%) 0 100 200 300
Relative expression of RNase L
mRNA
(%)
WT-MEFs
20 "m 20 "m
20 "m 20 "m
RNase L-/--MEFs RNase
L-/--MEFs a WT-MEFs NE C/EBPα aP2/Fabp4 PPARγ2 RLI RNase L OAS2 Glut4 EEF1α CHOP10
Relative ROS quantity (%)
WT-MEFs RNase L-/--MEFs
0 20 40 60 80 100 120 140 160 180 200 § C 3d 6d C 3d 6d C 3d 6d C 3d 6d C 3d 6d C 3d 6d C 3d 6d C 3d 6d C 3d 6d C 3d 6d b c d
Figure 2 RNase L deficiency impairs adipocyte functions. (A) WT-MEFs and RNase L!/!-MEFs were induced to differentiate in ADM. Cells were fixed at day 6 after induction of adipocyte differentiation and then incubated with an antibody against aP2/Fabp4 (red; WT-MEFs, (a) and RNase L!/!-MEFs, (b) and perilipin (red; WT-MEFs, (c) and RNase L!/!-MEFs, (d)). DNA was stained with DAPI (blue). Cells were observed at a magnification of # 40. Arrow in (c) indicates perilipin surrounding lipid droplets. (B) Confluent WT-MEFs and RNase L!/!-MEFs were induced to differentiate in ADM. mRNAs were extracted at confluence (C) and at days 3 (3d) and 6 (6d) after switch to ADM. Following RT and PCR amplification using specific primers (Supplementary Table 1), PCR products were analyzed on 1.2% agarose gel. Pictures of the gels are shown. NE, non expressed. (C) After RT, mRNA expression was then measured by q-PCR. Sample data were analyzed according to the comparative cycle threshold method and were normalized by stable reference expression of EEF1a gene. For each mRNA, the level of expression at confluence was set at 100% in WT-MEFs allowing on one side a comparison between WT-MEFs (black bars) and RNase L!/!-MEFs (white bars) for each phase of the differentiation and, on the other side, a comparison between the different phases of the differentiation in each cell line. Error bars refer to the S.D. obtained in four independent experiments conducted in duplicate. *Pr0.05, **Pr0.01 and yPr0.001. (D) ROS level was measured by NBT reduction in WT-MEFs and RNase L!/!-MEFs at confluence. Data are expressed relative to ROS level in WT-MEFs, which was set at 100%. Error bars refer to the S.D. obtained in three independent experiments conducted in duplicate.yPr0.001 ROS level in RNase L!/!-MEFs compared with WT-MEFs
improved in Hu-RNase L
!/!-MEFs compared with V-RNase
L
!/!-MEFs in differentiated cells.
Downregulation of CHOP10 mRNA in RNase L
!/!-MEFs
improves their adipocyte differentiation. To confirm that
regulation of CHOP10 expression by RNase L is key for
adipocyte differentiation, we then downregulated expression
of CHOP10 mRNA by siCHOP in RNase L
!/!-MEFs. RNase
L
!/!-MEFs were transfected with siCHOP or a control siRNA
(siCT) before induction of differentiation. Only a certain
percentage of the cells population was transfected by the
siCHOP, as checked by using a fluorescent siRNA (data
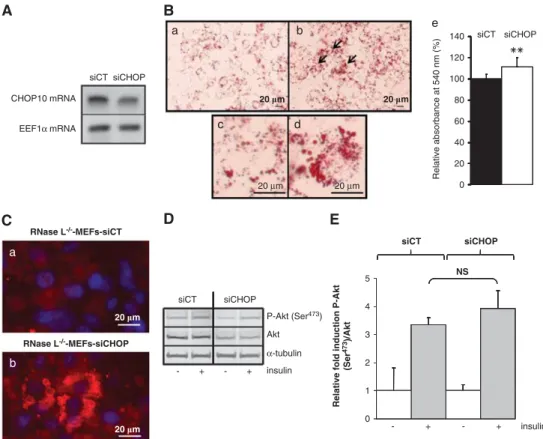
not shown). However, we could observe a downregulation of
CHOP10 mRNA in RNase L
!/!-MEFs transfected with
siCHOP compared with RNase L
!/!-MEFs transfected with
siCT (Figure 7A). This allowed a better terminal adipocyte
differentiation of RNase L
!/!-MEFs, as demonstrated by an
increase in lipids accumulation and the detection of perilipin
surrounding lipid droplets in RNase L
!/!-MEFs transfected
with siCHOP compared with RNase L
!/!-MEFs transfected
with siCT (Figures 7B and C). We also observed a slight
improvement in insulin response, as shown by a small
increase of Akt phosphorylation at Ser
473in RNase L
!/!-MEFs transfected with siCHOP compared with RNase L
!/!-MEFs transfected with siCT (Figures 7D and E). However,
this result was not statistically significant. The latter could be
because of the difficulty to obtain sufficient cells transfected
with siCHOP. Nevertheless, these results clearly showed
that CHOP10 mRNA downregulation is necessary to allow
complete adipocyte differentiation of MEFs.
Discussion
Adipose tissue has a central role in metabolic regulations,
partly due to its capacity to store lipids. Adipogenesis is
controlled by several functionally coherent mechanisms,
which are intricately coordinated and regulated in time to
ensure the activation/inactivation cascade of genes
expres-sion. The transition from preadipocyte to mature adipocyte
involves successive stages: growth arrest, clonal expansion
and differentiation. The clonal expansion phase is necessary
for terminal differentiation. These different steps are
pre-dominantly regulated by C/EBP family members and PPAR
g.
Regulation of mRNA stability is an essential mechanism for
controlling genes expression.
10,11Cytoplasmic mRNAs are
engaged in mRNA/proteins complexes called mRNPs, which
have a major role in mRNA translation and stability.
25Here,
we show that an endoribonuclease, RNase L, directly
regulates mRNA stability of CHOP10, a member of the
C/EBP family and a fundamental regulator of adipogenesis.
RNase L has no great sequence specificity and cleaves
single-stranded RNA at UpNp sequences.
12RNase L
speci-ficity is above all due to its interaction with transacting factors,
such as eukaryotic releasing factor 3
15and mitochondrial
initiation factor 2.
16In this study, we show for the first time that
RNase L interacts with CHOP10 mRNA in mRNPs. Indeed, a
specific monoclonal antibody directed against RNase L
immunoprecipitated RNase L protein associated with
CHOP10 mRNA only in WT-MEFs, while no RNase
L-CHOP10 mRNA interaction was detected in RNase L
!/!-MEFs. Association of RNase L with CHOP10 mRNA in mRNP
enables CHOP10 mRNA regulation by RNase L, as illustrated
by the preservation of CHOP10 mRNA expression in RNase
L
!/!-MEFs when it strongly decreases in WT-MEFs during
adipocyte differentiation.
CHOP10 interacts with another member of the C/EBP
family, C/EBP
b, by inhibiting its transcriptional activity. This
EEF1α CHOP10 ActD WT-MEFs 0 50 100 150 Actinomycin D (h)
Relative quantity of CHOP10 mRNA (%)
RNase L-/--MEFs RNase L-/--MEFs WT-MEFs WB - RNase L PCR - CHOP10 TE C T R TE C T R 0 1 2 4 6 h 0 1 2 4 6 h 6 4 2 1 0
Figure 3 RNase L is associated with CHOP10 mRNP and specifically degrades CHOP10 mRNA. (a) CHOP10 mRNA interaction with RNase L was evaluated by RNPs immunoprecipitation in WT-MEFs and RNase L!/!-MEFs. Upper panel represents western blot analysis with an antibody against RNase L of total cell extract (TE), and RNPs immunoprecipitated with no antibody (C), anti-a-tubulin antibody (T) or anti-RNase L antibody (R). Lower panel represents CHOP10 mRNA expression after RNAs extraction from RNPs immunoprecipitated with no antibody (C), anti-a-tubulin antibody (T) or anti-RNase L antibody (R) and after RT then q-PCR amplification with specific CHOP10 mRNA primers (Supplementary Table 1). q-PCR products were analyzed on 1.2% agarose gel. Photographies of the gels are shown. RNPs immunoprecipitation in WT-MEFs and RNase L!/!-MEFs, followed by western blot analysis, RT and q-PCR was realized on two independent experiments. (b) WT-MEFs and RNase L!/!-MEFs were treated with actinomycin D, then cells were collected at the indicated time points and mRNAs were analyzed, after RT, by PCR amplification with specific primers of EEF1a and CHOP10. PCR products were analyzed on 1.2% agarose gel. Pictures of the gels are shown. (c) cDNAs obtained for analysis of mRNA stability after the actinomycin D treatment were then used for quantification by q-PCR. Sample data were analyzed according to the comparative cycle threshold method and were normalized by stable reference expression of EEF1a gene. Levels of CHOP10 mRNA expression were set at 100% at time 0 in WT-MEFs (E) and RNase L!/!-MEFs (&). Error bars refer to the S.D. obtained in four independent experiments conducted in duplicate. *Pr0.05
inhibition is necessary for clonal expansion of preadipocytes,
a prerequisite to adipocyte differentiation.
7As CHOP10
expression decreases, C/EBP
b is released, allowing
trans-activation of C/EBP
a and terminal adipocyte differentiation.
Maintaining CHOP10 expression could lead to an excessive
clonal expansion (hyperplasia), at the expense of late
differentiation and lipids storage capacity of mature
adipo-cytes. Here, we show that terminal adipocyte differentiation is
impaired in RNase L
!/!-MEFs. In fact, these cells
accumu-lated fewer lipids than WT-MEFs. Moreover, RNase L
!/!-MEFs expressed a lower level of aP2/Fabp4, indicating a
dysfunction of intracellular lipids trafficking.
20Beside, we
failed to detect perilipin at the surface of lipid droplets of
RNase L
!/!-MEFs. In RNase L
!/!-MEFs, CHOP10
expres-sion was maintained even after induction of differentiation,
leading to lower induction of C/EBP
a and PPARg2 expression.
Therefore, as terminal adipocyte differentiation could not
correctly proceed, we observed more adipocytes with small
lipid droplets while lipids accumulation, Glut4 mRNA
expres-sion and insulin response were lower in these cells than in
WT-MEFs. On the other hand, it has been shown in different
cell systems that overexpression of CHOP10 leads to an
increased ROS production.
26ROS, in turn, could induce
CHOP10 expression.
27Actually, in RNase L
!/!-MEFs cells,
we noticed an increase in ROS level. Several studies relating
to the consequences of ROS production have been performed
and contradicting effects have been reported. Some studies
describe ROS as positive regulators of adipocyte
differentia-tion by accelerating mitotic clonal expansion
28and enhancing
insulin sensitivity.
29Conflictingly, other studies present
ROS as inhibitors of adipocyte differentiation by regulating
CHOP10 expression
27and inhibiting insulin response
22and
Glut4 expression.
30The apparent discrepancies between
these different studies reflect how the level and kinetics of
ROS expression have vital effects on cell fate.
9Here, we
showed higher ROS level in RNase L
!/!-MEFs with a
decrease in insulin signaling, which participated in
insulin-stimulated glucose uptake inhibition. The lower level of Glut4
expression in RNase L
!/!-MEFs could also favor the
restricted glucose uptake.
To confirm the essential role of RNase L in CHOP10 mRNA
regulation and adipogenesis, we re-introduced RNase L
expression in RNase L
!/!-MEFs. In these cells, which express
Hu-RNase L (Hu-RNase L
!/!-MEFs), CHOP10 mRNA stability
was highly reduced compared with RNase L
!/!-MEFs
transfected with a control vector (V-RNase L
!/!-MEFs). This
also led to a decreased CHOP10 mRNA expression after
induction of adipocyte differentiation and to higher levels of C/
EBP
a, PPARg2, aP2/Fabp4 and Glut4 mRNAs expression.
Moreover, in Hu-RNase L
!/!-MEFs, ROS level were
de-creased by 50%, while lipids accumulation was inde-creased by
75%. Finally, insulin response and glucose uptake were also
significantly improved after re-expression of RNase L in
RNase L-/--MEFs RNase L-/--MEFs WT-MEFs P-Akt (Ser473) Akt α-tubulin 0 2 4 6 8 10 12
Relative fold induction P-Akt (Ser
473 )/Akt WT-MEFs insulin insulin 0 0.5 1 1.5 2 2.5
Fold induction of glucose uptake
- + - + - + - + D ND D ND D ND ND D - + - + - + - +
WT-MEFs RNase L-/--MEFs
Figure 4 Insulin response. (a) WT-MEFs and RNase L!/!-MEFs were treated ( þ ) or not (!) 10 min at 37 1C with insulin at confluence (ND) or after 6 days of differentiation (D). Total cellular extracts were analyzed by western blot with anti-P-Akt (Ser473), Akt and
anti-a-tubulin antibodies. (b) Protein bands shown in (a) were quantified with the ImageJ software. The levels of P-Akt (Ser473)/Akt were corrected with correspondinga-tubulin levels, used as indicator of proteins loading. P-Akt (Ser473)/Akt rate in WT-MEFs and RNase L!/!-MEFs before insulin treatment was set at 1. Error bars refer to the S.D. obtained in four independent experiments conducted in duplicate. *P ¼ 0.024 P-Akt (Ser473)/Akt level after insulin treatment in differentiated RNase L!/!-MEFs compared with WT-MEFs. (c) Glucose uptake was measured in WT-MEFs and RNase L!/!-MEFs. Differentiated cells were incubated ( þ ) or not (!) with insulin then medium was changed to DMEM without glucose and with 6-NBDG. After a 45-min incubation at 371C, fluorescence intensity of 6-NBDG was measured at 540 nm wavelength (465 nm excitation wavelength). Glucose uptake represents the ratio of fluorescence measured in basal condition (without insulin) and with insulin. Fluorescence values were normalized by cell number. Error bars refer to the S.D. obtained in three independent experiments conducted in duplicate. *P ¼ 0.011 insulin-stimulated glucose uptake level in differentiated RNase L!/!-MEFs compared with WT-MEFs
RNase L
!/!-MEFs. However, we could not completely
reverse RNase L
!/!-MEFs phenotype to WT-MEFs with
Hu-RNase L transfection. One reason could be that
transfected RNase L mRNA was not regulated as was the
endogenous RNase L mRNA in WT-MEFs. RNase L
expres-sion is constitutive in Hu-RNase L
!/!-MEFs, and RNase L
activity could only be regulated by OAS2 expression, 2-5A
synthesis and RLI.
To confirm the effects observed following the
overexpres-sion of CHOP10 on RNase L
!/!-MEFs differentiation
inhibi-tion, we downregulated CHOP10 mRNA in RNase L
!/!-MEFs
by CHOP10 siRNA (siCHOP) transfection. Even if not all cells
were transfected with siCHOP, we notified a significant
downregulation of CHOP10 mRNA expression, which was
accompanied by improved adipocyte differentiation. Our
results clearly identify RNase L as an essential effector of
terminal adipocyte differentiation by regulating CHOP10 level.
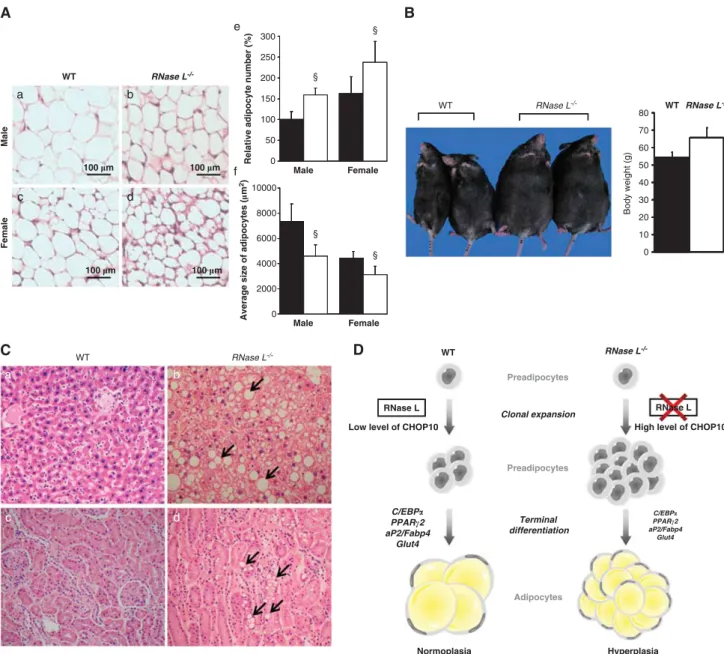
Maintaining a high level of CHOP10 expression in vivo
could lead to an excessive clonal expansion (hyperplasia) of
developing adipocytes at the expense of late differentiation
and lipids storage capacity of mature adipocytes.
5Actually,
RNase L
!/!mice possess a higher number of smaller
adipocytes than WT mice (Figure 8A), that is characteristic
of hyperplasia.
31This number of adipocytes increases with
aging, as we observed an adipose tissue expansion in aged
RNase L
!/!mice. The average body weight of aged RNase
Glut4 aP2/Fabp4 C/EBPα PPARγ2 CHOP10 EEF1α Hu-RNase L -/-V-RNase L -/-Hu-RNase L -/-V-RNase L -/-Hu-RNase L § § § § § § § § § § 0 100 200 300 400 500Relative expression of aP2/Fabp4 mRNA (%)
0 500 1000 1500 Relative expression of PPAR # 2 m R N A ( % ) 0 500 1000 1500 2000 2500
Relative expression of C/EBP
! m R N A ( % ) 0 50 100 150 200
Relative expression of CHOP10 mRNA (%)
0 1000 2000 3000 4000
Relative expression of Glut4 mRNA (%) 0
50 100 150 200 250
Relative expression of RNase L mRNA (%)
0 50 100 150
Actinomycin D (h)
Relative quantity of CHOP10 mRNA (%)
0 20 40 60 80 100 120 140
Relative ROS quantity (%)
Hu-RNase L V-RNase L -/-Hu-RNase L -/-α-tubulin 6d 3d C C 3d 6d 6d 3d C C 3d 6d C 3d 6d 6d 3d C C 3d 6d C 3d 6d 6 4 2 1 0
Figure 5 Ectopic expression of Hu-RNase L in RNase L!/!-MEFs. (a) Hu-RNase L expression was measured in V-RNase L!/!-MEFs (V-RNase L!/!) and Hu-RNase L!/!-MEFs (Hu-RNase L!/!) by western blot using a specific antibody against Hu-RNase L. (b) Confluent V-RNase L!/!-MEFs and Hu-RNase L!/!-MEFs were induced to differentiate in ADM. mRNAs were extracted at confluence (C) and at days 3 (3d) and 6 (6d) after switch to ADM. After RT and PCR amplification using specific primers (Supplementary Table 1), PCR products were analyzed on 1.2% agarose gel. Pictures of the gels are shown. (c) After RT, mRNA expression was measured by q-PCR. Sample data were analyzed according to the comparative cycle threshold method and were normalized by stable reference expression of EEF1a gene. For each mRNA, the level of expression at confluence was set at 100% in V-RNase L!/!-MEFs, allowing on one side a comparison between V-RNase L!/!-MEFs (black bars) and Hu-RNase L!/!-MEFs (white bars) for each phase of the differentiation and, on the other side, a comparison between the different phases of the differentiation in each cell line. Error bars refer to the S.D. obtained in four independent experiments conducted in duplicate. *Pr0.05, **Pr0.01 andyPr0.001. (d) At confluence, V-RNase L!/!-MEFs and Hu-RNase L!/!-MEFs were treated with actinomycin D, then cells were collected at the indicated time points and mRNA expression was quantified, after RT, by q-PCR. Sample data were analyzed according to the comparative cycle threshold method and were normalized by stable reference expression of EEF1a gene. Levels of CHOP10 mRNA expression were set at 100% at time 0 in V-RNase L!/!-MEFs (E) and Hu-RNase L!/!-MEFs (&). Error bars refer to the S.D. obtained in four independent experiments conducted in duplicate. *Pr0.05, **Pr0.01. (e) ROS level was measured by NBT reduction in V-RNase L!/!-MEFs and Hu-RNase L!/!-MEFs at confluence. Data are expressed relative to ROS level in V-RNase L!/!-MEFs, which was set at 100%. Error bars refer to the S.D. obtained in three independent experiments conducted in duplicate. **P ¼ 0.002 ROS level in Hu-RNase L!/!-MEFs compared with V-RNase L!/!-MEFs
L
!/!mice was 21% higher than that of aged WT mice
(Figure 8B). Despite this excessive adipose tissue
develop-ment, RNase L
!/!mice present a defect in lipids storage, as
indicated by ectopic fat depots in other organs, such as the
liver and the kidneys. Indeed, RNase L
!/!mice present
hepatic steatosis and lipid droplets within renal tubular
epithelial cell cytoplasms (Figure 8C). Interestingly, adipose
tissue expansion is observed in aged RNase L
!/!mice and
not in young mice. At present, it is known that CHOP10 is
more expressed in old individuals preadipocytes than from
young ones.
5Change in adipogenesis process is due to the
incapacity of preadipocytes to express appropriate levels of
key adipogenic regulators: CHOP10, C/EBP
a and PPARg.
4,32We assume that overexpression of CHOP10 in RNase L
!/!mice added to the physiological overexpression of CHOP10 in
old age would lead to even higher levels of CHOP10. In the
aged RNase L
!/!mice, this cumulative effect would increase
hyperplasia of adipose tissue at the expense of its terminal
differentiation and efficient lipids storage.
Interestingly, Tomaru et al.
33recently produced a
trans-genic mouse with decreased proteasomal chymotrypsin-like
activity. These mice overexpressed RNase L and presented a
loss of adipose tissue.
Here, we identify RNase L as a regulator of adipogenesis by
regulating CHOP10 mRNA stability. As cited above and
demonstrated in vivo by others, CHOP10 has a main role in
the regulation of adipose tissue expansion by controlling the
proliferation phase of preadipocytes. The decrease of RNase
L activity, through excessive CHOP10 expression could lead
to high preadipocytes proliferation (hyperplasia) and
impair-ment of their terminal differentiation. RNase L activity could be
crucial in the control of adipose tissue development and
function during obesity and aging; based on our results we
propose here a scheme of the role of RNase L in adipogenesis
(Figure 8D).
Materials and Methods
MEFs isolation – cell viability. Five embryos from each mouse (WT and RNase L!/!mice, C57BL/6 strain) were collected aseptically at the stage of 16 days (the day of plug being the first day) in phosphate-buffered saline (PBS: 140 mM NaCl, 2 mM KCl, 8 mM Na2HPO4, 1.5 mM KH2PO4(pH 7.4)). The limbs were cut and chipped to very small pieces. After digestion with 0.05% trypsin–EDTA solution, the cells were dissociated in two volumes of Dulbecco’s modified eagle medium (DMEM, BioWhittaker, Lonza, Basel, Switzerland) containing 10% (V/V) of fetal calf serum (FCS, PAN Biotech, Dutscher, Brumath, France) by vigorous shaking. Then the cells were plated in tissue culture dishes with DMEM 10% (V/V) FCS. The cell line was immortalized by letting the cells pass the crisis with a total of 37 passages.34
0 0.5 1 1.5 2 V-RNase L-/- Hu-RNase L
-/-Fold induction of glucose uptake
- insulin P-Akt (Ser473) Akt α-tubulin ND D ND D 0 - + - + - + - + 2 4 6 8 10 12
Relative fold induction P-Akt
(Ser 473 )/Akt V-RNase L-/- Hu-RNaseL -/-V-RNase
L-/- Hu-RNaseL-/- V-RNaseL-/- Hu-RNaseL
-/-V-RNase
L-/- Hu-RNaseL-/- V-RNaseL-/- Hu-RNaseL
-/-Relative absorbance at 540 nm (%) 0 50 100 150 200 250 20 "m 20 "m + - + - + - + insulin a b
Figure 6 Lipids accumulation and insulin response after re-introduction of RNase L expression in RNase L!/!-MEFs. (A) V-RNase L!/!-MEFs (a) and Hu-RNase L!/! -MEFs (b) were induced to differentiate in ADM. Cells were fixed and stained with oil red O to reveal lipids accumulation after 6 days of differentiation. Cells were observed at a magnification of # 40. After staining, lipids were quantified by spectrophotometric analysis at 540 nm following elution of cell retained oil red O with ethanol. The amount of lipids in V-RNase L!/!-MEFs was set at 100%. Error bars refer to the S.D. obtained in four independent experiments conducted in duplicate. **P ¼ 0.005 lipids quantity in Hu-RNase L!/!-MEFs compared with V-RNase L!/!-MEFs. (B) V-RNase L!/!-MEFs and Hu-RNase L!/!-MEFs were treated ( þ ) or not (!) 10 min at 37 1C with insulin at confluence (ND) or after 6 days of differentiation (D). Total cellular extracts were analyzed by western blot with anti-P-Akt (Ser473), Akt and
anti-a-tubulin-specific antibodies. (C) Protein bands shown in (B) were quantified with the ImageJ software. The levels of P-Akt (Ser473)/Akt were corrected with correspondinga-tubulin levels, used as indicator of proteins loading. P-Akt (Ser473)/Akt rate in V-RNase L!/!-MEFs and Hu-RNase L!/!-MEFs before insulin treatment was set at 1. Error bars refer to the S.D. obtained in four independent experiments. *P ¼ 0.05 P-Akt (Ser473)/Akt level after insulin treatment in differentiated Hu-RNase L!/!-MEFs compared with differentiated V-RNase L!/!-MEFs. (D) Glucose uptake was measured in V-RNase L!/!-MEFs and Hu-RNase L!/!-MEFs after differentiation. Cells were incubated ( þ ) or not (!) with insulin, then medium was changed to DMEM without glucose and 6-NBDG. After a 45-min incubation at 371C, fluorescence intensity of 6-NBDG was measured at 540 nm wavelength (465 nm excitation wavelength). Glucose uptake represents the ratio of fluorescence measured in basal condition (without insulin) and in the presence of insulin. Fluorescence values were normalized by cell number. Error bars refer to the S.D. obtained in three independent experiments conducted in duplicate. *P ¼ 0.028 insulin-stimulated glucose uptake level in differentiated Hu-RNase L!/!-MEFs compared with V-RNase L!/!-MEFs
Cell viability was controlled for each cell line with the PrestoBlue Cell Viability Reagent kit (Life Technologies, Fisher Scientific, Illkirch, France) following the manufacturer instructions. PrestoBlue reagent was added in the cell culture medium, and the cells were incubated at 371C for 30 min. Fluorescence intensity of the PrestoBlue reagent reduced by living cells was measured at 615 nm wavelength (535 nm excitation wavelength) with an Infinite 200PRO TECAN (Lyon, France). Fluorescence level was normalized by cell number.
Cell culture – induction of adipocyte differentiation. WT-MEFs and RNase L!/!-MEFs were cultured, as described previously, in the growth medium (GM): DMEM with 10% (V/V) FCS, 100 U/ml penicillin and 100mg/ml streptomycin at 371C.18
At 80% confluence, cells were switched to adipocyte differentiating medium (ADM): GM supplemented with 0.5 mM 3-isobutyl-1-methylxanthine, 1mM dexamethasone and 10mM insulin (all from Sigma-Aldrich, Saint-Quentin Fallavier, France) for 2 days. Cells were then incubated in fresh ADM for 2 supplementary days and then the medium was changed to GM for 2 days.19
For insulin response, cells were treated or not with insulin (1 nmol) for 10 min at 371C. Cells were then washed twice with PBS and lysed in sodium dodecyl sulfate-polyacrylamide gel electrophoresis (SDS-PAGE) sample buffer
(300 mM Tris (pH 8.9), 5% (W/V) SDS, 750 mMb-mercaptoethanol, 20% (V/V) glycerol and bromophenol blue) for proteins analysis by western blot.
Oil red O labeling – immunofluorescence. Adipogenic cell phenotype was characterized by specific oil red O staining of lipids.35Cells were observed with a Nikon AZ100 and TIFF images were captured with a Nikon Digital Camera (DXM 1200c; Champigny sur Marne, France) with ACT-1C program for the control of DXM 1200C platform. Lipids accumulation was quantified by spectrophotometric analysis at 540 nm after eluting the oil red O retained in the cells with ethanol. Optical density was measured with an Infinite 200PRO TECAN.
For immunofluorescence analysis, cells were fixed in 3.7% (V/V) formalin for 10 min and permeabilized with PBS-Triton X100 0.5% (V/V) at room temperature for 5 min. After blocking with 10% (V/V) FCS in PBS, cells were incubated with an anti-perilipin or an anti-aP2/Fabp4 antibody (both from Cell Signaling, Ozyme, Saint-Quentin Yvelines, France) for 1 h at room temperature. Cells were then washed and incubated with a donkey anti-rabbit secondary antibody conjugated to tetramethylrhodamine-5,6-isothiocyanate (Santa Cruz Biotechnology, Santa Cruz, CA, USA) for 1 h at room temperature. Cells were observed at room temperature with an Imager MI Zeiss (Le Pecq, France), and TIFF images were captured with an Axiocam MRm Zeiss and the Axiovision 4.7 (05-2008) program.
Akt siCT P-Akt (Ser473) α-tubulin insulin NS siCT 0 1 2 3 4 5
Relative fold induction P-Akt
(Ser 473 )/Akt siCHOP siCT CHOP10 mRNA EEF1α mRNA RNase L-/--MEFs-siCT RNase L-/--MEFs-siCHOP 20 "m 0 20 40 60 80 100 120 140 Relative absorbance at 540 nm (%) siCT 20 µm 20 "m siCHOP a b e c d 20 "m 20 µm siCHOP 20 "m siCHOP - + - + insulin - + - + a b
Figure 7 Downregulation of CHOP10 mRNA with CHOP10 siRNA allows a better adipocyte differentiation of RNase L!/!-MEFs. (A) RNase L!/!-MEFs were transfected with a siCHOP or a siCT, then cells were collected and mRNAs were analyzed, after RT, by q-PCR with specific primers for CHOP10 or EEF1a (Supplementary Table 1). PCR products were analyzed on 1.2% agarose gel. Photographies of the gels are shown. (B) Cells were stained with oil red O to reveal lipids accumulation after 6 days of differentiation. RNase L!/!-MEFs transfected with siCT (a and c) and RNase L!/!-MEFs transfected with siCHOP (b and d) were observed at a magnification of # 40. After staining with oil red O, lipids were quantified by spectrophotometric analysis at 540 nm following elution of cell retained oil red O with ethanol. (e) Quantification of lipids in RNase L!/!-MEFs transfected with siCT or siCHOP, 6 days after induction of differentiation in ADM. The amount of lipids in RNase L!/!-MEFs transfected with siCT was set at 100%. Error bars refer to the S.D. obtained in four independent experiments conducted in duplicate. **P ¼ 0.003 RNase L!/!-MEFs transfected with siCHOP compared with RNase L!/!-MEFs transfected with siCT. (C) RNase L!/!-MEFs transfected with siCT or siCHOP were induced to differentiate during 6 days in ADM. Cells were fixed and then incubated with an antibody against perilipin (red; RNase L!/!-MEFs transfected with siCT (a) and RNase L!/!-MEFs transfected with siCHOP (b). DNA was stained with DAPI (blue). (D) RNase L!/!-MEFs transfected with siCT or siCHOP were treated ( þ ) or not (!) 10 min at 37 1C with insulin after 6 days of differentiation. Total cellular extracts were analyzed by western blot with anti-P-Akt (Ser473), anti-Akt and anti-a-tubulin-specific antibodies. (E) Protein bands shown in (D) were quantified with the ImageJ software. Levels of P-Akt (Ser473)/Akt were corrected with correspondinga-tubulin levels, used as indicator of proteins loading. P-Akt (Ser473
)/Akt rate in RNase L!/!-MEFs transfected with siCT or siCHOP before insulin treatment was set at 1. Error bars refer to the S.D. obtained in four independent experiments. NS, non statistically significant P-Akt (Ser473)/Akt level after insulin treatment in differentiated RNase L!/!-MEFs transfected with siCHOP compared with differentiated RNase L!/!-MEFs transfected with siCT
Reverse transcription (RT), semi-quantitative PCR and q-PCR. Total RNAs were isolated using TRIzol (Invitrogen, Fisher Scientific). To avoid genomic DNA contamination and amplification during PCR, RNAs were treated with DNase-RNase free (Euromedex, Souffelweyersheim, France) before RT. cDNAs were generated by RT with oligo-(dT) primers and the Moloney murine leukemia virus (M-MLV) Reverse Transcriptase (Jena Bioscience, Euromedex). Briefly, 5mg of total RNAs were denatured at 701C and then reverse transcribed at 42 1C for 120 min following the manufacturer instructions.
Semi-quantitative PCR of the cDNAs was performed using a Biometra thermocycler (LABGENE, Archamps, France) in a total volume of 25ml. Cycle number was 32. Amounts of cDNA were adjusted for each primer pair to be in the
linear range amplification and to give the same quantity of amplified cDNA with eukaryotic elongation factor 1a (EEF1a) primers. PCR products were visualized in 1.2% agarose gel and stained with ethidium bromide. Photographies of the gels were captured as TIFF files with a Vilber Lourmat camera and Ecapt program (both from VWR, Fontenay-sous-bois, France).
To quantify genes expression allowing a comparison between WT-MEFs and RNaseL!/!-MEFs or V-RNaseL!/!-MEFs and Hu-RNaseL!/!-MEFs, cDNAs were used as templates in SYBR Green I Master real-time q-PCR assays on a LightCycler 480 (Roche Diagnostics, Meylan, France), in a total volume of 10ml. Cycle number was 45. Sample data were analyzed according to the comparative cycle threshold method and were normalized by stable reference gene of EEF1a.
RNase L RNase L RNase L Adipocytes Clonal expansion Terminal differentiation Preadipocytes C/EBP! PPAR"2 aP2/Fabp4 Glut4 C/EBP! PPAR"2 aP2/Fabp4 Glut4
High level of CHOP10 Low level of CHOP10
WT RNase L Preadipocytes Hyperplasia Normoplasia RNase L WT § § 0 50 100 a b e c d 150 200 250 300 Male
Relative adipocyte number (%)
0 2000 4000 6000 8000 10000 Male Female
Average size of adipocytes (
" m 2) § § Female M ale WT RNase L -/-WT RNase L -/-100 "m 100 "m 100 "m 100 "m RNase L -/-Body weight (g) 0 10 20 30 40 50 60 70 80 WT Female RNase L-/- RNase L -/-f a b c d
Figure 8 RNase L!/!mice present impairments of adipogenesis. (A) Adipose tissue sections from male WT and RNase L!/!mice (a and b, respectively) and female WT and RNase L!/!mice (c and d, respectively) were stained with H&E. (e) Relative number of adipocytes from male and female WT (black bars) and RNase L!/!mice (white bars). Number of adipocytes from WT male mouse was set at 100%.yPr0.001 number of adipocytes in male and female RNase L!/!mice compared with adipocytes number in male and female WT mice, respectively. (f) Average size of adipocytes from abdominal adipose tissue from male and female WT (black bars) and RNase L!/! mice (white bars).yPr0.001 average size of adipocytes in male and female RNase L!/!mice compared with adipocytes size in male and female WT mice, respectively. (B) Eight pairs of age- and gender-matched WT and RNase L!/!mice were maintained for 18 months and fed with a chew diet. The average body weight was 65.8±5.9 g for RNase L!/!mice and 54.4±3.3 g for WT mice (P ¼ 0.056). (C) H&E staining of the liver (a and b) and kidney (c and d) sections from WT and RNase L!/!mice. (D) Scheme of potential role of RNase L during adipogenesis. In RNase L!/!mouse, CHOP10 expression is maintained after induction of differentiation. Consequently, clonal expansion of preadipocytes is more important in RNase L!/!mice that leads to an important adipose tissue development but with less differentiated adipocytes. These adipocytes are not able to stock correctly lipids as do WT mouse adipocytes
Gene sequences for primer design were obtained from the NCBI Reference Sequences database. Primers were chosen using the Primer3 and the LightCycler Probe Design (Roche) softwares. When possible, forward and reverse primers were designed on different exon sequences. Primers sequences are provided in Supplementary Table 1.
mRNPs immunoprecipitation. We used the protocol described by Sanchez et al.36 with some modifications. Briefly, confluent WT-MEFs and RNase L!/!-MEFs were lysed with IPP50 buffer (10 mM Tris-HCl (pH 8), 150 mM NaCl,) without NP40 and supplemented with 2 mM EDTA and 10mg/ml aprotinin, 150mg/ml leupeptin, 1 mM phenylmethanesulfonyl fluoride and 80U RNaseOut (Invitrogen). Cell extracts were centrifuged at 10 000 # g. Supernatants (2 mg of proteins) were incubated with protein A-sepharose equilibrated in the same modified IPP50 buffer, and no antibody, mouse monoclonal anti-a-tubulin (Sigma-Aldrich) or mouse monoclonal anti-RNase L antibody (Abcam, Paris, France). After an overnight incubation at 41C with gentle shaking, protein A-sepharose beads were centrifuged and washed three times with ice-cold-modified IPP50 buffer. The pellet was separated in two fractions. One fraction was analyzed for RNase L protein content by western blot as described below. RNAs were extracted from the other fraction by adding TRIzol (1 ml) to the beads and following the manufacturer instructions (Invitrogen). Glycogen (10mg) was added to ease RNA precipitation with isopropanol. cDNA was generated from total extracted RNA by RT with oligo-(dT) primers and the M-MLV Reverse Transcriptase (Jena Bioscience) as described above. 2.5ml of RT product was amplified with specific CHOP10 primers (Supplementary Table 1) by q-PCR following the manufacturer instructions (Roche) with a LightCycler 480 as described previously.
mRNA stability. WT-MEFs and RNase L!/!-MEFs were plated in GM and, at confluence, cells were treated with actinomycin D (5mg/ml) for 0, 1, 2, 4 or 6 h. Then RNAs were extracted and analyzed after RT by semi-quantitative PCR as described above. Following agarose gel electrophoresis, pictures of the gels were saved as TIFF files with a Vilber Lourmat camera and Ecapt program. cDNAs were also analyzed by q-PCR following the manufacturer instructions (Roche) with a LightCycler 480 as described above.
Western blot assay. At confluence, cells were switched to differentiation medium as indicated above. Cells were then collected in SDS-PAGE buffer at confluence or after 6 days in ADM. Protein extracts were incubated with benzonase (Sigma-Aldrich) 15 min at 371C before western blot analysis. Nitrocellulose membranes were then incubated in blocking buffer for fluorescent western blotting (Odyssey Infrared Imaging System LI-COR Biosciences, ScienceTec, Courtabœuf, France) for 1 h and incubated with a rabbit polyclonal anti-RLI antibody (Novus Biological, Interchim, Montluc¸on, France), or a mouse monoclonal anti-Hu-RNase L (Abcam) or a rabbit polyclonal anti-mouse RNase L (Santa Cruz), or a rabbit polyclonal anti-phospho-Akt (Ser473) or a rabbit polyclonal anti-Akt (both from Cell Signaling), or a mouse monoclonal anti-a-tubulin (Sigma-Aldrich) in the same buffer overnight at 41C. Membranes were washed in PBS supplemented with 0.05% (V/V) Tween 20 then with PBS alone and incubated for 45 min at room temperature with a donkey anti-rabbit or anti-mouse conjugated to IRDye 700DX or IRDye800 (Rockland, Tebu-Bio). Specific proteins were visualized with a LI-COR Odyssey Biosciences Imaging System. Protein bands were quantified by image analysis with the ImageJ software (http://rsbweb.nih.gov/ij/index.html).
Glucose uptake. A fluorescent glucose analog, 6-(N-(7-nitrobenz-2-oxa-1, 3-diazol-4-yl) amino)-2-deoxy-glucose (6-NBDG, Molecular Probes, Fisher Scientific), was used to measure glucose uptake in WT-MEFs, RNase L!/!-MEFs, V-RNase L!/! -MEFs and Hu-RNase L!/!-MEFs.37After differentiation, cells were incubated 10 min with or without insulin (1 nmol) then medium was changed to glucose-free DMEM and 6-NBDG (300mM) was then added to all cells for 45 min at 37 1C. Cells were thoroughly washed to remove all exogenous fluorescent glucose analog, and fluorescence intensity of 6-NBDG was measured at 540 nm wavelength (465 nm excitation wavelength) with an Infinite 200PRO TECAN. Fluorescence level was normalized with cell number. ROS production in WT-MEFs and RNase L!/!-MEFs. ROS level was measured using the nitroblue tetrazolium (NBT) assay (Sigma-Aldrich).38Cells were incubated for 90 min in DMEM 0.2% (W/V) NBT. Produced formazan was then dissolved in 50% (V/V) acetic acid and the absorbance was determined at 560 nm with an Infinite 200PRO TECAN. Optical density values were normalized by protein levels.
Ectopic expression of Hu-RNase L in RNase L!/!-MEFs. The coding sequence of Hu-RNase L cDNA was subcloned in pcDNA3neo (Invitrogen) by the standard procedures.39 RNase L-pcDNA3neo or the empty vector pcDNA3neo were transfected into RNase L!/!-MEFs with JetPEI (Qbiogene, Illkirch, France) following the manufacturer instructions. As observed previously, the yield of transfection was low,40so transfectants were selected by culturing cells in the presence of 1 mg of G418 (Gibco-BRL, Fisher Scientific) per ml of cell culture medium. The polyclonal cell population expressing the transfected Hu-RNase L cDNA was named Hu-RNase L!/!-MEFs; the polyclonal cell popula-tion expressing the transfected empty vector was named V-RNase L!/!-MEFs. siCHOP and siCT transfection. The siRNA duplexes have been designed and manufactured by Qiagen (Courtabœuf, France).
siCHOP sense: (50-GGAAGUGCAUCUUCAUACA-30)dTdT; siCHOP antisense: (50-UGUAUGAAGAUGCACUUCC-30)dTdT; siCT: sense (50-UUCUCCGAACGUG UCACGU-30)dTdT; siCT antisense: (50-ACGUGACACGUUCGGAGA-30)dTdT. siRNAs were transfected into RNase L!/!-MEFs with HiPerFect (Qiagen) following the manufacturer instructions.
Statistical analysis. Means±S.D.’s were calculated and statistical analyses using the Holm–Sidak method were performed with the SigmaStat software. Significant differences between two groups are considered for *Pr0.05, **Pr0.01 andyPr0.001.
Histological analysis of white adipose tissue from WT and RNase L!/!mice. Abdominal fat pad was removed from each mouse (two females and two males, 21 weeks aged) and fixed in 10% formalin. Fixed specimens were embedded in paraffin. Sections were then stained with hematoxylin and eosin (H&E). Adipocytes were counted in four different sections for each mouse. Phenotype of mouse RNase L!/!. Eight pairs of age-matched WT and RNase L!/!male mice (C57BL/6 strain) were maintained for 18 months and fed with chew diet. Food intake was similar for both types of mice. The average body weight was measured in WT mice (five survived) and in RNase L!/!(six survived). For histological analyses of the liver and kidney, tissues were fixed in formalin and then embedded in paraffin. Sections were deparaffinized, rehydrated and stained with H&E.
Conflict of Interest
The authors declare no conflict of interest.
Acknowledgements. This work was supported by grants from the Institut National de la Sante´ et de la Recherche Me´dicale (INSERM) and the Universite´ de Montpellier 1 (UM1). OF was recipient of a UM1 fellowship. We thank M Hokayem for her insight on this manuscript.
1. Jo J, Gavrilova O, Pack S, Jou W, Mullen S, Sumner AE et al. Hypertrophy and/or hyperplasia: dynamics of adipose tissue growth. PLoS Comput Biol 2009; 5: e1000324. 2. Poulos SP, Hausman DB, Hausman GJ. The development and endocrine functions of
adipose tissue. Mol Cell Endocrinol 2010; 323: 20–34.
3. Bluher M. Adipose tissue dysfunction in obesity. Exp Clin Endocrinol Diabetes 2009; 117: 241–250.
4. Cartwright MJ, Tchkonia T, Kirkland JL. Aging in adipocytes: potential impact of inherent, depot-specific mechanisms. Exp Gerontol 2007; 42: 463–471.
5. Tchkonia T, Pirtskhalava T, Thomou T, Cartwright MJ, Wise B, Karagiannides I et al. Increased TNFalpha and CCAAT/enhancer-binding protein homologous protein with aging predispose preadipocytes to resist adipogenesis. Am J Physiol Endocrinol Metab 2007; 293: E1810–E1819.
6. Tontonoz P, Spiegelman BM. Fat and beyond: the diverse biology of PPARgamma. Annu Rev Biochem 2008; 77: 289–312.
7. Tang QQ, Lane MD. Role of C/EBP homologous protein (CHOP-10) in the programmed activation of CCAAT/enhancer-binding protein-beta during adipogenesis. Proc Natl Acad Sci USA 2000; 97: 12446–12450.
8. Song B, Scheuner D, Ron D, Pennathur S, Kaufman RJ. Chop deletion reduces oxidative stress, improves beta cell function, and promotes cell survival in multiple mouse models of diabetes. J Clin Invest 2008; 118: 3378–3389.
9. Szypowska AA, Burgering BM. The peroxide dilemma: opposing and mediating insulin action. Antioxid Redox Signal 2011; 15: 219–232.
10. Hao S, Baltimore D. The stability of mRNA influences the temporal order of the induction of genes encoding inflammatory molecules. Nat Immunol 2009; 10: 281–288.
11. Salehzada T, Cambier L, Vu Thi N, Manchon L, Regnier L, Bisbal C. Endoribonuclease L (RNase L) regulates the myogenic and adipogenic potential of myogenic cells. PLoS One 2009; 4: e7563.
12. Bisbal C, Silverman RH. Diverse functions of RNase L and implications in pathology. Biochimie 2007; 89: 789–798.
13. Hovanessian AG, Justesen J. The human 20–50oligoadenylate synthetase family: unique interferon-inducible enzymes catalyzing 20–50 instead of 30–50 phosphodiester bond
formation. Biochimie 2007; 89: 779–788.
14. Bisbal C, Martinand C, Silhol M, Lebleu B, Salehzada T. Cloning and characterization of a RNAse L inhibitor. A new component of the interferon-regulated 2–5A pathway. J Biol Chem 1995; 270: 13308–13317.
15. Le Roy F, Salehzada T, Bisbal C, Dougherty JP, Peltz SW. A newly discovered function for RNase L in regulating translation termination. Nat Struct Mol Biol 2005; 12: 505–512. 16. Le Roy F, Silhol M, Salehzada T, Bisbal C. Regulation of mitochondrial mRNA
stability by RNase L is translation-dependent and controls IFNalpha-induced apoptosis. Cell Death Differ 2007; 14: 1406–1413.
17. Bisbal C, Silhol M, Laubenthal H, Kaluza T, Carnac G, Milligan L et al. The 20–50
oligoadenylate/RNase L/RNase L inhibitor pathway regulates both MyoD mRNA stability and muscle cell differentiation. Mol Cell Biol 2000; 20: 4959–4969.
18. Zhou A, Paranjape J, Brown TL, Nie H, Naik S, Dong B et al. Interferon action and apoptosis are defective in mice devoid of 20,50-oligoadenylate-dependent RNase L. EMBO J 1997; 16: 6355–6363.
19. Kim KA, Kim JH, Wang Y, Sul HS. Pref-1 (preadipocyte factor 1) activates the MEK/ extracellular signal-regulated kinase pathway to inhibit adipocyte differentiation. Mol Cell Biol 2007; 27: 2294–2308.
20. Hertzel AV, Bernlohr DA. The mammalian fatty acid-binding protein multigene family: molecular and genetic insights into function. Trends Endocrinol Metab 2000; 11: 175–180. 21. Bickel PE, Tansey JT, Welte MA. PAT proteins, an ancient family of lipid droplet proteins
that regulate cellular lipid stores. Biochim Biophys Acta 2009; 1791: 419–440. 22. Houstis N, Rosen ED, Lander ES. Reactive oxygen species have a causal role in multiple
forms of insulin resistance. Nature 2006; 440: 944–948.
23. Gregor MG, Hotamisligil GS. Adipocyte stress: the endoplasmic reticulum and metabolic disease. J Lipid Res 2007; 48: 1905–1914.
24. Tanti JF, Grillo S, Gremeaux T, Coffer PJ, Van Obberghen E, Le Marchand-Brustel Y. Potential role of protein kinase B in glucose transporter 4 translocation in adipocytes. Endocrinology 1997; 138: 2005–2010.
25. Balagopal V, Parker R. Polysomes, P bodies and stress granules: states and fates of eukaryotic mRNAs. Curr Opin Cell Biol 2009; 21: 403–408.
26. Namba T, Tanaka K, Ito Y, Ishihara T, Hoshino T, Gotoh T et al. Positive role of CCAAT/enhancer-binding protein homologous protein, a transcription factor involved in
the endoplasmic reticulum stress response in the development of colitis. Am J Pathol 2009; 174: 1786–1798.
27. Carriere A, Carmona MC, Fernandez Y, Rigoulet M, Wenger RH, Penicaud L et al. Mitochondrial reactive oxygen species control the transcription factor CHOP-10/GADD153 and adipocyte differentiation: a mechanism for hypoxia-dependent effect. J Biol Chem 2004; 279: 40462–40469.
28. Lee H, Lee YJ, Choi H, Ko EH, Kim JW. Reactive oxygen species facilitate adipocyte differentiation by accelerating mitotic clonal expansion. J Biol Chem 2009; 284: 10601–10609.
29. Loh K, Deng H, Fukushima A, Cai X, Boivin B, Galic S et al. Reactive oxygen species enhance insulin sensitivity. Cell Metab 2009; 10: 260–272.
30. Pessler-Cohen D, Pekala PH, Kovsan J, Bloch-Damti A, Rudich A, Bashan N. GLUT4 repression in response to oxidative stress is associated with reciprocal alterations in C/EBP alpha and delta isoforms in 3T3-L1 adipocytes. Arch Physiol Biochem 2006; 112: 3–12.
31. Johmura Y, Watanabe K, Kishimoto K, Ueda T, Shimada S, Osada S et al. Fad24 causes hyperplasia in adipose tissue and improves glucose metabolism. Biol Pharm Bull 2009; 32: 1656–1664.
32. Karagiannides I, Tchkonia T, Dobson DE, Steppan CM, Cummins P, Chan G et al. Altered expression of C/EBP family members results in decreased adipogenesis with aging. Am J Physiol Regul Integr Comp Physiol 2001; 280: R1772–R1780.
33. Tomaru U, Takahashi S, Ishizu A, Miyatake Y, Gohda A, Suzuki S et al. Decreased proteasomal activity causes age-related phenotypes and promotes the development of metabolic abnormalities. Am J Pathol 2012; 180: 963–972.
34. Todaro GJ, Green H. Quantitative studies of the growth of mouse embryo cells in culture and their development into established lines. J Cell Biol 1963; 17: 299–313. 35. Green H, Kehinde O. Sublines of mouse 3T3 cells that accumulate lipids. Cell 1974; 1:
113–116.
36. Sanchez M, Galy B, Hentze MW, Muckenthaler MU. Identification of target mRNAs of regulatory RNA-binding proteins using mRNP immunopurification and microarrays. Nat Protoc 2007; 2: 2033–2042.
37. Le TT, Cheng JX. Single-cell profiling reveals the origin of phenotypic variability in adipogenesis. PLoS One 2009; 4: e5189.
38. Furukawa S, Fujita T, Shimabukuro M, Iwaki M, Yamada Y, Nakajima Y et al. Increased oxidative stress in obesity and its impact on metabolic syndrome. J Clin Invest 2004; 114: 1752–1761.
39. Sambrook J, Fritsch EF, Maniatis T. Molecular Cloning: A Laboratory Manual. Cold Spring Harbor Laboratory: Cold Spring Harbor, NY, 1982.
40. Khabar KS, Siddiqui YM, al-Zoghaibi F, al-Haj L, Dhalla M, Zhou A et al. RNase L mediates transient control of the interferon response through modulation of the double-stranded RNA-dependent protein kinase PKR. J Biol Chem 2003; 278: 20124–20132.