FLUOROSCOPY-GUIDED PROCEDURES IN CARDIOLOGY: IS
PATIENT EXPOSURE BEING REDUCED OVER TIME?
E. T. Samara1, A. Aroua1, J.-C. Stauffer2, F. Bochud1and F. R. Verdun1,* 1
Institute of Radiation Physics (IRA), University Hospital Center and University of Lausanne, Rue du Grand-Pre´ 1, 1007 Lausanne, Switzerland
2
Cardiology Department, CHUV-UNIL, Rue du Bugnon 46, 1011 Lausanne, Switzerland *Corresponding author: [email protected]
The number of fluoroscopy-guided procedures in cardiology is increasing over time and it is appropriate to wonder whether tech-nological progress or change of techniques is influencing patient exposure. The aim of this study is to examine whether patient dose has been decreasing over the years. Patient dose data of more than 7700 procedures were collected from two cardiology centres. A steady increase in the patient dose over the years was observed in both the centres for the two cardiological procedures included in this study. Significant increase in dose was also observed after the installation of a flat-panel detector. The increasing use of radial access may lead to an increase in the patient exposure. The monitoring of dose data over time showed a consider-able increase in the patient exposure over time. Actions have to be taken towards dose reduction in both the centres.
INTRODUCTION
The number of interventional cardiology procedures has increased over the years. Only in Europe, a 3.2-fold increase in coronary angiograms from 1992 to 2004 was estimated, resulting in 2 million procedures performed in 2004; more than 3 million procedures are expected in 2010(1). In the same study, the trends for both coronary angiography (CA) and stenting were also observed to be rising. In the USA, the number of percutaneous coronary interventions has considerably increased without a simultaneous change in patient demographics, which means that more patients today are referred to interventional procedures than open operations(2). Reasons for this increase may include changes in patient demo-graphics in some countries, increased operator clinical skills, the development and availability of purpose-designed cardiological fluoroscopic systems. Many procedures that previously required open surgery or were impossible are now safely and effec-tively performed using interventional techniques. However, there is significant concern related to the radiation exposure of patients undergoing fluorosco-pically guided procedures. Patients may suffer from radiation-induced skin injuries (skin erythema, per-manent epilation, skin necrosis) and if younger, the risk of cancer may be significantly higher(3). National and international authorities point to the increasing number of fluoroscopy-guided procedures and recommend patient dose surveys and the usage of dose reference levels (DRLs) to optimise the exposure(3,4). The aim of this study was to examine if radiation doses tend to increase or decrease over the years and investigate whether new technology and techniques have an impact on the dose delivered to patient.
MATERIALS AND METHODS
The survey took place in two large cardiology centres (A and B). Two procedures were chosen to be analysed: CA and percutaneous transluminal coronary angioplasty (PTCA). Annual data for the two procedures were collected from each centre, including values of dose – area product (DAP) and fluoroscopy time (T ). Data for centre A were col-lected from 2001 to 2007 and for centre B from 2004 to 2007. In centre A, the fluoroscopy unit Integris (Philips Medical System, The Netherlands) was equipped with a 23-cm image intensifier (II). In 2004, a new unit Allura XPS FD10 (Philips Medical System, The Netherlands) was installed, equipped with a flat-panel detector (FPD). This change in installation was taken into consideration during the data analysis. In centre B, a fluoroscopy unit Diagnos Poly 2C (Philips Medical System, The Netherlands) was also equipped with a 23-cm II. In both the centres, a DAP meter was installed on the X-ray equipments. In centre B, patient data included information about the vascular access approach (femoral or radial access). The difference in the two approach techniques was examined for their effect on radiation dose. For each procedure, the mean, median, maximum and 75 % values were established. Non-parametric analysis [Mann – Whitney U (M – W) test] was used to compare the differences between the results. Statistical data analy-sis was performed with the SPSS 15 software package (SPSS Inc, Chicago, IL, USA).
RESULTS
In total, data from 4742 procedures were collected from centre A and 3027 procedures from centre B.
#The Author 2010. Published by Oxford University Press. All rights reserved. For Permissions, please email: [email protected] Radiation Protection Dosimetry (2010), Vol. 139, No. 1 – 3, pp. 271–274 doi:10.1093/rpd/ncp307 Advance Access publication 22 January 2010
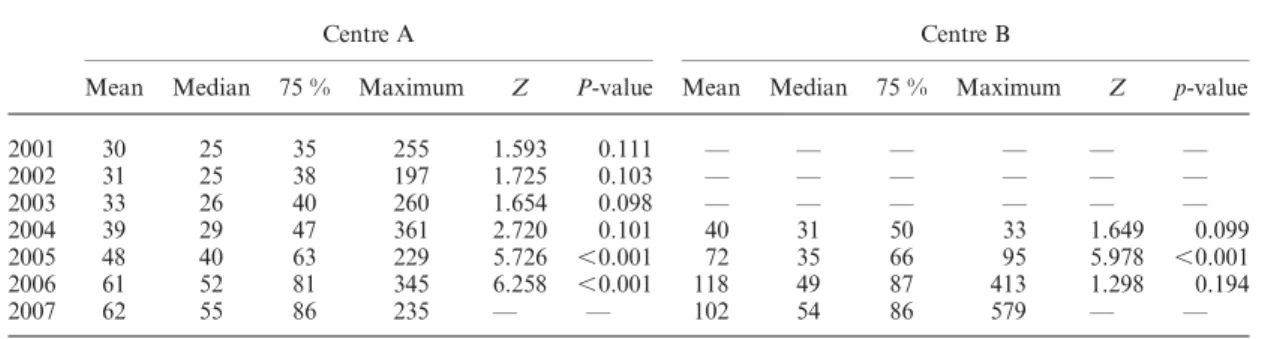
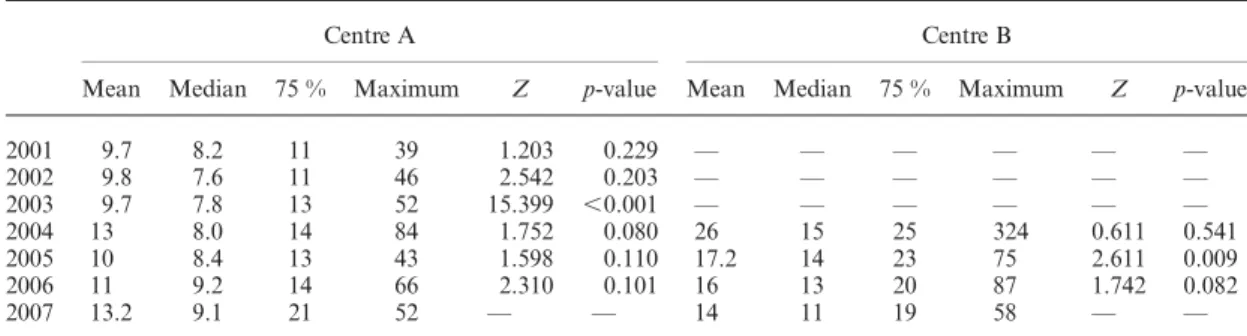
The results for the DAP values in the CA and PTCA procedures are presented in Tables 1 and 2 and the fluoroscopy times T are shown in Tables3 and 4, respectively. The 75 % values were used to compare the differences between patient doses over the years. A 2.5- and 1.7-fold increase was observed for the DAP values during CA procedure in centres A and B, respectively. Statistically significant increase in the DAP values was observed between 2004 and 2005, when the FPD was installed. However, the DAP values were shown to be signifi-cantly higher every year since 2004. T has also increased over the years in both the centres. The DAP values have also increased with respect to PTCA procedures. This increase was found to be statistically significant for both the centres. However, the T values were found to be constant over time for centre A. In centre B, T showed a significant decrease especially between 2005 and 2006 ( p-value ¼ 0.009).
A small increase in the number of cases treated with radial access was observed for centre B (Figure1). The results were compared by M – W test to test any significant difference in patient dose between the radial and femoral access. A significant difference was confirmed in the case of CA for both DAP (Z ¼ 4.317, p-value , 0.001) and T (Z ¼ 5.669, p-value , 0.001). The results for PTCA procedures were not found to be significantly
different (DAP: Z ¼ 0.072, p-value ¼ 0.943 and T: Z ¼ 0.358, p-value ¼ 0.721).
DISCUSSION
Contrary to the expectations, the present work shows that radiation doses in cardiology procedures have increased over time in the two centres moni-tored despite the fact that the staff remained the same and all operators were senior interventionists. On the other hand, fluoroscopy time was found to remain constant or has slightly decreased during the same period.
The DRLs concept was proposed in 1990 by International Commission on Radiological Protection (ICRP) and is accepted as a management tool for radiation exposure in medical imaging pro-cedures. The main objective of the DRLs is patient dose reduction for a given examination. DRLs should be used to ensure a balance between patient dose and image quality. It is essential to be monitored over time. The use of this concept is straightforward in radiography or CT examinations; however, it presents some limitations when it is used in fluoroscopy where the procedures are less standar-dised. In 2008, the Swiss Federal Office for public health published DRLs for diagnostic and thera-peutic procedures in radiology and cardiology. The DRLs in terms of DAP and T, for CA are
Table 1. Mean, median, 75 % percentile and maximum values of DAP (Gy.cm2) for CA procedures.
Centre A Centre B
Mean Median 75 % Maximum Z P-value Mean Median 75 % Maximum Z p-value
2001 30 25 35 255 1.593 0.111 — — — — — — 2002 31 25 38 197 1.725 0.103 — — — — — — 2003 33 26 40 260 1.654 0.098 — — — — — — 2004 39 29 47 361 2.720 0.101 40 31 50 33 1.649 0.099 2005 48 40 63 229 5.726 ,0.001 72 35 66 95 5.978 ,0.001 2006 61 52 81 345 6.258 ,0.001 118 49 87 413 1.298 0.194 2007 62 55 86 235 — — 102 54 86 579 — —
Table 2. Mean, median, 75 % percentile and maximum values of DAP (Gy.cm2) for PTCA procedures.
Centre A Centre B
Mean Median 75 % Maximum Z p-value Mean Median 75 % Maximum Z p-value
2001 60 54 75 241 0.675 0.500 — — — — — — 2002 63 51 77 252 2.975 0.301 — — — — — — 2003 62 53 81 356 1.875 0.061 — — — — — — 2004 63 53 85 2043 7.673 ,0.001 121 88 152 1540 0.688 0.492 2005 132 110 177 746 3.734 ,0.001 126 99 159 1310 4.008 ,0.001 2006 166 137 214 1214 6.521 ,0.001 264 112 209 7990 1.920 0.055 2007 201 144 288 986 — — 212 127 199 9840 — — E. T. SAMARA ET AL. 272
70 Gy.cm2 and 7 min and for PTCA 100 Gy.cm2 and 20 min, respectively. The comparison of the DRLs with the 75 % of DAP and T showed that national DRLs were exceeded in both the centres. In centre A, the DAP values were below the DRL values from 2001 to 2005 and from 2001 to 2004 for CA and PTCA, respectively. For CA procedures, the DRLs were surpassed 14 and 18 % in 2006 and 2007, respectively. In the case of PTCA, the DRLs were exceeded more than 80 % the last 3 y. However, the DRLs for the T were not exceeded for CA and were exceeded 5 % only in 2007 for PTCA. For
centre B, in the CA procedures the DRLs were sur-passed in 2006 and 2007. The DAP values for PTCA were found to be consistently higher than the DRLs. The main concern is that DAP values exceeded the DRLs and they are continuously rising. Clearly, something must be done with respect to dose optimisation.
Concerning centre A, it appears that during the years 2001 – 03 the annual DRLs were systematically well under the DRLs adopted in Switzerland for cardiac procedures. A significant increase in dose was observed in 2004, when the conventional II was replaced by a FPD. Differences in T were not found to be statistically significant, suggesting that pro-cedures of a similar complexity were performed.
In centre A, even with superior technology installed, doses steadily increased from 2004 to 2007, exceeding the national DRLs in Switzerland. Centre A, in which patient exposure was significantly lower than centre B in the past, is now overtaking centre B where a conventional II is still in use. Dose rate measurements were performed in order to understand the cause of such dose increases in centre A and the values obtained were comparable with dose rates delivered with the previous technol-ogy. No major differences were noticed at that level. One of the main problems was, and certainly remains, the X-ray beam collimation.
Figure 1. Percentage of radial access in centre B for years 2004– 07.
Table 4. Mean, median, 75 % percentile and maximum values of T (min) for PTCA procedures.
Centre A Centre B
Mean Median 75 % Maximum Z p-value Mean Median 75 % Maximum Z p-value
2001 9.7 8.2 11 39 1.203 0.229 — — — — — — 2002 9.8 7.6 11 46 2.542 0.203 — — — — — — 2003 9.7 7.8 13 52 15.399 ,0.001 — — — — — — 2004 13 8.0 14 84 1.752 0.080 26 15 25 324 0.611 0.541 2005 10 8.4 13 43 1.598 0.110 17.2 14 23 75 2.611 0.009 2006 11 9.2 14 66 2.310 0.101 16 13 20 87 1.742 0.082 2007 13.2 9.1 21 52 — — 14 11 19 58 — —
Table 3. Mean, median, 75 % percentile and maximum values of T (min) for CA procedures.
Centre A Centre B
Mean Median 75 % Maximum Z p-value Mean Median 75 % Maximum Z p-value
2001 3.7 2.5 2.4 50.6 2.128 0.033 — — — — — — 2002 3.7 2.8 4.6 31.4 6.542 0.056 — — — — — — 2003 3.8 2.6 4.8 35 21.48 ,0.001 — — — — — — 2004 5.7 3.0 5.0 89 6.579 ,0.001 9.2 3.5 7.7 305 2.031 0.042 2005 3.4 2.6 3.8 22 3.503 ,0.001 6.7 4.4 7.0 115 2.038 0.042 2006 4.0 2.9 5.0 39 6.128 ,0.001 5.9 4.0 6.6 82 0.492 0.622 2007 4.2 3.1 5.1 65 — — 5.7 4.0 6.3 85 — —
FLUOROSCOPY-GUIDED PROCEDURES IN CARDIOLOGY
Interventionists tend to use larger fields of view, since the dynamic range of the FPD does not lead to inadequate image quality even when lung tissue is present in the image. Beam collimation cannot fully explain the continuous increase in patient dose. An increase over time (especially for CA as shown in Figure1) of the radial access instead of the standard femoral access was noticed. Radial access is a rela-tively new approach technique, which is clinically advantageous for the comfort of the patient. It also allows shorter hospitalisation of the patient leading to a significant cost reduction. One of the main inconveniences of the radial approach, even though this is still under controversy, is that it may increase patient dose as well as staff dose. As an example, radial access has been shown to result in higher doses to patients in the case of CA, but not in the case of PTCA. Larrazet et al.(5) reported higher DAP values and fluoroscopy time with radial access than with femoral access during PTCA procedures. However, their study was not randomised. Sandborg et al.(6) also reported higher exposure with radial artery access in CA and coronary interventions. Higher values in the cases with radial access were also found in the study by Philippe et al.(7). On the contrary, Geijer and Persliden(8) reported no differ-ence in radiation dose between the two different techniques for interventional procedures.
The use of DRLs in fluoroscopy is associated with certain limitations; the main one being that they do not take into account the complexity of the pro-cedure (e.g. elective or emergency propro-cedure, mono-or multi-vessels procedure, etc.). This might be improved in the near future since several groups(9,10) have proposed introducing complexity indices to refine the DRL values and thus increase its acceptance in the clinical world. In spite of these limitations, the results of this study, that are based on the analysis of the DRL values over time, clearly demonstrate that a major effort has to be made to ensure patient safety in cardiology. In the present study, the dose increase cannot be explained only by a drastic increase in the complexity of the procedure. The population demographics considered during this survey and the personnel of the centres remained the same.
CONCLUSION
In conclusion, radiation doses in cardiology pro-cedures performed under fluoroscopy guidance appeared, in the case here, to increase over time and basic rules of practical radiation protection have to be re-introduced among the interventionists. This
has been demonstrated using the DRL concept even if this concept has to be used with care since at the moment it does not take into account procedural complexity. In these high-dose procedures, it should be a priority that medical physicists be involved to ensure patient and personnel safety. Technological progress is not directly associated with patient dose reduction.
REFERENCES
1. Cook, S., Walker, A., Hu¨gli, O., Togni, M. and Meier, B. Percutaneous coronary interventions in Europe: preva-lence, numerical estimates, and projections based on data up to 2004. Clin. Res. Cardiol. 96(6), 375 – 382 (2007).
2. McLean, T. R. In New York State, do more percuta-neous coronary interventions mean fewer or more complex referrals to cardiac surgeons? Am. Heart Hosp. J. Winter 6(1), 30 – 36 (2008).
3. International Commission on Radiological Protection. Avoidance of radiation injuries from medical interven-tional procedures. ICRP Publication 85. Ann. ICRP 30(2) (Oxford and New York: Pergamon Press) (2000). 4. European Union. Council Directive 97/43 Euratom, on
health protection of individuals against the dangers ionizing radiation in relation to medical exposure, and repealing. Directive 84/466. Euratom. Official J. Eur. Communities L 180, 22 – 27 (1997).
5. Larrazet, F., Dibie, A., Philippe, F., Palau, R., Klausz, R. and Laborde, F. Factors influencing fluoroscopy time and dose-area product values during ad hoc one-vessel percutaneous coronary angioplasty. Br. J. Radiol. 76(907), 473 – 477 (2003).
6. Sandborg, M., Fransson, S. G. and Pettersson, H. Evaluation of patient-absorbed doses during coronary angiography and intervention by femoral and radial artery access. Eur. Radiol. 14(4), 653 – 658 (2004). 7. Philippe, F., Larrazet, F., Meziane, T. and Dibie, A.
Comparison of transradial vs. transfemoral approach in the treatment of acute myocardial infarction with primary angioplasty and abciximab. Catheter. Cardiovasc. Interv. 61(1), 67 – 73 (2004).
8. Geijer, H. and Persliden, J. Radiation exposure and patient experience during percutaneous coronary inter-vention using radial and femoral artery access. Eur. Radiol. 14(9), 1674– 1680 (2004).
9. Balter, S., Miller, D. L., Vano, E., Ortiz Lopez, P., Bernardi, G., Cotelo, E., Faulkner, K., Nowotny, R., Padovani, R. and Ramirez, A. A pilot study exploring the possibility of establishing guidance levels in x-ray directed interventional procedures. Med. Phys. 35(2), 673 – 680 (2008).
10. Padovani, R., Bernardi, G., Malisan, M. R., Van˜o´, E., Morocutti, G. and Fioretti, P. M. Patient dose related to the complexity of interventional cardiology pro-cedures. Radiat. Prot. Dosimetry 94(1 – 2), 189 – 192 (2001).
E. T. SAMARA ET AL.