Cerebral oxygen vasoreactivity and cerebral tissue oxygen
reactivity
²
A. J. Johnston
1*, L. A. Steiner
1 2, A. K. Gupta
1and D. K. Menon
11
University of Cambridge Department of Anaesthetics, Box 93 and
2Academic Neurosurgery, Addenbrooke's
Hospital, Cambridge CB2 2QQ, UK
*Corresponding author. E-mail: [email protected]
There has long been an appreciation that cerebral blood ¯ow is modulated to ensure adequate cerebral oxygen delivery in the face of systemic hypoxaemia. There is increasing appreciation of the modulatory role of hyperoxia in the cerebral circulation and a consideration of the effects of such modulation on the maintenance of cerebral tissue oxygen concentration. These newer ®ndings are particularly important in view of the fact that cerebrovascular and tissue oxygen responses to hyperoxia may change in disease. Such alterations provide important insights into pathophysiological mechanisms and may provide novel targets for therapy. However, before the modulatory effects of hyperoxia can be used for diagnosis, to predict prognosis or to direct therapy, a more detailed analysis and understanding of the physiological concepts behind this modulation are required, as are the limitations of the measurement tools used to de®ne the modulation. This overview summarizes the available information in this area and suggests some avenues for further research.
Br J Anaesth 2003; 90: 774±86 Keywords: brain, blood ¯ow
Accepted for publication: November 20, 2002
One of the prime purposes of cerebral perfusion is to ensure oxygen delivery to the brain. Cerebral blood ¯ow (CBF) is coupled to cerebral oxygen metabolism to ensure appropri-ate oxygen delivery both at baseline and dynamically in response to cortical activity. There has long been an appreciation that CBF is modulated to ensure adequate cerebral oxygen delivery in the face of systemic hypoxaemia.6 28 43 There is increasing appreciation of the modulatory role of hyperoxia in the cerebral circulation and a consideration of the effects of such modulation on the maintenance of cerebral tissue oxygen levels.59 82 These newer ®ndings are particularly important in view of the fact that cerebrovascular and tissue oxygen responses to hypoxia and hyperoxia may change in disease. Such alterations provide important insight into pathophysiological mechan-isms and may provide novel targets for therapy. However, before the modulatory effects of hyperoxia can be used for diagnosis, to predict prognosis or to direct therapy, a more detailed analysis and understanding of the physiological concepts behind the modulation is required, as are the limitations of the measurement tools used to de®ne the
modulation. This review summarizes the available inform-ation in this area and suggests some avenues for further research.
Cerebral oxygen vasoreactivity
Cerebrovascular responses to hypoxia
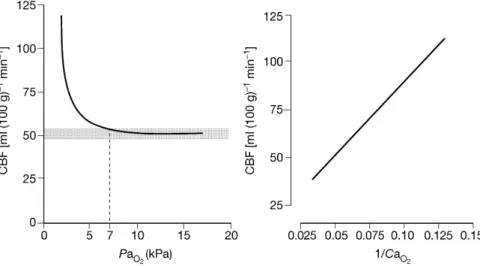
Many factors in¯uence CBF, including oxygen, carbon dioxide, metabolic demand and blood pressure. The clas-sical response of CBF to changes in the arterial partial pressure of oxygen (PaO2) is shown in Figure 1.
Over a normal physiological range of PaO2(7±13.33 kPa),
there is little change in CBF. This is because CBF is related
²AJJ is supported by an unrestricted neurosciences intensive care
research grant from Codman. LAS is supported by grants from the Margarete und Walter Lichtenstein-Stiftung (Basel, Switzerland), a Myron B. Laver Grant (Department of Anaesthesia, University of Basel, Switzerland) and the Swiss National Science Foundation, and is recipient of an Overseas Research Student Award (Committee of Vice-Chancellors and Principals of the Universities of the United Kingdom).
REVIEW ARTICLES
to the arterial content of oxygen (CaO2) rather than PaO2, and
the shape of the haemoglobin±oxygen dissociation curve means that CaO2is relatively constant over this PaO2range.
Hypoxaemia, however, is a potent stimulus for arterial dilatation, CBF beginning to increase at a PaO2of ~7 kPa
(53 mm Hg); a decrease in the PaO2from 6.67 to 3.33 kPa
(50 to 25 mm Hg) will produce cerebral vasodilatation suf®cient to double the CBF. Despite the fact that it is a fundamental and widely discussed response, data on the precise threshold at which hypoxic vasodilatation occurs are limited. The conventional thresholds quoted above arise from experimental work done in anaesthetized dogs in the 1960s.54 More recent work in awake volunteers suggests that hypoxic vasodilatation may be triggered at PaO2levels
as high as 7.9 kPa (60 mm Hg).28 The mechanisms responsible for this increase have been investigated exten-sively; hydrogen ions, potassium ions, adenosine, nitric oxide, arachidonic acid metabolites and ATP-sensitive K+ channels have all been implicated as mediators of the process.77Although clinical data from patients with chronic anaemia appear to relate CBF to CaO2rather than PaO2,
6the situation may be different with acute hypoxaemic chal-lenges and, at least in rodents, the PaO2appears to be more
important than the arterial oxygen content in regulating cerebral vascular tone.77
Cerebrovascular responses to hyperoxia
The response of CBF to hyperoxia (PaO2 >15 kPa,
113 mm Hg), the cerebral oxygen vasoreactivity (COVR), is less well de®ned. Kety and Schmidt originally described, using a nitrous oxide washout technique,45 a reduction in CBF of 13% and a moderate increase in cerebrovascular resistance in young male volunteers inhaling 85±100% oxygen.46 Subsequent human studies (Table 1), using a
variety of differing methods, have also shown CBF reductions with hyperoxia, although the reported extent of this change is variable.2 50 59 61 62 64 67 84 Omae and colleagues64 assessed how supra-atmospheric pressures in¯uenced CBF, as estimated by changes in middle cerebral artery ¯ow velocity (MCAFV) in healthy volunteers. Atmospheric pressure alone had no effect on MCAFV if PaO2 was kept constant. Increases in PaO2 did lead to a
signi®cant reduction in MCAFV; however, there were no further reductions in MCAFV when oxygen was increased from 100% at 1 atmosphere of pressure to 100% oxygen at 2 atmospheres of pressure. This suggests that the ability of the cerebral vasculature to constrict in response to increasing partial pressures of oxygen is limited. Although hyperbaric oxygen is thought to increase CBF in head-injured patients, when the CBF is measured before and after the period of hyperbaric oxygen; however, the acute response of CBF to hyperbaric oxygen after head injury is not known.66
Some of the differences between the studies may result from the varying methods used to measure CBF, each with its own advantages and disadvantages, effects on physiology, limits to the level of inspired oxygen achievable, and ability to determine changes in regional and global CBF. A full description of the different techniques is beyond the scope of this review, but the various techniques are summarized in Table 2; interested readers are directed to recent reviews on the subject.7 43 56 74Differences in respiratory physiology mean that there will be inter-individual differences in PaO2
for a given inspired fraction of oxygen (FIO2). It would
therefore seem more logical to quantify changes in CBF in terms of changes in PaO2rather than FIO2. As carbon dioxide
usually has a much more dramatic effect on CBF than oxygen, any measurement of COVR requires strict control of carbon dioxide or, at least, correction of CBF to take into account changes in carbon dioxide.
Fig 1 The in¯uence of arterial oxygen content (CaO2) and arterial partial pressure of oxygen (PaO2) on cerebral blood ¯ow (CBF). Below PaO2~7 kPa
(53 mm Hg), CBF increases. Within a normal physiological range of PaO2there is little change in CBF (shaded box). Adapted with permission.
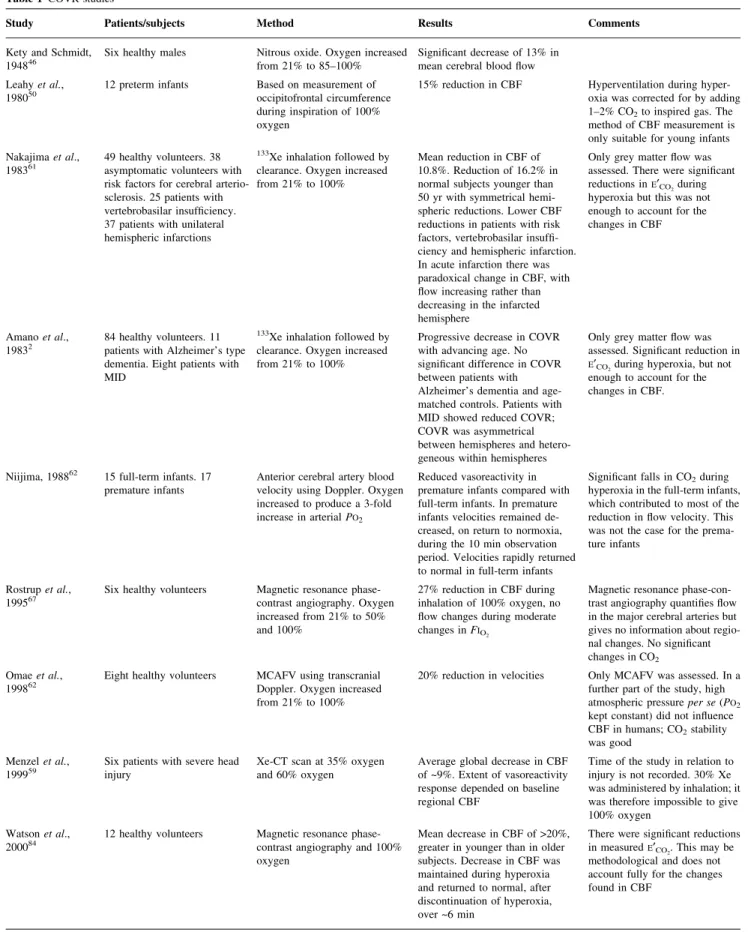
Table 1 COVR studies
Study Patients/subjects Method Results Comments
Kety and Schmidt,
194846 Six healthy males Nitrous oxide. Oxygen increasedfrom 21% to 85±100% Signi®cant decrease of 13% inmean cerebral blood ¯ow
Leahy et al.,
198050 12 preterm infants Based on measurement ofoccipitofrontal circumference
during inspiration of 100% oxygen
15% reduction in CBF Hyperventilation during
hyper-oxia was corrected for by adding
1±2% CO2to inspired gas. The
method of CBF measurement is only suitable for young infants Nakajima et al.,
198361 49 healthy volunteers. 38asymptomatic volunteers with
risk factors for cerebral arterio-sclerosis. 25 patients with vertebrobasilar insuf®ciency. 37 patients with unilateral hemispheric infarctions
133Xe inhalation followed by
clearance. Oxygen increased from 21% to 100%
Mean reduction in CBF of 10.8%. Reduction of 16.2% in normal subjects younger than 50 yr with symmetrical hemi-spheric reductions. Lower CBF reductions in patients with risk factors, vertebrobasilar insuf®-ciency and hemispheric infarction. In acute infarction there was paradoxical change in CBF, with ¯ow increasing rather than decreasing in the infarcted hemisphere
Only grey matter ¯ow was assessed. There were signi®cant
reductions inE¢CO2during
hyperoxia but this was not enough to account for the changes in CBF
Amano et al.,
19832 84 healthy volunteers. 11patients with Alzheimer's type
dementia. Eight patients with MID
133Xe inhalation followed by
clearance. Oxygen increased from 21% to 100%
Progressive decrease in COVR with advancing age. No signi®cant difference in COVR between patients with Alzheimer's dementia and age-matched controls. Patients with MID showed reduced COVR; COVR was asymmetrical between hemispheres and hetero-geneous within hemispheres
Only grey matter ¯ow was assessed. Signi®cant reduction in
E¢CO2during hyperoxia, but not
enough to account for the changes in CBF.
Niijima, 198862 15 full-term infants. 17
premature infants Anterior cerebral artery bloodvelocity using Doppler. Oxygen
increased to produce a 3-fold
increase in arterial PO2
Reduced vasoreactivity in premature infants compared with full-term infants. In premature infants velocities remained de-creased, on return to normoxia, during the 10 min observation period. Velocities rapidly returned to normal in full-term infants
Signi®cant falls in CO2during
hyperoxia in the full-term infants, which contributed to most of the reduction in ¯ow velocity. This was not the case for the prema-ture infants
Rostrup et al.,
199567 Six healthy volunteers Magnetic resonance phase-contrast angiography. Oxygen
increased from 21% to 50% and 100%
27% reduction in CBF during inhalation of 100% oxygen, no ¯ow changes during moderate
changes in FIO2
Magnetic resonance phase-con-trast angiography quanti®es ¯ow in the major cerebral arteries but gives no information about regio-nal changes. No signi®cant
changes in CO2
Omae et al.,
199862 Eight healthy volunteers MCAFV using transcranialDoppler. Oxygen increased
from 21% to 100%
20% reduction in velocities Only MCAFV was assessed. In a
further part of the study, high
atmospheric pressure per se (PO2
kept constant) did not in¯uence
CBF in humans; CO2stability
was good Menzel et al.,
199959 Six patients with severe headinjury Xe-CT scan at 35% oxygenand 60% oxygen Average global decrease in CBFof ~9%. Extent of vasoreactivity
response depended on baseline regional CBF
Time of the study in relation to injury is not recorded. 30% Xe was administered by inhalation; it was therefore impossible to give 100% oxygen
Watson et al.,
200084 12 healthy volunteers Magnetic resonance phase-contrast angiography and 100%
oxygen
Mean decrease in CBF of >20%, greater in younger than in older subjects. Decrease in CBF was maintained during hyperoxia and returned to normal, after discontinuation of hyperoxia, over ~6 min
There were signi®cant reductions
in measuredE¢CO2. This may be
methodological and does not account fully for the changes found in CBF
CBF=cerebral blood ¯ow, COVR=cerebral oxygen vasoreactivity, CT=x-ray computed tomography, CTOR=cerebral tissue oxygen reactivity,
E¢CO2=end-tidal carbon dioxide, FIO2=inspired fraction of oxygen, FV=¯ow velocity, GOS=Glasgow Outcome Score, MCA=middle cerebral artery,
MCAFV=middle cerebral artery ¯ow velocity, MID=multi-infarct dementia, MRI=magnetic resonance imaging, N2O=nitrous oxide, PO2=partial
While the physiological purpose of hypoxaemic vaso-dilatation is clear (maintenance of cerebral oxygen delivery), the reasons for hyperoxic vasoconstriction are less obvious. One hypothesis suggests that COVR is a mechanism by which the brain attempts to protect itself against high partial pressures of oxygen, perhaps to limit the production of oxygen free radicals. Pulmonary and central nervous system oxygen toxicity are well described in both animals and humans, and both are believed to result from excess production of reactive oxygen species and disinhibi-tion of the transcripdisinhibi-tion factor nuclear factor-kB (nuclear factor-kB has important proin¯ammatory activity).9±11 13 Central nervous system oxygen toxicity is a well-recognized problem in divers when exposed to oxygen pressures >160 kPa (1200 mm Hg), leading to convulsions and loss of consciousness, usually without any warning symptoms. It is interesting that hypercapnia lowers the threshold for central nervous system oxygen toxicity, probably because of vasodilatation and therefore increased exposure to oxygen. In rats, the central nervous system toxicity may result from nitric oxide-induced escape from oxygen-induced
vasoconstriction and thus exposure of tissues to excessive oxygen.14
Cerebral vasoreactivity in clinical settings
Three studies have looked more speci®cally at the effects of pathology on COVR (Table 1). Nakajima and colleagues61 showed that COVR is reduced in patients with risk factors for cerebral arteriosclerosis, vertebrobasilar insuf®ciency and hemispheric infarction. In fact, in acute infarction there was a paradoxical change in CBF, ¯ow increasing rather than decreasing in the infarcted hemisphere. Amano and colleagues2 showed reductions in COVR with age, and showed that COVR is reduced and more heterogeneous in patients with multi-infarct dementia than in age-matched controls. These studies suggest that there has been disrup-tion of the normal ability of the cerebral vasculature to constrict in the presence of high levels of arterial oxygen. Both studies used an inhalation xenon 133 (133Xe) washout technique for determining CBF, a technique that is most
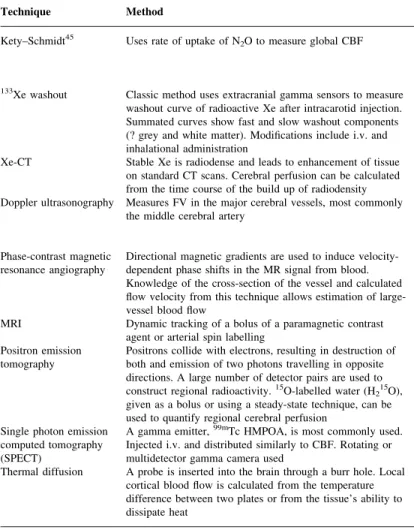
Table 2 Measurement of cerebral blood ¯ow
Technique Method Comments
Kety±Schmidt45 Uses rate of uptake of N
2O to measure global CBF Cumbersome and invasive. Requires jugular bulb and arterial
catheters. Overestimates low perfusion states. N2O is not a truly
inert tracer. The technique can be carried out using inert tracers such as krypton 85 and argon 25. Global measurement
133Xe washout Classic method uses extracranial gamma sensors to measure
washout curve of radioactive Xe after intracarotid injection. Summated curves show fast and slow washout components (? grey and white matter). Modi®cations include i.v. and inhalational administration
Predominantly a measure of cortical blood ¯ow. Limited spatial resolution. Recirculation and contamination by extracranial tissues may affect results. Regional CBF reductions on one side may be missed because of activity sensed in deeper or contralateral tissues. Regional measurement
Xe-CT Stable Xe is radiodense and leads to enhancement of tissue
on standard CT scans. Cerebral perfusion can be calculated from the time course of the build up of radiodensity
Signal-to-noise ratio can be high. Even low concentrations of Xe (30%) may in¯uence CBF. Regional measurement
Doppler ultrasonography Measures FV in the major cerebral vessels, most commonly
the middle cerebral artery Non-invasive. FV is an indirect measure of CBF. Use of FV toassess changes in CBF relies on stability of both the angle of
insonation and the diameter of the insonated vessel. Regional measurement
Phase-contrast magnetic
resonance angiography Directional magnetic gradients are used to induce velocity-dependent phase shifts in the MR signal from blood.
Knowledge of the cross-section of the vessel and calculated ¯ow velocity from this technique allows estimation of large-vessel blood ¯ow
Measure of CBF but not perfusion. Only a measure of ¯ow in large vessels (e.g. carotids), therefore poor spatial resolution
MRI Dynamic tracking of a bolus of a paramagnetic contrast
agent or arterial spin labelling Quanti®cation is dif®cult
Positron emission
tomography Positrons collide with electrons, resulting in destruction ofboth and emission of two photons travelling in opposite
directions. A large number of detector pairs are used to
construct regional radioactivity.15O-labelled water (H
215O),
given as a bolus or using a steady-state technique, can be used to quantify regional cerebral perfusion
15O has a short half-life and therefore repeated measurements are
possible. Coregistering with conventional CT or MRI images can enhance the spatial resolution. Expensive and technically demanding equipment. Arterial blood sampling required. Single photon emission
computed tomography (SPECT)
A gamma emitter,99mTc HMPOA, is most commonly used.
Injected i.v. and distributed similarly to CBF. Rotating or multidetector gamma camera used
Radiotracers have a long half-life that makes repeated measure-ments dif®cult. Quantitative measuremeasure-ments of CBF have not been very successful
Thermal diffusion A probe is inserted into the brain through a burr hole. Local
cortical blood ¯ow is calculated from the temperature difference between two plates or from the tissue's ability to dissipate heat
Invasive. Continuous. Only local, cortical blood ¯ow measured
suited to measurement of cortical blood ¯ow and provides little information about the white matter compartment.56 The use of several regional detectors placed over each cerebral hemisphere gives a certain amount of information on regional perfusion, although precise anatomical correl-ations, and comparisons of the same region from one study to another, are only semiquantitative. Menzel and col-leagues59used stable xenon computed tomography (CT) to determine COVR, which makes use of the fact that stable xenon is radiodense, and therefore CBF can be calculated from the time course of tissue build-up of radiodensity. They demonstrated a mean reduction in CBF of approxim-ately 9%, with an increase in inspired oxygen from 35 to 60%, in six patients with severe traumatic brain injury. The same group also assessed the response of CBF to hyperoxia in an undamaged region of interest in the right frontal lobe, and found an average reduction in CBF of 19.3%. Both globally and in the region of interest, the extent of the COVR was found to depend on the level of the baseline regional CBF (Fig. 2). It is dif®cult to draw ®rm inferences from Menzel's work as only six patients were studied, one of whom had negligible CBF, but it does serve to demonstrate the paucity of human data regarding traumatic brain injury and COVR.
COVR has not been compared with other measures of cerebral vascular reactivity, such as carbon dioxide reactivity (changes in CBF in response to changes in PaCO2) and pressure autoregulation, both of which are
known to be prognostic indicators after traumatic brain injury.12 53 63 70 73 Therefore, it is not known whether COVR is a measure of vascular reactivity per se (irrespec-tive of the stimulus) or whether the cerebrovascular response to oxygen is important in itself. Such comparisons probably need to be preceded by a better understanding of the physiology and a ®rmer methodological base.
Cerebral tissue oxygen partial pressures
Physiological premises
Measurement techniques
Several different types of tissue gas analysis probes are available which are capable of measuring the partial pressure of oxygen (PtO2) within a tissue of interest. The
volume of tissue sampled by these sensors is probably only in the order of a few cubic millilitres.30Although there is some uncertainty over the exact characteristics of the partial pressures that tissue sensors measure, for example whether recordings are representative of intracellular or extracellular gas pressures, and the in¯uence of sensor position in relation to capillaries and arterioles, PtO2is most probably a measure
of extracellular oxygen tension and thus re¯ects the balance between oxygen supply and tissue demand. In metabolically active tissue, an oxygen concentration gradient exists from the arterial to the venous ends of a capillary as a result of oxygen extraction. Normally it is assumed that there is a minimal oxygen gradient between the extracellular space and the end-capillary compartment, and thus that PtO2
re¯ects end-capillary oxygen tension. This may not be the case after a severe head injury, when large end-capillary±-tissue oxygen gradients occur, probably re¯ecting endovas-cular oedema or microscopic arteriovenous shunts.27
Cerebral tissue oxygen partial pressures (PbO2) can be
measured using one of the two commercially available sensors. The Licox system (GMS, Kiel-Mielkendorf, Germany) consists of a sensor that includes a polarographic Clark-type electrode, and a thermocouple for temperature measurement. The electrode consumes tiny quantities of the available tissue oxygen in an electrochemical reaction that produces an electrical signal that is proportional to PbO2.
The NeurotrendÔ system (Codman, Raynam, MA, USA) is made up of four different sensors (temperature, PbO2, PbCO2
Fig 2 Non-linear curve-®tting regression model between cerebral blood ¯ow (CBF) on 35% inspired oxygen (FIO2) and the percentage decrease in
CBF on 60% oxygen in a sequential double CBF study in six patients with severe traumatic brain injury. (A) CBF changes in a region of interest in
and pH) staggered over approximately 2 cm. The oxygen sensor consists of a ®bre in which the holes are ®lled with silicone rubber that contains entrapped ruthenium-based dye. Blue light at 450±470 nm is passed down the ®bre and is absorbed by the dye. The dye emits a proportion of the energy it has absorbed as light of wavelength 620 nm. However, in the presence of oxygen, the amount of this ¯uorescent light is reduced (so-called oxygen quenching). The amount of quenching is proportional to the concentra-tion of oxygen and thus, if the amount of ¯uorescent light is measured, an estimate of PbO2can be made. Both sensors
are approximately 0.5 mm in diameter but the oxygen-sensing areas are of different lengths; both can be implanted directly into brain tissue. The accuracies of the two sensors are quoted at between 0.1 and 0.5 kPa (1±3.5 mm Hg), but their accuracy declines when oxygen levels are supra-physiological. The two sensors have never been compared in a clinical situation. Before the Neurotrend sensor was developed, a Paratrend sensor (Codman) was used in some studies;58 59early models of the Paratrend used a modi®ed Clark electrode to measure oxygen partial pressure, but more recently oxygen-quenching technology has been introduced. The Clark electrode Paratrend has been com-pared in vivo with the Licox, with various reports on the comparability between the two sensors.68 79The Paratrend sensor is designed for arterial blood gas monitoring. It is calibrated to work at higher oxygen tensions and therefore may be more accurate in the measurement of supranormal oxygen levels.
Several other monitoring tools and imaging techniques are available to assess cerebral oxygenation, including jugular bulb oximetry, microdialysis parameters, near infrared spectroscopy and positron emission tomography with 15O; detailed descriptions of these techniques are beyond the scope of this review. Interested readers are directed to recent reviews on the subject.29 41
Normal values and modulators
Few data exist on normal values of PbO2in humans.
82In cats and dogs, normal values have been reported at 3.7 (SD 0.9) kPa [28 (7) mm Hg].52 Values of 4.3±4.7 kPa
(32±36 mm Hg) have been reported in normal tissue in three patients undergoing brain tumour surgery,4and values of 3.4±13.7 kPa (25±104 mm Hg) were reported in seven patients having elective clipping of intracranial aneur-ysms.15The variability in these ®gures may be explained in part by variations in the factors determining brain tissue oxygen, which are outlined below.
Cerebral blood ¯ow. There is con¯icting evidence as regards the relationship between PbO2 and CBF. Menzel
and colleagues59 and Doppenberg and colleagues16 have used a single stable xenon-CT scan to measure CBF in a region of interest around a Paratrend probe and have found reasonable correlations with PbO2. However, Gupta and
colleagues27did not ®nd a signi®cant correlation between
CBF and PbO2, using a Neurotrend sensor to determine PbO2
and H215O positron emission tomography imaging to determine CBF. All of these studies were in brain-injured patients.
Cerebral perfusion pressure. After traumatic brain injury, episodes of reductions in cerebral perfusion pressure (CPP) undoubtedly contribute to reductions in PbO2, various
thresholds for CPP having been reported.1 3 47 49Kiening and colleagues49were able to show a third-order regression correlation between PbO2and CPP when a Licox sensor was
inserted into non-injured frontal tissue.
PaCO2 and PaO2. In most head-injured patients,
hyper-ventilation results in a decrease in PbO2when the sensor is
placed in an uninjured part of the brain,26 37 although increases are more commonly seen when the sensor is in an area of pathology.26 Various studies have shown that episodes of hypoxaemia may contribute to reductions in PbO2.
1 49 82The changes in Pb
O2in response to hyperoxia
are discussed below (see Cerebral tissue oxygen reactivity). Ischaemia. Imbalances between metabolic demand and supply will lead to increases in oxygen extraction fraction and thus to reductions in end-capillary oxygen tension. Tissue oxygen levels should therefore re¯ect changes in oxygen supply±demand relationships. Although some cor-relations have been found between PbO2and other indicators
of ischaemia, such as jugular venous oxygen saturation (SjO2)
23 26 37 49 and regional lactate levels,78 a poor correlation was found between PbO2 and end-capillary
oxygen tension, as calculated from 15O positron emission tomography data.27 Poor correlations are not necessarily surprising, as differences in the mechanisms of ischaemia and the ischaemic burden will in¯uence different monitor-ing modalities in different ways, as will the compartment from which the measurement is made. Ischaemic thresholds for PbO2have been variably described using a number of
different approaches, such as outcome analysis after head injury,5 16 17 47 59 79 81 85 relating Pb
O2 to recognized
threshold limits for CBF,17 59relating Pb
O2to SjO2limits,
49 assessing PbO2 in patients with a compromised cerebral
circulation,31and assessing thresholds for infarction during cerebral aneurysm clipping.44The threshold for ischaemia that is most commonly used is approximately 1.3 kPa (10 mm Hg).
Pharmacological and pathological modulation of CMRO2. If ¯ow±metabolism coupling is intact, changes in the cerebral metabolic rate of oxygen (CMRO2) should not result in changes in PbO2. However, normal coupling of
CBF is only retained in 45% of comatose head-injured patients,63 and pharmacological manipulation of CMRO
2 may also disrupt normal coupling. Two studies have suggested that etomidate can lead to reductions in PbO2,
probably a result of a reduction in oxygen supply attribut-able to vasoconstriction, which is over and above the reduction in metabolic oxygen requirements. Des¯urane has the opposite effect, with increases in PbO2 as inhaled
des¯urane increases from 3% to 9%, probably as a result of vasodilatation and hyperaemia. PbO2falls with a reduction
in temperature, the fall becoming signi®cant at a brain temperature below 35°C.25 This reduction in Pb
O2 is
associated with increases in SjO2and therefore may
repre-sent a change in oxygen off-loading at the capillary level as the oxygen dissociation curve shifts to the left. Mitochondrial dysfunction will result in impaired ability to utilize oxygen and a low CMRO2, and could arguably result in vasodilatation; consequently PbO2will be raised.
This constellation of ®ndings would seem plausible in mitochondrial dysfunction, but has not been con®rmed by robust experimental data in humans or experimental models.
Cerebral tissue oxygen reactivity
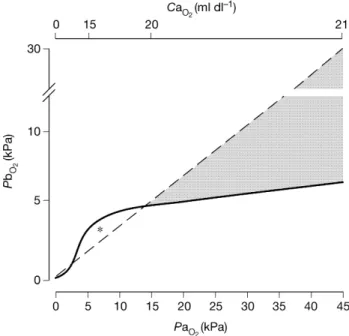
The expected changes in PbO2 that occur with changes in
PaO2 [cerebral tissue oxygen reactivity (CTOR)] are not
immediately intuitive. If brain tissue oxygen were depen-dent on arterial oxygen content, then, because of the shape of the oxygen dissociation curve, one would expect to see little change in PbO2 during normoxia and hyperoxia. If
brain tissue oxygen were dependent on PaO2, one would
expect changes in PaO2to be exactly re¯ected by changes in
PbO2. In practice, changes in PbO2with changes in PaO2do
not ®t either of these models. The experimental evidence suggests that PbO2increases with an increase in PaO2, but the
increase is damped (Fig. 3).
The term CTOR describes the changes in brain tissue oxygen that occur with changes in arterial oxygenation during hyperoxia. Various ethical and methodological problems mean that measurement of a normal CTOR is much more dif®cult than measurement of a normal COVR (Table 3).
Quanti®cation
Van Santbrink and colleagues described the formula that is the most widely used for measuring CTOR:82
CTOR=%DPbO2/DPaO2(mm Hg)
One of the problems with the van Santbrink method is that, for the same change in PaO2, a small, and probably
clinically insigni®cant, increase in PbO2from 0.1 to 0.2 kPa
(0.8 to 1.6 mm Hg) would give the same CTOR as an increase in PbO2from 5 to 10 kPa (38 to 76 mm Hg).
Brain tissue oxygen normally has a linear relationship to PaO2.
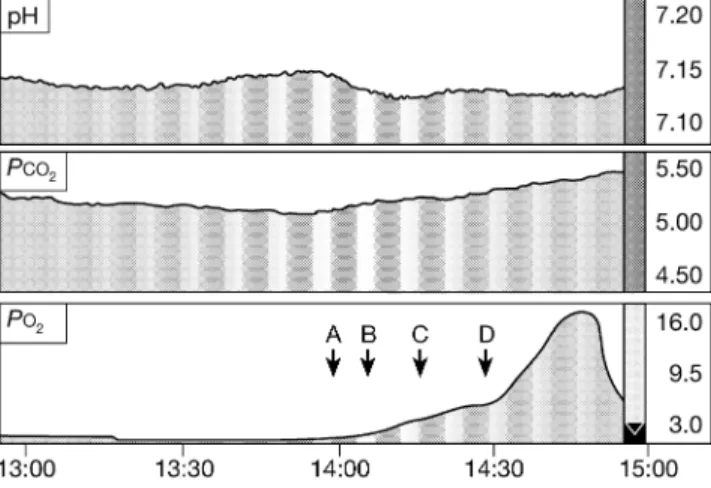
59 82This relationship provides an alternative method of determining CTOR, which avoids the problems inherent in the van Santbrink method, CTOR being quanti®ed by the gradient of the linear regression line. It is also essential to make measurements during periods of stable physiology. We have seen that that the process of equilibration between arterial and brain oxygen may be extremely prolonged (Fig. 4), which is probably a result of low perfusion. Therefore, in order to determine an accurate CTOR, suf®cient time must be given for PbO2to reach a steady state.
Depending on the increase in PaO2 and the degree of
CTOR, both methods may rely on accurate measurements of a high PbO2. This in itself may present a problem, as the
sensors that are available are only designed to measure tissue oxygen accurately within a normal physiological range. What both methods lack is the ability to describe the clinical signi®cance of the improvement in PbO2. Various
retrospective studies have shown that periods of low brain tissue oxygen correlate with an unfavourable neurological outcome after severe traumatic brain injury.5 16 17 47 59 79±82 85 These data are consistent with studies showing that jugular venous desaturations correlate with poor neurological outcome;22 65 however, one large study of 119 patients failed to show a signi®cant correlation between either PbO2
or SjO2 and outcome.
69 The threshold for unfavourable outcome has been variably reported at between 0.8 and
Fig 3 Two hypothetical models of the relationships between brain tissue
oxygen (PbO2) and arterial oxygen content (CaO2) (solid line) and
between PbO2and arterial partial pressure of oxygen (PaO2) (dashed line).
Hyperoxia (PaO2>15 kPa) is indicated by the shaded area; within this
region the relationship does not ®t either model but falls between the two
(see text). Note the non-linear CaO2axis. *There are very little data to
support either model under hypoxic conditions.
Table 3 Dif®culties in measurement of normal CTOR Invasive brain tissue monitors required, e.g. Neurotrend
Measurements of tissue oxygen are very local and may not fully re¯ect global heterogeneity
Probe insertion normally requires general anaesthesia, which may have
independent effects on tissue PO2
For ethical reasons, human subjects can only have brain tissue oxygen monitoring if there is an ongoing pathological process
2.6 kPa (6±20 mm Hg). It is not known if prospective interventions aimed at achieving brain tissue oxygen levels above these thresholds affect outcome, but it would be useful if the calculation of CTOR indicated how changes in PbO2related to these potentially bene®cial thresholds.
Normal values
Using van Santbrink's formula, Menzel and colleagues57 described a normal CTOR, measured in the frontal lobe of healthy anaesthetized piglets, as 0.21 (SD0.12). CTOR has
been assessed in humans, in non-pathological brain tissue of patients undergoing neurosurgery for brain tumours.21 Changes in PaO2 may not only affect PbO2 but also its
homogeneity in tissues. Eintrei and Lund21used a multiwire electrode to measure cortical tissue oxygen and showed that, once the inspired oxygen reached 30%, brain tissue oxygen became more scattered, heterogeneity increasing as the inspired oxygen increased to 100%. Only three of the six patients studied had an increase in mean brain tissue oxygen when on oxygen 100% compared with normoxia. The same group also studied the effects of hyperoxia on pig cerebral cortex,21where a similar increase in tissue oxygen hetero-geneity was seen. All six pigs showed an increase in mean tissue oxygen with hyperoxia but the reactivity varied widely. Regional CBF was estimated in the pigs using a washout curve of locally applied 133Xe. Although, when compared with levels at an inspired oxygen fraction of 0.21, CBF fell by an average of 40% at an inspired oxygen fraction of 1.0, the extent of the reduction in CBF did not correlate with the changes in brain tissue oxygen.
Pathological values
Four studies have investigated oxygen reactivity in humans with cerebral pathology (Table 4).48 55 59 82 Both van Santbrink and colleagues82 and Menzel and colleagues59 found a signi®cant correlation between high oxygen reactivity and poor outcome (Glasgow Outcome Score 1,
2 or 3) after traumatic brain injury, the differences in reactivity being most signi®cant on day 1. Neither study was powered to ®nd a difference; this was an incidental statistical ®nding. Van Santbrink and colleagues82 also found that patients who had high brain oxygen levels had signi®cantly higher oxygen reactivity, perhaps representing deranged oxygen reactivity during the hyperaemic stage after a head injury. The same group also looked at the response of PbO2to induced changes in PaCO2, and found
that the response on day 1 was signi®cantly lower than on days 3 and 5 after traumatic brain injury, a result also found by Carmona Suazo and colleagues.8Impairments in brain oxygen `carbon dioxide reactivity' are further evidence of impaired vascular reactivity after traumatic brain injury, which did not correlate with outcome. Meixensberger and colleagues55 found higher CTORs in pathological brain tissue than in normal brain tissue, whereas Kiening and colleagues48found a lower CTOR close to lesioned areas.
Other factors that have been shown to in¯uence CTOR include hypercarbia and depth of iso¯urane anaesthesia, both of which increase CTOR.33 34 It appears that non-physiological vasodilatation (i.e. true hyperaemia) results in an increase in CTOR.
Clinical signi®cance
Pathophysiological implications. A high CTOR could represent one of two possible scenarios. It could either represent vasomotor paralysis or it could be an appropriate physiological response to ischaemia. Even normal or high PbO2values do not exclude tissue hypoxia. Mitochondrial
dysfunction is being increasingly recognized after severe traumatic brain injury, and this could certainly result in high tissue oxygen levels despite histotoxic hypoxia.83
Prognostic inferences. As mentioned previously, a signi®-cant relationship between CTOR and outcome after traumatic brain injury has been found in two studies.59 82 Therapeutic interventions. Only one study has assessed the impact of hyperoxia on cerebral ischaemia after severe TBI.58 It was found that increasing inspired oxygen from 35% to 100% for 6 h led to a 359 (SD39)% increase in brain
tissue oxygen and a 40% decrease in brain lactate concen-tration. The lactate/pyruvate ratio, which is more commonly used as an indicator of the redox state of the brain,41was not assessed.
It is certainly possible to increase brain tissue oxygen levels from an ischaemic level to a non-ischaemic level by increasing the inspired fraction of oxygen, but there are no randomized controlled trials assessing the impact of brain tissue oxygen-targeted therapy after traumatic brain injury. The effects of hyperoxia on cerebral metabolism and ischaemia require further exploration using techniques such as microdialysis, phosphorus and proton magnetic resonance spectroscopy, and magnetic resonance diffusion-weighted imaging.
Fig 4 Neurotrend printout showing pH, carbon dioxide and brain tissue
oxygen in response to changes in inspired oxygen (FIO2) in a
head-injured patient. A, FIO20.25 (start of monitoring); B, FIO2 0.5; C, FIO2
0.73; D, FIO20.98. All other physiological variables were stable during
Table 4 CTOR studies Study Probe Position Patient numbers Time Method Results Comments Meixensberger et al ., 1993 55 Modi®ed Clark Cortical surface, avoiding pial vessels 26 patients undergoing elective craniotomy. Divided into 2 groups, normal and pathological, depending on CT/MRI appearances of cortex. Pathological further separated depending on the degree of oedema on CT/MRI and presence of swelling after opening dura At time of surgery Increase inspired oxygen to 100% Signi®cant difference, between normal and pathological groups, in % brain oxygen change (137.8 vs 352, P=0.0095) Relative oxygen reactivity not calculated. Signi®cant differ-ences in arterial oxygen and brain temperature between normal and pathological groups at baseline Correlation between arterial and brain oxygen Signi®cant correlation between arterial and brain oxygen concen-tration in pathological group (correlation even stronger in oedema subgroup) at baseline F IO2 and 100% oxygen van Santbrink et al ., 1996 82 Licox Right frontal 18 with traumatic brain injury Daily for 5 days Increase inspired oxygen to 100% in steps. CTOR calculated Mean CTOR 0.7. Signi®cant difference in mean and day 1 CTOR between favourable [0.55 ( SD 0.41)] and unfavour-able [0.94 (0.48)] 6 month outcome Study was not powered to ®nd a difference in outcome; this was an incidental statistical ®nding. Area of the brain monitored in relation to the site of injury was not speci®ed. Not all of the 18 patients studied were studied every day (maximum number on any one day was 16) Kiening et al ., 1998 48 Licox Bifrontal, one probe close to lesion, one probe in normal tissue 6 TBI, 1 SAH Days 2±12 after insult 16 oxygen reactivity tests, 1±3 per patient. Exact method not speci®ed Reduced oxygen reactivity in lesioned area Oxygen reactivity not quanti-®ed. Reactivity only different when there were differences in brain tissue oxygen between the two probes Menzel et al ., 1999 59 Paratrend Right frontal, non-injured region 14 with traumatic brain injury Within 14 h of admission to intensive care unit Increase inspired oxygen to 100% in steps. CTOR calculated CTOR range 0.2±2.1, mean 0.7. Signi®cant difference in CTOR between favourable (GOS 1, 2, 3), 0.4 6 0.2, and unfavourable (GOS 4,5), 0.9 6 0.6, 3 month outcome Area of the brain monitored in relation to site of injury was not speci®ed. Study was not powered to ®nd a difference in outcome; this was an incidental statistical ®nding. SAH= subarachnoid hae morrha ge, TBI=traum atic bra in injury. For oth er abbr eviations see fo otnote to Table 1. For method of calculation of CT OR see te xt .
Mechanisms
The mechanisms that lie behind hyperoxia-induced changes in tissue blood ¯ow and the regulation of tissue oxygen partial pressures remain unclear. In human skeletal muscle, hyperoxia causes an increase in the mean tissue oxygen partial pressure, but with signi®cant heterogeneities, with some regions of the tissue actually showing reduced oxygen pressures compared with normoxia.51This increase in tissue oxygen heterogeneity with hyperoxia is also seen in the brain in both pigs21 72 and man.21 The increase in heterogeneity is speculated to be a result of redistribution of blood ¯ow, with vasoconstriction in some areas and shunting in others. Various mediators and mechanisms have been suggested to play a role in COVR, including increased effects of serotonin,75 76nitric oxide synthase inhibition,71 inhibition of endothelial prostaglandin synthesis60 and increased leukotriene production.39 40
Despite a number of advances in the last decade, the exact site and mechanism of the oxygen sensor is yet to be fully elucidated and, indeed, there may be more than one sensor.38 Many physiologically relevant genes are activated during conditions of hypoxia, including those encoding erythro-poietin, vascular endothelial growth factor, inducible nitric oxide synthase and glycolytic enzymes. Remarkably, at the transcriptional level, these diverse genes are all under the control of a crucial transcription factor: hypoxia-inducible factor 1 (HIF-1).24HIF-1 is a heterodimeric protein complex composed of two subunits: a constitutively expressed b-subunit and an a-subunit, the expression and activity of which are controlled by the intracellular oxygen concentra-tion. During normoxia, HIF-1a is rapidly degraded by the ubiquitin proteasome system, whereas exposure to hypoxic conditions prevents its degradation.35 36 This oxygen-dependent instability may provide a means by which gene expression is controlled during changes in oxygen tension (Fig. 5). We speculate that hyperoxia reduces the intra-cellular HIF-1 concentration, thus reducing the activity of important enzymes involved in glycolysis, such as phospho-fructokinase and 6-phosphofructo-2-kinase/fructose-2,6-bisphosphatase. A reduction in glycolysis would reduce lactic acid production and intracellular buffering, and thus modulate CBF. Indeed, we have seen that, in healthy volunteers, hyperoxia modulates the haemodynamic re-sponse to hyperventilation, and we speculate that this is a result of reduced HIF-1 concentration and a decrease in lactic acid production and intracellular buffering.42 The effects of hyperoxia on cerebral glycolysis, metabolism and ischaemia could be further explored using techniques such as microdialysis, phosphorus or proton magnetic resonance spectroscopy, and magnetic resonance diffusion-weighted imaging. However, it is unlikely that it will be possible to measure HIF-1 concentrations in vivo because of its intracellular position, large size and instability. It should certainly be possible to explore the effects of hyperoxia on HIF-1 in the laboratory using cultured cell lines.
Conclusions
There is substantial evidence that CBF falls during periods of hyperoxia, this fall having been variably reported between 10 and 27% in healthy volunteers. There is some evidence that COVR is disturbed by vascular disease and traumatic brain injury.
Normal CTOR has not been well de®ned but it seems to be in¯uenced by carbon dioxide, iso¯urane anaesthesia and cerebral pathology, including traumatic brain injury. Although CTOR has been shown in two studies to have prognostic signi®cance after traumatic brain injury, further work needs to be done in this ®eld. Temporal and spatial pro®les of brain tissue oxygen reactivity need to be better de®ned, as do the in¯uences of anaesthesia and sedation, temperature and vasoactive agents. We have seen that brain tissue oxygen does not always have a linear relationship with arterial oxygen, and that the process of equilibration
Fig 5 Many physiologically relevant genes are activated during conditions of hypoxia, including those encoding erythropoietin, vascular endothelial growth factor, inducible nitric oxide synthase and glycolytic enzymes. At the transcriptional level these diverse genes are all under the control of a crucial transcription factor: hypoxia-inducible factor 1 (HIF-1). HIF-1 is a heterodimeric protein complex composed of an a and b subunit. During normoxia, HIF-1a is rapidly degraded by the ubiquitin proteasome system, whereas exposure to hypoxic conditions prevents its degradation. This oxygen-dependent instability may provide a means by which gene expression is controlled during changes in oxygen tension.
between arterial and brain oxygen may be extremely prolonged (Fig. 4). For these reasons, de®nitions for CTOR need to be more tightly de®ned.
If COVR and CTOR are to be used for diagnostic or prognostic purposes, or to direct therapy, then the methodo-logical issues surrounding their measurement must be taken into account and future studies must be based on a ®rm methodological foundation.
Whether poor COVR and supranormal CTOR describe the same phenomenon is not yet known. How COVR and CTOR integrate with more classic autoregulatory mechan-isms requires investigation, as do the basic physiological mechanisms that lie behind COVR and CTOR. Abnormal pressure autoregulation and carbon dioxide reactivity are known to correlate with poor outcome after traumatic brain injury;12 53 63 70 73further work is required to assess whether COVR and CTOR offer complementary information. Positron emission tomography, and magnetic resonance imaging using hyperpolarized gases or per¯uorocarbons, may allow further exploration of the relationships between brain tissue oxygen, CBF, end-capillary oxygen tension, COVR and CTOR.18 20 27
Further studies are required to determine whether hyperoxia can provide clinical bene®ts in patients with brain injury. At an appropriate stage, such studies should include a randomized controlled trial assessing the use of high fractions of inspired oxygen in the management of severe traumatic brain injury.
References
1 al-Rawi PG, Hutchinson PJ, Gupta AK, et al. Multiparameter brain tissue monitoring±correlation between parameters and identi®cation of CPP thresholds. Zentralbl Neurochir 2000; 61: 74±9
2 Amano T, Meyer JS, Okabe T, Shaw T, Mortel KF. Cerebral vasomotor responses during oxygen inhalation. Results in normal aging and dementia. Arch Neurol 1983; 40: 277±82 3 Artru F, Jourdan C, Perret-Liaudet A, Charlot M, Mottolese C.
Low brain tissue oxygen pressure: incidence and corrective therapies. Neurol Res 1998; 20: S48±51
4 Assad F, Schultheiss R, Leniger-Follert E, Wullenweber R. Measurement of local oxygen partial pressure (PO2) of the
brain cortex in cases of brain tumours. Adv Neurosurg 1984; 12: 263±6
5 Bardt TF, Unterberg AW, Hartl R, et al. Monitoring of brain tissue PO2in traumatic brain injury: effect of cerebral hypoxia on
outcome. Acta Neurochir Suppl 1998; 71: 153±6
6 Brown MM, Wade JP, Marshall J. Fundamental importance of arterial oxygen content in the regulation of cerebral blood ¯ow in man. Brain 1985; 108: 81±93
7 Calamante F, Thomas DL, Pell GS, Wiersma J, Turner R. Measuring cerebral blood ¯ow using magnetic resonance imaging techniques. J Cereb Blood Flow Metab 1999; 19: 701±35 8 Carmona Suazo JA, Maas AI, van den Brink WA, et al. CO2
reactivity and brain oxygen pressure monitoring in severe head injury. Crit Care Med 2000; 28: 3268±74
9 Christman JW, Blackwell TS, Juurlink BH. Redox regulation of
nuclear factor kappa B: therapeutic potential for attenuating in¯ammatory responses. Brain Pathol 2000; 10: 153±62 10 Christman JW, Sadikot RT, Blackwell TS. The role of nuclear
factor-kappa B in pulmonary diseases. Chest 2000; 117: 1482±7 11 Clark JM, Thom SR. Toxicity of oxygen, carbon dioxide, and carbon monoxide. In: Bove AA, ed. Diving Medicine, 3rd edn. Philadelphia: W.B. Saunders, 1997; 131±45
12 Czosnyka M, Smielewski P, Kirkpatrick P, Menon DK, Pickard JD. Monitoring of cerebral autoregulation in head-injured patients. Stroke 1996; 27: 1829±34
13 D'Angio CT, Finkelstein JN. Oxygen regulation of gene expression: a study in opposites. Mol Genet Metab 2000; 71: 371±80
14 Demchenko IT, Boso AE, Whorton AR, Piantadosi CA. Nitric oxide production is enhanced in rat brain before oxygen-induced convulsions. Brain Res 2001; 917: 253±61
15 Doppenberg EM, Watson JC, Broaddus WC, et al. Intraoperative monitoring of substrate delivery during aneurysm and hematoma surgery: initial experience in 16 patients. J Neurosurg 1997; 87: 809±16
16 Doppenberg EM, Zauner A, Bullock R, et al. Correlations between brain tissue oxygen tension, carbon dioxide tension, pH, and cerebral blood ¯owÐa better way of monitoring the severely injured brain? Surg Neurol 1998; 49: 650±4
17 Doppenberg EM, Zauner A, Watson JC, Bullock R. Determination of the ischemic threshold for brain oxygen tension. Acta Neurochir Suppl 1998; 71: 166±9
18 Eberle B, Markstaller K, Schreiber WG, Kauczor HU. Hyperpolarised gases in magnetic resonance: a new tool for functional imaging of the lung. Swiss Med Wkly 2001; 131: 503±9 19 Edelman GJ, Hoffman WE, Charbel FT. Cerebral hypoxia after etomidate administration and temporary cerebral artery occlusion. Anesth Analg 1997; 85: 821±5
20 Eidelberg D, Johnson G, Barnes D, et al. 19F NMR imaging of blood oxygenation in the brain. Magn Reson Med 1988; 6: 344±52 21 Eintrei C, Lund N. Effects of increases in the inspired oxygen fraction on brain surface oxygen pressure ®elds in pig and man. Acta Anaesthesiol Scand 1986; 30: 194±8
22 Gopinath SP, Robertson CS, Contant CF, et al. Jugular venous desaturation and outcome after head injury. J Neurol Neurosurg Psychiatry 1994; 57: 717±23
23 Gopinath SP, Valadka AB, Uzura M, Robertson CS. Comparison of jugular venous oxygen saturation and brain tissue Po2 as monitors of cerebral ischemia after head injury. Crit Care Med 1999; 27: 2337±45
24 Guillemin K, Krasnow MA. The hypoxic response: huf®ng and HIFing. Cell 1997; 89: 9±12
25 Gupta AK, Al-Rawi PG, Hutchinson PJ, Kirkpatrick PJ. Effect of hypothermia on brain tissue oxygenation in patients with severe head injury. Br J Anaesth 2002; 88: 188±92
26 Gupta AK, Hutchinson PJ, Al-Rawi P, et al. Measuring brain tissue oxygenation compared with jugular venous oxygen saturation for monitoring cerebral oxygenation after traumatic brain injury. Anesth Analg 1999; 88: 549±53
27 Gupta AK, Hutchinson PJ, Fryer T, et al. Measurement of brain tissue oxygenation performed using positron emission tomography scanning to validate a novel monitoring method. J Neurosurg 2002; 96: 263±8
28 Gupta AK, Menon DK, Czosnyka M, Smielewski P, Jones JG. Thresholds for hypoxic cerebral vasodilation in volunteers. Anesth Analg 1997; 85: 817±20
29 Haitsma IK, Mass AI. Advanced monitoring in the intensive care unit: brain tissue oxygen tension. Curr Opin Crit Care 2002; 8: 115±20
30 Hoffman WE, Charbel FT, Abood C, Ausman JI. Regional ischemia during cerebral bypass surgery. Surg Neurol 1997; 47: 455±9
31 Hoffman WE, Charbel FT, Edelman G. Brain tissue oxygen, carbon dioxide, and pH in neurosurgical patients at risk for ischemia. Anesth Analg 1996; 82: 582±6
32 Hoffman WE, Charbel FT, Edelman G, Misra M, Ausman JI. Comparison of the effect of etomidate and des¯urane on brain tissue gases and pH during prolonged middle cerebral artery occlusion. Anesthesiology 1998; 88: 1188±94
33 Hoffman WE, Edelman G. Enhancement of brain tissue oxygenation during high dose iso¯urane anesthesia in the dog. J Neurosurg Anesthesiol 2000; 12: 95±8
34 Hoffman WE, Edelman G, Wheeler P. Cerebral oxygen reactivity in the dog. Neurol Res 2000; 22: 620±2
35 Huang LE, Arany Z, Livingston DM, Bunn HF. Activation of hypoxia-inducible transcription factor depends primarily upon redox-sensitive stabilization of its alpha subunit. J Biol Chem 1996; 271: 32253±9
36 Huang LE, Gu J, Schau M, Bunn HF. Regulation of hypoxia-inducible factor 1alpha is mediated by an O2-dependent
degradation domain via the ubiquitin±proteasome pathway. Proc Natl Acad Sci USA 1998; 95: 7987±92
37 Imberti R, Bellinzona G, Langer M. Cerebral tissue PO2 and
SjvO2changes during moderate hyperventilation in patients with
severe traumatic brain injury. J Neurosurg 2002; 96: 97±102 38 Jackson WF. Arteriolar oxygen reactivity: where is the sensor?
Am J Physiol 1987; 253: H1120±6
39 Jackson WF. Arteriolar oxygen reactivity is inhibited by leukotriene antagonists. Am J Physiol 1989; 257: H1565±72 40 Jackson WF. Regional differences in mechanism of action of
oxygen on hamster arterioles. Am J Physiol 1993; 265: H599±603 41 Johnston AJ, Gupta AK. Advanced monitoring in the neurology intensive care unit: microdialysis. Curr Opin Crit Care 2002; 8: 121±7
42 Johnston AJ, Steiner LA, Balestreri M, Gupta AK, Menon DK. Hyperoxia and the cerebral haemodynamic responses to moderate hyperventilation. Acta Anaesthesiol Scand. 2003; in press
43 Joshi S, Ornstein E, Young E. Cerebral and spinal cord blood ¯ow. In: Cottrell J, Smith D, eds. Anesthesia and Neurosurgery, 4th edn. St Louis: Mosby, 2001; 19±67
44 Kett-White R, Hutchinson PJ, Al-Rawi PG, et al. Cerebral oxygen and microdialysis monitoring during aneurysm surgery: effects of blood pressure, cerebrospinal ¯uid drainage, and temporary clipping on infarction. J Neurosurg 2002; 96: 1013±19
45 Kety SS, Schmidt CF. The determination of cerebral blood ¯ow in man by the use of nitrous oxide in low concentrations. Am J Physiol 1945; 14: 353±66
46 Kety SS, Schmidt CF. The effects of altered arterial tensions of carbon dioxide and oxygen on cerebral blood ¯ow and cerebral oxygen consumption of normal young men. J Clin Invest 1948; 27: 487±92
47 Kiening KL, Hartl R, Unterberg AW, et al. Brain tissue pO2
-monitoring in comatose patients: implications for therapy. Neurol Res 1997; 19: 233±40
48 Kiening KL, Schneider GH, Bardt TF, Unterberg AW, Lanksch WR. Bifrontal measurements of brain tissue-PO2in comatose
patients. Acta Neurochir Suppl 1998; 71: 172±3
49 Kiening KL, Unterberg AW, Bardt TF, Schneider GH, Lanksch WR. Monitoring of cerebral oxygenation in patients with severe head injuries: brain tissue PO2 versus jugular vein oxygen
saturation. J Neurosurg 1996; 85: 751±7
50 Leahy FA, Cates D, MacCallum M, Rigatto H. Effect of CO2and
100% O2on cerebral blood ¯ow in preterm infants. J Appl Physiol
1980; 48: 468±72
51 Lund N, Jorfeldt L, Lewis DH. Skeletal muscle oxygen pressure ®elds in healthy human volunteers. A study of the normal state and the effects of different arterial oxygen pressures. Acta Anaesthesiol Scand 1980; 24: 272±8
52 Maas AI, Fleckenstein W, de Jong DA, van Santbrink H. Monitoring cerebral oxygenation: experimental studies and preliminary clinical results of continuous monitoring of cerebrospinal ¯uid and brain tissue oxygen tension. Acta Neurochir Suppl 1993; 59: 50±7
53 Marion DW, Bouma GJ. The use of stable xenon-enhanced computed tomographic studies of cerebral blood ¯ow to de®ne changes in cerebral carbon dioxide vasoresponsivity caused by a severe head injury. Neurosurgery 1991; 29: 869±73
54 McDowall D. Interrelationships between blood oxygen tension and cerebral blood ¯ow. In: Payne J, Hill D, eds. Oxygen measurements in blood and tissue. London: Churchill, 1966; 205±14
55 Meixensberger J, Dings J, Kuhnigk H, Roosen K. Studies of tissue PO2 in normal and pathological human brain cortex. Acta
Neurochir Suppl 1993; 59: 58±63
56 Menon DK. Cerebral circulation. In: Priebe H, Skarvan K, eds. Cardiovascular Physiology, 2nd edn. London: BMJ Books, 2000; 240±77
57 Menzel M, Doppenberg EM, Zauner A, et al. Cerebral oxygen reactivity determinationÐa simple test with potential prognostic relevance. Zentralbl Neurochir 2000; 61: 181±7
58 Menzel M, Doppenberg EM, Zauner A, et al. Increased inspired oxygen concentration as a factor in improved brain tissue oxygenation and tissue lactate levels after severe human head injury. J Neurosurg 1999; 91: 1±10
59 Menzel M, Doppenberg EM, Zauner A, et al. Cerebral oxygenation in patients after severe head injury: monitoring and effects of arterial hyperoxia on cerebral blood ¯ow, metabolism and intracranial pressure. J Neurosurg Anesthesiol 1999; 11: 240±51
60 Messina EJ, Sun D, Koller A, Wolin MS, Kaley G. Increases in oxygen tension evoke arteriolar constriction by inhibiting endothelial prostaglandin synthesis. Microvasc Res 1994; 48: 151±60
61 Nakajima S, Meyer JS, Amano T, et al. Cerebral vasomotor responsiveness during 100% oxygen inhalation in cerebral ischemia. Arch Neurol 1983; 40: 271±6
62 Niijima S, Shortland DB, Levene MI, Evans DH. Transient hyperoxia and cerebral blood ¯ow velocity in infants born prematurely and at full term. Arch Dis Child 1988; 63: 1126±30 63 Obrist WD, Lang®tt TW, Jaggi JL, Cruz J, Gennarelli TA.
Cerebral blood ¯ow and metabolism in comatose patients with acute head injury. Relationship to intracranial hypertension. J Neurosurg 1984; 61: 241±53
64 Omae T, Ibayashi S, Kusuda K, et al. Effects of high atmospheric pressure and oxygen on middle cerebral blood ¯ow velocity in humans measured by transcranial Doppler. Stroke 1998; 29: 94±7 65 Robertson CS, Gopinath SP, Goodman JC, et al. SjvO2
monitoring in head-injured patients. J Neurotrauma 1995; 12: 891±6
66 Rockswold SB, Rockswold GL, Vargo JM, et al. Effects of hyperbaric oxygenation therapy on cerebral metabolism and intracranial pressure in severely brain injured patients. J Neurosurg 2001; 94: 403±11
67 Rostrup E, Larsson HB, Toft PB, Garde K, Henriksen O. Signal changes in gradient echo images of human brain induced by hypo- and hyperoxia. NMR Biomed 1995; 8: 41±7
68 Sarrafzadeh AS, Kiening KL, Bardt TF, et al. Cerebral oxygenation in contusioned vs. nonlesioned brain tissue: monitoring of PtiO2
with Licox and Paratrend. Acta Neurochir Suppl 1998; 71: 186±9
69 Sarrafzadeh AS, Peltonen EE, Kaisers U, et al. Secondary insults in severe head injuryÐdo multiply injured patients do worse? Crit Care Med 2001; 29: 1116±23
70 Schalen W, Messeter K, Nordstrom CH. Cerebral vasoreactivity and the prediction of outcome in severe traumatic brain lesions. Acta Anaesthesiol Scand 1991; 35: 113±22
71 Schmetterer L, Findl O, Strenn K, et al. Role of NO in the O2and
CO2 responsiveness of cerebral and ocular circulation in
humans. Am J Physiol 1997; 273: R2005±12
72 Sjoberg F, Gustafsson U, Eintrei C. Speci®c blood ¯ow reducing effects of hyperoxaemia on high ¯ow capillaries in the pig brain. Acta Physiol Scand 1999; 165: 33±8
73 Smielewski P, Czosnyka M, Kirkpatrick P, Pickard JD. Evaluation of the transient hyperemic response test in head-injured patients. J Neurosurg 1997; 86: 773±8
74 Steiner LA, Czosnyka M. Should we measure cerebral blood ¯ow in head injured patients? Br J Neurosurg 2002; 16: 429±39 75 Thorborg P, Gustafsson U, Sjoberg F, Harrison DK, Lewis DH.
Effect of hyperoxemia and ritanserin on skeletal muscle micro¯ow. J Appl Physiol 1990; 68: 1494±500
76 Thorborg P, Lund N. Serotonin as a modulator of skeletal muscle oxygenation: effects of ketanserin and ritanserin on oxygen pressure distributions. Int J Microcirc Clin Exp 1989; 8: 191±203
77 Tomiyama Y, Brian JE Jr, Todd MM. Cerebral blood ¯ow during
hemodilution and hypoxia in rats: role of ATP-sensitive potassium channels. Stroke 1999; 30: 1942±7; discussion 1947±8 78 Valadka AB, Goodman JC, Gopinath SP, Uzura M, Robertson CS. Comparison of brain tissue oxygen tension to microdialysis-based measures of cerebral ischemia in fatally head-injured humans. J Neurotrauma 1998; 15: 509±19
79 Valadka AB, Gopinath SP, Contant CF, Uzura M, Robertson CS. Relationship of brain tissue PO2to outcome after severe head
injury. Crit Care Med 1998; 26: 1576±81
80 van den Brink WA, van Santbrink H, Avezaat CJ, et al. Monitoring brain oxygen tension in severe head injury: the Rotterdam experience. Acta Neurochir Suppl 1998; 71: 190±4
81 van den Brink WA, van Santbrink H, Steyerberg EW, et al. Brain oxygen tension in severe head injury. Neurosurgery 2000; 46: 868±76; discussion 876±8
82 van Santbrink H, Maas AI, Avezaat CJ. Continuous monitoring of partial pressure of brain tissue oxygen in patients with severe head injury. Neurosurgery 1996; 38: 21±31
83 Verweij BH, Muizelaar JP, Vinas FC, et al. Impaired cerebral mitochondrial function after traumatic brain injury in humans. J Neurosurg 2000; 93: 815±20
84 Watson NA, Beards SC, Altaf N, Kassner A, Jackson A. The effect of hyperoxia on cerebral blood ¯ow: a study in healthy volunteers using magnetic resonance phase-contrast angiography. Eur J Anaesthesiol 2000; 17: 152±9
85 Zauner A, Doppenberg EM, Woodward JJ, et al. Continuous monitoring of cerebral substrate delivery and clearance: initial experience in 24 patients with severe acute brain injuries. Neurosurgery 1997; 41: 1082±91; discussion 1091±3