HAL Id: inserm-00473943
https://www.hal.inserm.fr/inserm-00473943
Submitted on 21 Sep 2011
HAL is a multi-disciplinary open access
archive for the deposit and dissemination of sci-entific research documents, whether they are pub-lished or not. The documents may come from teaching and research institutions in France or abroad, or from public or private research centers.
L’archive ouverte pluridisciplinaire HAL, est destinée au dépôt et à la diffusion de documents scientifiques de niveau recherche, publiés ou non, émanant des établissements d’enseignement et de recherche français ou étrangers, des laboratoires publics ou privés.
means of Laguerre tessellation.
Jeremy Esque, Christophe Oguey, Alexandre de Brevern
To cite this version:
Jeremy Esque, Christophe Oguey, Alexandre de Brevern. A novel evaluation of residue and protein volumes by means of Laguerre tessellation.. Journal of Chemical Information and Modeling, American Chemical Society, 2010, 50 (5), pp.947-60. �10.1021/ci9004892�. �inserm-00473943�
A novel evaluation of residue and protein volumes
by means of Laguerre tessellation
Jeremy Esque1§, Christophe Oguey1 & Alexandre G. de Brevern2
1 LPTM, CNRS UMR 8089, Université de Cergy Pontoise, 2 av. Adolphe Chauvin - 95302
Cergy-Pontoise, France.
2 INSERM UMR-S 665, Dynamique des Structures et Interactions des Macromolécules
Biologiques (DSIMB), Université Paris Diderot - Paris 7, INTS, 6, rue Alexandre Cabanel, 75739 Paris Cedex 15, France
Short title: Amino acid and protein volumes.
§ Corresponding author: Jeremy Esque, LPTM, CNRS (UMR 8089), Université de Cergy
Pontoise, 2 av. Adolphe Chauvin - 95302 Cergy-Pontoise, France.
Email addresses: jeremy.esque@u-cergy.fr, oguey@u-cergy.fr, alexandre.debrevern@univ-paris-diderot.fr.
Keywords: protein structures, residue relative accessibility, secondary structure, protein contacts, Voronoi tessellation, Delaunay tessellation.
Abstract
Amino acids control the protein folding process and maintain its functional fold. This study underlines the interest of the Laguerre tessellation to determine relevant amino acid volumes in proteins. Previous studies used a limited number of proteins and only buried residues. The present computations improve the method and results on three main points: (i) a large high-quality updated and refined databank of proteins; (ii) all residues are taken into account, including those at the protein surface, thanks to (iii) the addition of a realistic solvent. The new values of the average and standard deviation of amino acid volumes show significant corrections with respect to previous studies. Another issue of the method is the polyhedral protein/water interface area (PIA) which quantifies the exposure of atoms or residues to the solvent. We propose this PIA as a new, parameter free, alternative for measuring accessibility. The comparison with NACCESS is satisfactory; however, the methods disagree in pointing out buried residues: where NACCESS evaluates to zero, the exposure given by PIA ranges from 0 to 20%. Variations of average residue volumes have been analyzed in several conditions, e.g., how they depend on protein size and on secondary structure environments. As it is based on strong mathematical grounds and on numerous high quality protein structures, our work gives a reliable methodology and up-to-date values of amino acid volumes and surface accessibility.
INTRODUCTION
Proteins are functional biological macromolecules, composed of series of residues. The residue specificity is given by its side chain 1. To a large extent, the interactions between residues govern the protein folding and maintain its folded structure. In the structure, each residue occupies a specific volume. Many studies have determined amino acid volumes either by experiments or computed from protein structures 2-7. Now, in a majority of proteins, matter is tightly condensed 8 and the volumes can be considered as intrinsic properties of amino acid species. Checking that this is true, with very few exceptions provided the volumes are evaluated properly, is one of the main issues of the present work. In other words, volumes become predictable or checkable quantities with a large degree of confidence. So, determining pertinent amino acid volumes and their range of variations is a key question with numerous implications in theoretical and applied fields: the packing of globular proteins, the search of cavities, the study of deformations, internal motion, transport or the formation of complexes, to mention only a few.
In this field, the weighted Voronoi tessellation is a pertinent method. It consists of a space partition by a collection of polyhedra filling space without overlaps nor gaps. In the protein context, it was first used by Richards 5 who calculated the atomic volumes in a globular protein, using a very limited number of protein structures. Further developments have been done since, e.g., by Gellatly and Finney 2, or Goede and co-workers 9. Richards noticed two recurrent problems in applying the Voronoi tessellation to protein structures. First, the volumes of residues near the surface of proteins are difficult to estimate because their polyhedra have no limits. Therefore, many studies were restricted to the buried atoms, i.e., to the protein core. To determine and discard the residues near the surface, two main protocols have been used: (i) an algorithm of rolling ball 4 or (ii) a sphere union representation 10-12. Another method is to embed the protein in a solvent, which can be either an artificial model 10-12 or a more realistic set of water molecules relaxed by molecular dynamics 13. The second problem relies on the fact that the classical Voronoi tessellation treats all atoms as equivalent, regardless of their physico-chemical nature (Van der Waals radii) 4, 14. Pontius and co-workers justified the classical Voronoi method by the fact that proteins are a highly heterogeneous medium and by the difficulty to find an adequate set of atomic radii. Richards' way 5 of introducing weighting parameters leads to inconsistencies in the space partition. The method was greatly improved, yielding a correct space partition, by Gellatly and Finney 2. The resulting diagram, the Laguerre polyhedral tessellation or power diagram, uses a notion of
radical distance depending on the weights. Goede and co-workers 9 suggested a more complex tessellation, in which the polyhedral facets were not planar anymore.
Applications of the Voronoi and Delaunay tessellations to protein structures are numerous. The Voronoi methods have been used widely to characterize various protein properties such as protein energy 15, protein-protein interactions 16, standard volumes of residues 3, packing of protein core 16, packing at the interface with water 13, 17, protein cavities 18, 19, the quality of protein crystal structures 4, the packing of protein atoms 20. This approach has shown its relevance for secondary structure assignment 21 and structural alignment 22. Voronoi's method and its variants can also be applied at a supra-atomic scale to centroids specifying the residues or small molecules position 12, 23.
The Delaunay tessellation defines links between atoms. The resulting graph has been used, among others, to detect local structural motifs 24-26, to determine families of residue packing motifs 27, 28, to assign secondary structures 29, or to define a scoring function for mutagenesis 30. From the Delaunay tessellations, algorithms have been developed for the structural alignment of proteins 31, 32. This approach has also an interest for structure prediction, in computing statistical potentials 33-36. The Delaunay or Voronoi tessellations provide a set of contacts between atoms, or structural elements 37, which can be used to set a scoring function for protein fold recognition 38, or to analyze protein-protein interfaces 39.
The present study provides a new set of values of average residue volumes. Several reasons motivate a novel evaluation. In the past years, many proteins have been resolved and the number of structures available has increased by an order of magnitude. The statistics of our values are based on a new, refined databank of non-redundant high quality proteins. We have been particularly careful in adding water around the protein structures. Then the Laguerre method with well tuned weights is applied to the complete structure; so that all the surface residues can be included in the statistics. This methodology not only improves greatly the accuracy of the statistical results, but it also gives support to the notion of an effective volume, intrinsic to almost each residue species. Properties of accessible residues can also be investigated in this way. To our knowledge, it is the first time that all residues (surface and bulk) are taken into account in evaluating their volumes using a refined databank.
An interesting extension of our study concerns the location of buried residues. Directly deduced from our contact-based method, a polyhedral interface area (PIA) with solvent can be defined and compared with the “classical” accessible surface area (ASA) provided by NACCESS 40. A good correlation is found between both quantities. However, noticeable discrepancies appear when those methods are used as criteria to select the buried or exposed
residues. In some cases, the classical method qualifies residues as buried while they have a contact area with water.
Finally, an analysis of the dependence of volumes and contacts on structural factors such as protein size or secondary structures shows that the proteins are folded as dense objects, confirming previous results.
MATERIALS AND METHODS
Dataset. A non-redundant protein databank has been built from only globular proteins taken
from the Protein Data Bank (PDB) 41. The set of proteins has been selected through the PISCES database 42, 43 using the following two criteria: (i) a resolution better than 2.5 Å and (ii) a pairwise sequence identity between all proteins less than 25%. Only complete protein chains without any missing atom have been kept. The final dataset is composed of 357 single chains comprising 80,360 residues. All protein structures have been treated by the GROMACS software in order to add a realistic solvent (water) which has been relaxed to near equilibrium by a short molecular dynamics run (see below). For comparison purposes, we have also used Pontius' dataset comprising 65 proteins 4; 2 obsolete entries have been updated: PDB code 2WRP and 4PTP have been replaced by 2OZ9 44 and 5PTP 45, respectively.
Addition of water molecules. The addition of water molecules was performed with
GROMACS, version 3.1.1 46-49. Each simulation was done under the ffG43a1 force field 50 and SPC (single point charge) water model 51. The structure was then immersed in a periodic water box neutralized with Na+ or Cl- counter-ions. Each system was energy-minimized with a steepest-descent algorithm for 1000 steps. During the following steps, temperature and pressure were maintained constant to 300 K and 1 bar thanks to the Berendsen algorithm 52. The coupling time constants were τt=0.1 ps and τp=0.5 ps for temperature and pressure respectively. An integration step of 2 fs was chosen and bond length was constrained thanks to the LINCS algorithm 53. A cut-off of 1.4 nm was used for non-bonded interactions in association with the Generalized-Reaction-Field algorithm 54 for long-range electrostatic interactions using a dielectric constant of 52.
Softwares. The surface accessibility of residues is evaluated by NACCESS 40, using the default parameter (1.4 Å for the probe radius). The secondary structure assignments are performed by DSSP 55. Three classes have been assigned: the helices (corresponding to
α-helices, 310-helices and α-helices assignment), the β-strands sheets) and the coils (β-bridges, turns, bends, and coil). Figures of protein have been produced with PyMol 56.
Tessellations for proteins. A tessellation is a partition of space, i.e, a collection of
polyhedra filling space without overlaps nor gaps. Laguerre tessellations were computed by VLDP (Voronoi Laguerre Delaunay Protein), a program developed at the LPTM (Laboratoire Physique Théorique et Modélisation, Cergy, France). The program builds the Delaunay tessellation and its Laguerre dual by incremental insertion of the sites. Both Delaunay and Laguerre tessellations are based on the same data: a set of sites, each given by a point and a weight. Usually, and this is our case, the sites are the atomic positions and weights of the system (protein and solvent), but the construction can be used at a coarser level where each site represents a small molecule (water) or a residue (through its Cα 12, 57 atom or any appropriately defined molecular center 23). The weights are defined below. The Delaunay tessellation divides space into tetrahedra whose vertices are the system sites. In the Laguerre tessellation, each polyhedron is convex and most often surrounds a single site 58 (a vertex of the Delaunay diagram). The shape of these polyhedra depends on the weights and mutual positions of neighboring sites 57. The Voronoi partition is a special case of the Laguerre where all the weights are equal. In the Voronoi case, each polyhedron contains exactly one data site, while in weighted Laguerre partitions, some sites may end up sitting outside their corresponding polyhedra. However we always tune the weights so as to preserve a 1-1 correspondence between data sites and Laguerre polyhedra. Further details on the Delaunay-Laguerre diagrams and duality can be found in the literature 59 and in Supplementary data 1.
In our analysis, all the atoms of the data set are used: amino acids, solvent, ions, etc, with only exception for the hydrogen atoms of the proteins, systematically dropped. Including all the atoms implies heavier computation, but results in a better accuracy of volume values. The main role of the solvent is to close the surface of the polyhedra at the protein surface.
Laguerre weights. For geometrical consistency the Laguerre weight w at each atomic site
must depend on the atom size, whence on its Van der Waals radius r. For the relevant atoms, we took the default values from GROMACS 48, i.e., 1.5 for C, 1.05 for O, 0.4 for H, 1.1 for N and 1.6 for S (in Å).
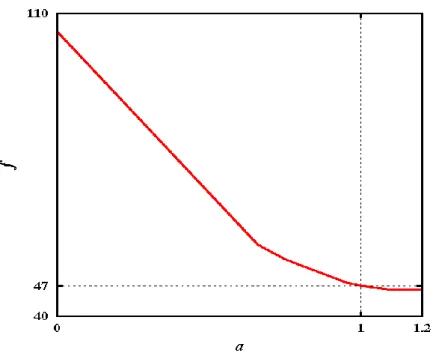
The simplest relation compatible with dimensional homogeneity is w = a r² (adding a global constant to the weights does not change the tessellation). The constant factor a is determined by a least square method: minimizing a cost function f proportional to the sum of the volume
variances weighted by the population of each amino acid in the databank. Figure 1 shows that
f(a) is minimal and nearly constant beyond a = 1. The left end of the graph, a = 0, corresponds
to Voronoi (equal weight for all atoms). We choose a = 1 because it is as far as possible from the right end of the graph (a ~= 1.2), a value at which some Laguerre polyhedra vanish.
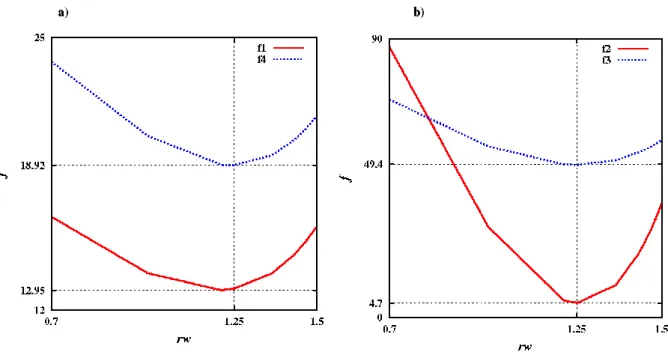
In the cases where hydrogen is absent, water oxygen gets special values: r = 1.25 Å, w = 1.58. Those values were determined by minimizing several cost functions; as shown on Figure 2; all these functions are minimal at nearly the same value:
rw Nw = i rf w i rw v v Nw = f 1 2 1 1 (1) 20 1 2 2 20 1 = a ref a a v v = f (2) v N Naa = f a = a avar 1 20 1 3 (3) 20 1 4 var var 1 = a a a w rw rw v N + v Nw Naa + Nw = f (4)
where vi are the volumes, Nwrw the total number, of water molecules in contact with protein;
vwref = 29.9 Å3 is the nominal molecular volume of water at density 1 g/cm3; v is the a average, vara(v) the variance, of the volume of amino acid a over the entire databank; varef, the reference for amino acid a, is the mean volume calculated over buried residues only; Naa =
a
N is the total number of amino acids. All quantities depend on water radius r except Naa,
Na, vwref, varef, which are constant. For single point water molecules (only oxygen), we find an optimal radius of 1.25 Å, somewhat less than the standard Van der Waals value 1.4 Å for water, suggesting an average compression of water near the protein.
Accessibility and polyhedral interface. Buried residues are determined by the criterion that
their atoms have no surface accessible to the solvent. This accessibility can be calculated in two ways: (i) NACCESS is meant to give the area of the surface accessible to solvent (ASA: Accessible Surface Area), suitably normalized. (ii) In Laguerre's partition, the residue-water contacts are represented by a precise subset of faces of the Laguerre polyhedra; the area of these faces defines PIA (Polyhedral Interface Area). The latter is normalized by the total area of the residue boundary, i.e., of the faces separating the atoms of the studied residue from
atoms outside the residue (belonging to other residues or to solvent). This approach quantifies exposure as the area percentage of contacts with solvent. In method (i), a residue is buried if NACCESS evaluates to zero; NACCESS being used with its default parameters, 1.4 Å for the radius of the rolling ball. In method (ii), a residue is buried if none of its faces is shared with water: PIA = 0.
RESULTS
Global average residue volumes. The volumes of Laguerre polyhedra give quantitative
information about the packing of amino acids. The tessellation is built at the atomic level and the volume occupied by any residue or molecule is the sum of the volumes of its constituent atoms.
Various methods have been used to compute amino acid volume. Table 1 summarizes the results of some of the most important work done with tessellations 3, 4, 15. Pontius et al. get the volumes from the Voronoi diagrams (see Table 1, col. 3), whereas Chothia and Harpaz use a weighted tessellation (see Table 1, col. 6 and 9). This last work extends Voronoi by tuning the geometry on a set of weights computed from the chemical group radii. It must be noticed that those three studies give the mean volumes of buried residues only. Indeed, to get reasonable polyhedra around exposed residues, the system must be surrounded by solvent or other molecules. The shape and volume of Voronoi polyhedra strongly depend on the environment: partner residues, solvent, or contact with other molecules. As consequence, without solvent around, intrinsic metrical characteristics, if any, can only concern buried residues.
The last column of Table 1 gives volume values obtained directly from experimental measurements of amino acids in solution 7. Because of the rigidity and steric repulsion of residues within proteins, the volumes of amino acids are, on average, smaller in solution than in proteins. In most cases, the numerical values of Pontius, Harpaz and Chothia are bigger than the experimental partial specific volumes. Nevertheless, an excellent Pearson correlation coefficient (PCC) is seen between partial specific volumes and the other volumes (PCC of Zamyatnin vs Pontius equals 0.976, vs Chothia 0.986 and vs Harpaz 0.996). The values depend on the geometrical method in a way slightly varying with the amino acid species. The volume of homo-dipeptides in solution exceeds the volume of residues (Glycine (G): 63.3 Å3, Alanine (A): 91.6 Å3, Serine (S): 92.8 Å3). The size of the dataset used for the statistics also influences the results (see Table 1, col. 2, 5 and 8). The larger the number of residues taken into account, the closer the computed volumes get to the measured ones.
For our study, we have added water molecules, a realistic solvent, to our proteins. The system's free energy has been minimized using classical molecular dynamics. Thus all the residues, buried or exposed, can be included in the evaluation and a comparative analysis can be carried out. Moreover, we have assessed the sensitivity of our approach by representing water with or without hydrogen: (i) single site water molecules, made of oxygen with a slightly larger van der Waals radius; (ii) complete water molecules comprising two hydrogens and one oxygen. All our analyses were carried out without hydrogen in the proteins. Hydrogen is often not seen by diffraction techniques, and positioning hydrogen in proteins remains a delicate question, among others because of (de)ionization processes. Table 2 summarizes all the results.
The Voronoi method (see Table 2, col. 3), with H in water molecules, decreases the average residue volumes by ~12% compared with Pontius values, but the standard deviations are larger. This volume decrease comes from a known artifact of (equal weight) Voronoi diagrams. Indeed, when two neighboring atoms (or sites in a general case) have significantly different sizes, the Voronoi algorithm puts the face separating the two polyhedra at equal distance from both atoms. A more natural subdivision, based on electron orbitals or Van der Waals radii, would put the separation closer to the small atom than to the big one. The net result is a bias towards the average in estimating the atomic specific volumes; larger atoms get a lower volume in the presence of small neighbors than surrounded by atoms of the same size; reciprocally, small atoms like H get larger volumes than in a homogeneous set of atoms. In our case, the bias comes from H atoms which are taken into account only for water. When the subdivision is performed at the scale of one site per residue or water molecule, the bias originates from the difference in average size between water molecules and amino acid residues. Of course, in the single site water description, the standard deviations and the differences with Pontius' values are smaller because all the atoms have similar size (see Table 2, col. 5).
In our application of the Laguerre tessellation, the weight of each atom is the square of its Van der Waals radius (see Material & methods section). With such a suitable choice of weights, the Laguerre (or power) diagrams do not suffer from the volume bias. This is our main reason for choosing this method. Moreover, standard deviations are reduced, supporting the notion that effective volumes are intrinsic to each residue species, independent of the environment. As seen for Laguerre (see Table 2, col. 8 and 10) and for Voronoi (see Table 2, col. 4 and 6), the decrease in standard deviations is really important, indicating that Laguerre's method is more accurate.
Explicit water hydrogen has little effect on the residue average Laguerre volumes (typically less than 1 Å3 variation), except for charged amino acids: Lysine (K), Glutamate (E), Aspartate (D), and Arginine (R). The surrounding of these residues differs because of their hydrophilic character and the way they interact with water. Indeed, the amino acids charged negatively (E and D) attract water hydrogen via their carboxyl function (COO-), explaining that their volume increases when H is taken off from water. The residues charged positively, via their amino function (NH2+, NH3+), interact repulsively with water hydrogen yielding an opposite effect when H is removed: their Laguerre volume decreases on average.
Laguerre's method coupled with explicit water H gives the lowest residue volume standard deviations (see Table 2, col. 8) , highlighting that the presence of hydrogen is an improvement for the fine determination of the protein surface and of the volumes of polyhedra at the surface. Another argument is the excellent value of PCC, 0.993, between Laguerre volumes with explicit water H and Zamyatnin volumes (experimental values).
Mean Voronoi volume of buried amino acids. As seen in previous paragraphs, we propose
a more precise measurement of amino acid volumes, by (i) taking into account all the protein residues, (ii) embedding the proteins in water and (iii) using weighted partitions. In the previous paragraph, we saw that, in the Voronoi case, the solvent had an influence on the average volumes.
Here, to assess the quality of our comparison, we first use the same dataset as Pontius et al. and select only buried residues, as Pontius et al. did. A residue is buried if NACCESS evaluates to zero. NACCESS has been used with its default parameters, i.e., 1.4 Å for the radius of the rolling ball, slightly less than the 1.5 Å used by Pontius. The mean Voronoi volumes calculated on this set of buried residues give a very good agreement with Pontius' results (see Table 3, col. 3) underlining the consistency of our approach. The slight observed differences could come from the selection of buried residues depending on the rolling ball and Van der Waals radii. We choose NACCESS for selection because it conforms to previous studies with which we do comparison. Indeed, NACCESS with default parameters is the most usual method to compute relative accessibility.
Our non-redundant protein structure databank contains about 3.6 times more buried residues than Pontius' dataset (see Table 3, col. 2 and 5). In most cases, the average Voronoi volumes from our databank are a little smaller than those of Pontius, with a maximum difference of 5 Å3 for R (see Table 3, col. 3 and 6). The maximum difference in favor of our databank is 5 Å3 for cysteine C, probably due to the proportion of Cysteine/Cystine (796/138), the Cysteines
having a bigger volume. Thus, volume averages are sensitive to the extension of the databank and results from sets with few buried residues must be taken carefully.
To ensure a proper and more realist environment than vacuum, we have added water molecules and minimized energy using GROMACS software. Even if the proteins have been constrained, slight fluctuations are observed (much smaller than experimental ones). This is expected as the minimization is done in a specific solvent with software dedicated to molecular dynamics. In most cases, the Voronoi tessellation, computed on proteins treated by GROMACS and discarding water afterwards, gives slightly smaller amino acid volumes than those from the non-relaxed PDB files (see Table 3, col. 6 and 9). The maximum difference is 8.2 Å3 for Tryptophan (W), then 4.1 Å3 for Phenylalanine (F) and 3.9 Å3 for Tyrosine (Y). Those are big residues having aromatic side-chains or flexible groups. The small residues, as G, S and Proline (P), show negligible differences. Even if the differences are small, they seem real, as confirmed by similar computations using Laguerre tessellation. The origin of this discrepancy is a delicate question; a full discussion is out of scope here. Let us only mention one possibility: a number of chains of our databank are extracted from multimeric proteins, complexes and crystals. It is reasonable to think that relaxation in water, being less constrained, yields more compact conformations than in more rigid environments where steric blockage prevents full compaction.
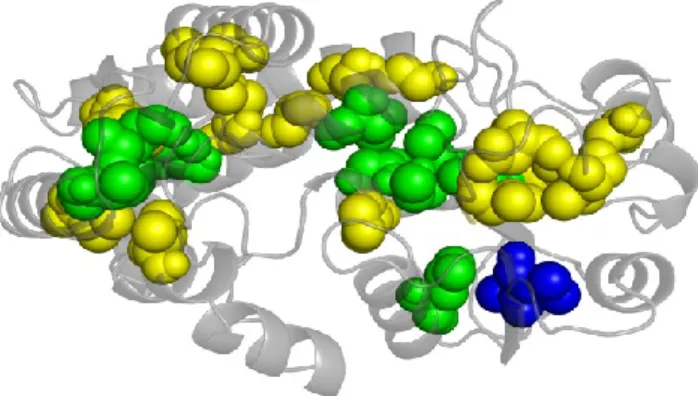
The solvent affects residue volumes even when they are buried. Indeed, for all amino acids, the mean Voronoi volumes are smaller when the solvent is included around the proteins than without solvent (see Table 3, col. 9 and 11). For residues in contact with water molecules, this volume decrease was previously shown to be largely an artifact of Voronoi tessellation. But speaking of buried residues, this influence comes out as a paradox. The fact is that buried residues, selected by their vanishing accessible surface area (ASA=0) still feel the influence of heterogeneous surroundings. This is confirmed by the fact that their PIA is often non zero; they have contact with water. Figure 3 gives a visual example of the difference between the selection criteria. Accessible and buried residues of a folate-dependent dehydrogenase / cyclohydrolase bifunctional enzyme (PDB code 1a4i 60) have been computed using NACCESS and PIA. 27 residues are considered as buried by NACCESS and 13 by VPIA, 11 by both (in green) while 2 are found only by VPIA (in blue) and 16 only by NACCESS (in yellow). The selection by LPIA differs from VPIA for only two residues: Glycine (GLY) 8 and Methionine (MET) 273, considered as buried by NACCESS and LPIA, but not by VPIA.
With these results in mind, let us enforce the criterion. A buried residue must have (i) zero accessibility as given by NACCESS (see below) and (ii) zero PIA; in other words, none of its
atomic Voronoi polyhedra shares any face with water. Only 40% of the NACCESS buried residues survive in this restricted set (see Table 3, col. 13). In most cases, the mean Voronoi volumes are larger than their counterpart in the extended set (see Table 3, col. 11and 14). Once again, it shows that the volume decrease noticed in Table 3 comes from contacts with the solvent, in particular with water hydrogen. Some values must be taken carefully as the number of occurrences is now more limited.
A similar comparison has been done between Laguerre and Voronoi for those strongly buried residues. A good agreement between amino acid volumes is observed (see sup. data 2) underlining the excellent reliability of the Laguerre method. The volume variations due to the presence or not of hydrogen in water are below 1/1000, while the raw difference between Laguerre and Voronoi is below 2 Å3.
Exposure effect on the average residue volumes. We explore more deeply the effect of
accessibility on average volumes by splitting the residues into two categories: (i) the exposed residues, defined by a value of NACCESS larger than 25%, and (ii) the buried ones with NACCESS less than 25%.
Using Voronoi's approach, amino acid volumes are smaller for the exposed residues than for residues within protein core (see Table 4, col. 5 and 7). The relative difference, of the order of 9.15%, is systematic for all residue species, confirming the Voronoi volume discrepancies. The largest discrepancies occur for E and D, 13.8 and 14.8% respectively; the part beyond 9.15 % is explained by potential interactions between water hydrogen and their carboxyl function (COO-). On the other hand, R and K have the smallest volume decrease between the exposed and core protein regions; this can be understood by potential hydrogen bonds between their amino function (NH2) and water oxygen, repelling the hydrogen further away.
Strikingly, such differences do not appear in the Laguerre diagrams. On average, a relative volume difference of 0.62% between interior and surface volumes is found, well below standard deviations. These results underline the fine tuning of Laguerre's algorithm. A further benefit of the Laguerre method is a reduction of the standard deviations around the mean values compared with Voronoi. D and E are the only residues with a net (Laguerre) volume decrease of 4.3% and 3.8% respectively. Interestingly, it indicates a tighter packing at the surface than in the protein core. These relative differences are smaller than those given by Voronoi analysis (see Table 4, col. 4 and 6), confirming that nearly 10% of the decrease could
be attributed to the Voronoi bias. The remaining part, surviving in the Laguerre partition, is a physical effect due to the attraction between the (COO-) group and water H, as already explained.
The NACCESS accessibility threshold fixed at 25% gives a nearly even distribution of the residues in both categories (see Table 4, col. 2 and 3). The proportion of buried residues is strongly correlated with their hydrophobicity as defined by Fauchère and Pliska 61 (see Figure 4). Hydrophilic residues are more numerous in the high accessibility class, near the surface and inversely.
The systematic decrease of Voronoi volumes is a geometrical bias, linked to contacts of residues with water hydrogen, but it is not correlated with hydrophobicity (PCC of -3.73*10 -2). Those results underline that the packing at the protein-water interface does not depend on the chemical nature of the residues, except for the four amino acids with strong acido-basic character (D, E, K, R).
Accessible surface area (ASA) and polyhedral interface area (PIA). As previously shown
(cf. section Mean Voronoi volumes of buried amino acids), accessibility defined using a rolling ball (NACCESS) or a polyhedral protein-solvent interface (the Voronoi/Laguerre tessellation) gives different results in selecting entirely buried residues. So let us explore the specificities of each method.
In the Laguerre tessellation, residues are encompassed into series of polyhedra; so the interface is represented by set of contact faces between polyhedra of residues and water, the relative area of which defines the Voronoi/Laguerre Polyhedral Interface Area. PIA is this area reported to the residue total area (specific to each instance). ASA is normalized differently, by a set of tabulated constants corresponding to average areas in tripeptide environment.
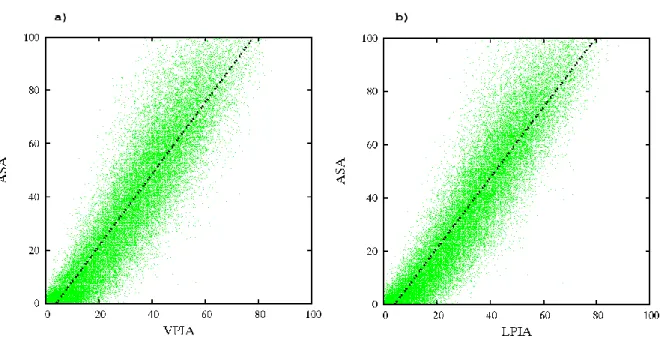
A very good correlation is found between ASA and VPIA (0.920), and ASA and LPIA (0.931) (see Figure 5). A linear regression between ASA (y) and PIA can be computed: y = 1.347*x − 5.269 for x representing VPIA and y = 1.323*x − 5.356 for x representing LPIA. The slope (1.323 or 1.347) reflects that the relative areas are normalized differently in NACCESS and VLDP. The shift at the origin shows that NACCESS qualifies residues as buried (ASA = 0) whereas their PIA ranges between 0 and 20%. Hence, a significant number of amino acids have water contacts even though NACCESS determines them as buried. Precisely 3431 residues (4.27% of the databank) with a null ASA have a non zero VPIA, higher than 10% for 92 of them. In the Laguerre case, 3113 residues (3.87% of databank) with
null ASA have a non zero LPIA, higher than 10% for 86 of them. This striking difference has two major causes: (i) the algorithms: ASA is based on fixed Van der Waals radii, potentially less sensitive to, e.g., local compression than PIA; (ii) the default value, 1.4 Å, taken for the probe radius in NACCESS is an accepted average value; but, as a selection criterion, a lower (minimal) value might be justified and improve the agreement with the PIA method.
The exposed residue distribution is correlated to hydrophobicity (see section Exposure
effect on the average residue volumes). The Pearson correlation coefficients of
hydrophobi-city (scale given in 61) with ASA, VPIA and LPIA are around -0.9, meaning a strong linear (anti-)correlation between both variables (see sup. data 3 and 4).
We have also looked at correlations between amino acid volumes and accessibilities measured as ASA, VPIA and LPIA (see sup. data 5). First, comparing the tessellations only, the differences are small. The Voronoi volumes are systematically smaller, by 11.4 Å3 on average, than the Laguerre ones, as already seen, while the accessibility differences are negligible (less than 0.6% on average). The differences are more pronounced when one compares values from NACCESS with those of the tessellations: 23.2 Å3 volume excess over Laguerre and 4% accessibility difference with LPIA on average. Moreover, the accessibility versus volume plot highlights two clusters. The first one is composed of small, polar or charged residues; the second of hydrophobic (aromatic and aliphatic) residues. Within the first cluster, the mean ASA are higher than PIA (6.6% higher than LPIA on average). The second cluster has ASA slightly lower than PIA, (0.9% compared with Laguerre values on average).
Protein size. The protein folding depends on its primary sequence; so its length is a crucial
factor on the final fold. For proteins with an experimentally detectable intermediate, it has been shown that the protein length strongly correlates the folding rate 62. The protein size also determines folding rates of multistate folding proteins. However, this parameter does not yield good prediction for two-state folders 63, 64.
Although it was argued that protein compactness decreased with protein size 63, our analysis does not reveal any manifest tendency, either for Laguerre or Voronoi (see sup. data 6). Regarding the dependence of the mean residue volumes on protein size L, the greatest differences are found between the smallest size classes: protein chains with less than 150 residues and protein chains of length in the range [150-250]. For Voronoi tessellations, the average difference is 1.2 Å3, quite small, and entirely due to the Voronoi volume bias. Indeed, the presence of water hydrogen tends to decrease the residue Voronoi volumes near the
surface (see sup. data 6). Now the proportion of exposed residues is higher in small proteins. So, the mean residue Voronoi volumes are smaller in classes of smaller protein size. The trend is opposite in Laguerre volumes; globally, the average residue volume slightly decreases in going from small proteins (<V>=137.1 Å3 for L<150) to larger ones (<V>=136.6 Å3 for L in [150-250]). As we checked, this global volume change is not due to any significant change in the amino acid mean volumes but to a change in the relative populations of amino acids, slightly favoring bigger species in the small protein class. When the protein length of proteins increases, typically above 200 amino acids, the mean residue volumes stabilize (neighbor classes of proteins have similar mean residue volumes). This result corroborates well the principle that proteins longer than 200 amino acids have equivalent volume / surface area ratios 65. In any case, the variations of Voronoi volumes, between the four classes of protein size, are quite small in regards to the standard deviations; therefore not relevant. Laguerre tessellation shows still weaker volume differences, the maximal one of volumes between two adjacent classes of protein size. The greatest differences being 0.45 Å3 are observed, as noticed above between the first class (<150 amino acids) and second class (150-250 amino acids), with an average difference of 0.45 Å3. Cysteine shows the greatest discrepancies, not only between the first and second classes. This result is linked to the proportion of cystine/cysteine, which varies significantly: 32% in the first class (size<150), 16% in the second (150-250), 6.8% in the third (251-400) and 14.8% in the last class (>400). The mean volume of Cystines is indeed smaller than that of Cysteines, explaining the decrease of mean volume when the proportion of Cystines increases.
In summary, no significant relation is observed between the average residue volume and the size of the protein, especially for the Laguerre tessellation. Our previous results indicate that Laguerre tessellations provide more accurate estimations; consequently, the average residue volumes are independent of protein size. Proteins can be assimilated to dense matter and have been compared with packings of hard balls 8. As a function of gyration radius, the volume of globular proteins behaves like that of balls 62.
Secondary structures. A classical way to describe protein structures is through the
secondary structure which is composed of repetitive α-helices and β-sheets, and coil. The first two are maintained mainly by hydrogen bonds (electrostatic interactions).
Table 5 shows the average amino acid volumes computed for each secondary structure state (see Table 5 and sup. data 7). Similar analyses can be found for the buried residues (see sup. data 8). On average, the volume of residues involved in -sheets is higher than that of
residues in -helices. As expected, this difference is more enhanced in the Voronoi tessellations (4.1 Å3) than in the Laguerre tessellation (1.9 Å3). Only one exception can be found for W, which has an average volume smaller in -sheets than helices. Amongst the highest differences of residue volumes between -helix and -sheets, the most important ones are for A (-3.04 Å3), for D (-3.56 Å3) and for E (-3.75 Å3), using the Laguerre method. A similar ranking is observed using Voronoi tessellation but with greater difference values. Alanine is preferentially in the bulk core, unlike charged residues as D and E. For the latter, interestingly, the differences cannot be entirely attributed to the Voronoi bias, as similar results are found with the Laguerre tessellation. In most cases, W is an exception; a residue is more exposed when it belongs to a sheet than when it is in a helix (see sup. data 7). Nonetheless, the solvent is not the exclusive factor. The packing of residues is clearly specific to each secondary structure class (see sup. data 8).
The statistics over completely buried residues (both ASA and LPIA null), in terms of secondary structure, must be interpreted carefully because of the small number of some representatives. For instance, A, G, Isoleucine (I), Leucine (L) and Valine (V) have a large distribution in the protein core, in both -helices and -sheets. Those residues are aliphatic, with hydrophobic hydro-carbonated side chains. Their volumes are higher in -sheets than in -helices, for any tessellation method. Even if the volume differences, between secondary structures, are below standard deviations, they are systematic enough to reflect an intrinsic difference between -helices and -sheets, confirming previous studies 65. Fleming and co-workers observed that the residues in -sheets are less packed than helical residues. Their analysis was carried out using the occluded surface packing (OSP) method which quantifies the packing of residues, exposed or buried. The average OSP for buried helical residues was 0.577 against 0.551 for buried residues in -sheets. With regards to residues in turns, Fleming
et al. report a high packing efficiency, with an average OSP of 0.577. The residues in
non-repetitive structures were shown to be, on average, less packed than -helices but more than -sheets. Our results confirm those observations; average Laguerre volumes in coils are smaller than in -sheets. Finally, the agreement with previous studies underlines reliability and accuracy of volumes computed using Laguerre tessellation.
Application of Laguerre volumes to protein volumes. Experimentally, the protein volume
is deduced from measurements of partial specific volumes, obtained by densitometry, or dilatometry, with the help of thermodynamic and hydrodynamic equations 7.
The partial specific volume is the ratio of volume over mass of the protein : K(Vprot/Mprot); usually, the constant K, proportional to Avogadro's number, is set so that the units of the final partial specific volumes are ml/g. Partial specific volume values can be predicted from tabulated data 3. Then the total volume Vprot is the sum of volumes of its constituents (atoms or residues).In our study, Table 2 provides the effective volume of each residue species. The protein molecular mass, Mprot, is the sum of the non-ionized residue masses taken from 66, plus 18 g/mol for the terminal atoms (NH3+, COO-).
From the literature, ten proteins have been taken of which the volumes are available from both experimental measurements 67, 68 and computation 6 (see Table 6). In ref. 6, the residue volumes were obtained by summing standard volumes of their composing atoms; the standard values follow from a tessellation based analysis restricted to buried residues. Besides the volume table, only the primary sequence is required in this predictive method. The values we get are confronted to experimental data and to those from Tsai et al. 6 (see Table 6). For the 10 proteins, our values better agree with the experiments. The discrepancy between the experimental and our values stay within a range [0.0; 1.2%], 0.55% on average, whereas Tsai’s analogous range is [0.9; 2.9%], 1.7% on average.
This comparative analysis highlights the interest of Laguerre tessellation in the description of protein structure; and also the importance of exposed residues in evaluating specific volumes. In conclusion, the volume table can be used to predict the protein volumes with an excellent accuracy.
DISCUSSION
The residue volumes evaluated by tessellation methods, pioneered by Richards 5, have been regularly improved so as to give a genuine insight into the folded packing of residues 2-6, 9, 14. A more performing description and evaluation of amino acid volumes is crucial to describe and analyze the protein structure and its folding 69.
In the present study, we have analyzed in details the protein residue volumes. The main originality of our work is to take into account all the residues, including those at the protein surface. This contribution is important as surface residues constitute a largely dominant majority. This is made possible by using the Laguerre tessellations with appropriate weights and by embedding the proteins in a realistic solvent. The positions of water molecules have also been properly defined. Another important point is the building of a refined and non-redundant high-quality databank of protein chains.
Coupled with the small size of hydrogen atoms, the Voronoi method shows a systematic bias underestimating atomic and residue volumes near the protein surface. With weights equal to the square of the Van der Waals radii, Laguerre tessellations provide the most reliable volume values. They are more accurate, nearly independent of the surrounding and they have lower standard deviations (a fact already noticed by Pontius et al. 4). Hence, our results have a good degree of confidence, and the average residue volumes deduced from Laguerre tessellations can be taken as effective volumes, i.e., as an intrinsic property of amino acids.
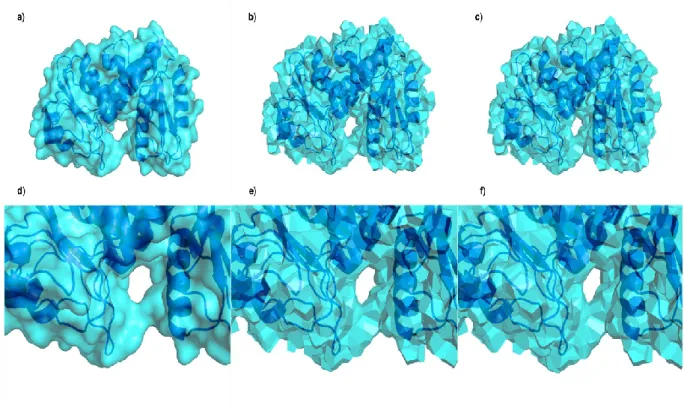
Figure 6 illustrates various views of the protein surface of the folate-dependent dehydrogenase / cyclohydrolase bifunctional enzyme (pdb code: 1a4i 60). The upper three images (Figure 6a to 6c) show the entire protein surface as molecular surface (Connolly surface), Voronoi and Laguerre tessellations, respectively. The lower three figures focus on a remarkable cavity through the same descriptions. These pictures underline the specificity of each approach. The rolling ball algorithm (NACCESS) creates a soft surface while tessellations give a polygonal description. Visible around the cavity volume, local details of the surface are thereby quite different in the rolling ball and tessellation descriptions but the general arrangements are similar, as they should.
Neglecting water hydrogen makes the numerical computations lighter without significant loss of accuracy. The only exceptions to be considered are the two acid residues, D and E. The negatively charged ions (COO-) are more squeezed in contact with water than in the protein core. This physical fact is due to the electric interactions; it is not an artifact of the method. If precision is critical, we recommend either to restore the fully hydrogenated water, or to devise some compensation scheme. For instance, the simplest way is to subtract ~5 Å3 to the volume of D and E at the surface.
In Laguerre tessellations, the water H removal must be compensated by assigning a higher weight to water oxygen than to protein oxygen. The best weight given by optimization is the square of a VdW radius equal to 1.25 Å, slightly less than the standard VdW radius of water molecules (1.4 Å). Qualitatively, this trend agrees with the decrease of water volume
observed by 13 near the protein surface, particularly in contact with charged and polar residues. Note that tuning the water O weight only affects polyhedra and volumes near the protein/water boundary. The rearrangements of the partition near the protein surface affect the number of buried residues (see sup. data 2).
Another surprising result is the discrepancy between ASA and PIA in selecting buried residues. Residues considered as “inaccessible” (with ASA close to 0), may still have contacts with the solvent, as seen with PIA values ranging from 0 to 20%, 4% on average. The stronger criterion, both ASA and PIA equal to 0, reduces by 60% the number of retained residues. Presumably, a better agreement would be obtained if the probe radius used for ASA was taken significantly smaller. Both accessibilities, given by ASA and PIA, are in excellent agreement with the hydrophobicity scale 61. For ASA, it corroborates results obtained by 70 who found a 0.96 correlation between ASA and hydrophobicity, excluding amino acids R, P and W.
The accessibility and residue proportion near the surface give information about the volume/surface area ratio of proteins. In Voronoi tessellations, the average residue volume slightly increases with protein size, but this effect is entirely due the geometrical bias inherent to Voronoi's method. Amazingly, because of this bias, Voronoi volumes reflect the surface / volume ratio of proteins, in a way analogous to Fleming's OSP 65. Fleming et al. showed an increase of OSP with the number of residues in proteins; this change was steeper in small proteins (< 200 residues) and less pronounced in larger ones, a behavior attributed to the subdivision of proteins into domains of the order of 200 residues. The average Voronoi volumes follow a similar behavior, but the variations are too small in regards to standard deviations to draw any discriminating conclusion. The mean Voronoi volume might either stay constant, enforcing the conjecture 65, or converge as L-1/3, the surface / volume ratio of simply scaled compact bodies. On the other hand, Laguerre tessellations do not show any dependence of the average residue volumes on protein size; a good indication of their effective nature.
Our analysis confirms that helices are better packed than β-strands, in agreement with previous studies, e.g., 65. The only noticeable exception is W, occupying the same space whatever the local structure around. This rigidity could be due to the important volume of its two aromatic cycles. In contrast, Y and F, two amino acids having one aromatic cycle follow the general trend, their volumes are higher in β-strands than in -helices (see sup. data 8), even if the differences are smaller than for other residues.
The partial specific volumes calculated from polyhedral tessellations are in excellent agreement with the experimental values from Squire et al. 68 and Gekko et al. 67. Note that, unlike previous works 3, 6, we have not used any compensation in our computation of partial specific volumes. Including surface residues in the statistics, thanks to Laguerre weights, improves the reliability of the obtained average volumes.
CONCLUSION
Protein volumes and packing are useful to the general problem of protein structures and folding. Methodologically, the Laguerre tessellations with finely tuned weights give more precise and more reproducible results than Voronoi's algorithm. The updated values of the volume average and rms deviation of each residue species are tabulated in the core of the article. The strong increase, during the last years, of the number of structures resolved in the PDB improves the statistics. Our computations were based on a refined databank meeting both criteria of precision and non-redundancy. GROMACS was used to put the proteins in a realistic solvent, enabling the statistics to cover the complete set of residues, including those near the surface. Clearly, the Laguerre tessellation provides a simple and efficient description of protein structure. With appropriate weights and including the exposed residues, this method also gives relatively accurate results for protein partial specific volumes.
These results have numerous potential implications. For instance, following our previous work on side-chain position replacement 71, preliminary results show that the sensitivity of Laguerre volumes can be used to determine the quality of side chain positioning. As a test case, we took 18 structures from our databank and replaced their side chains using four different softwares, namely SCWRL version 3 72, SCWRL version 4 73, SCCOMP 74 and SCATD 75. Then our protocol was applied, i.e., solvent addition, relaxation, Laguerre tessellation. As expected, the mean volumes for each residue show that SCWRL 4 gives the best agreement with the real original structures (see sup. data 9), underlining the interest of the approach. Even more, comparison with the effective volumes in Table 2 (Laguerre with wH) yields very similar differences and the same ranking, so that the scoring can be made without any reference to the original structure.
By construction, the Laguerre tessellation provides information not only on the space occupied by the residues, but also on the contacts between residues. A forthcoming study will focus on these contacts, including a critical comparison of Laguerre tessellation and the classical method based on distance threshold 71, 76.
Acknowledgements. A phD grant from the French MESR is acknowledged. We wish to thank Xabier Oyharçabal for his contribution to the early development of VLDP and all the developers for the freely available softwares which greatly eased our work (cited in materials & methods section). We are grateful to referees for a number of suggestions improving the article.
Supporting Information Available. Supplementary data are available concerning the geometry of Delaunay/Laguerre tessellations, volumes according to protein size or secondary structures. Two plots display, respectively, V/LPIA vs hydrophobicity and volumes vs accessibility. Data on the scoring of side chain replacements are also provided there. This material is available free of charge via the Internet at http://pubs.acs.org/.
Legends
Figure 1. Minimization of the cost function for the protein atoms. The weights of atoms (C, N, H, O, S) are determined by the equation w = a . rdw². The optimal value of the parameter a is found by minimizing the function f(a) equal to the weighted sum of the residue volume variances.
Figure 2. Plot of the cost functions f(r) used to fix the optimal water O weight. The weights of protein atoms (C, N, H, O and S) are the same as in Figure 1. All functions reach their minimum at rw= 1.25 Å.
Figure 3. An example of buried residues. A folate-dependent dehydrogenase /cyclohydrolase bifunctional enzyme (PDB code: 1a4i 60) is shown using PyMol software 56. The residues represented as balls are buried in the sense that either ASA (accessibility), VPIA (contact with water) or both are zero. The residues colored in green have both ASA = VPIA = 0 (“strongly” buried) (LEU 40, VAL 80, GLY 95, GLY 150, CYS 151, LEU 154, LEU 184, ILE 233, MET 267, THR 276 and ALA 280). The blue residues have only VPIA = 0 (ALA 167 and VAL 168) , and the yellow ones have only ASA = 0 (GLY 8, SER 12, PRO 35, ALA 38, ILE 52, ALA 59, ILE 84, VAL 113, PRO 148, VAL 213, VAL 221, VAL 232, ASP 244, ALA 250, ALA 270 and MET 273).
Figure 4. Hydrophobicity and accessibility. Plot of hydrophobicity scale (kcal/mol) 61 against the proportion (%) of amino acids near the protein surface. The dotted line, of equation y = -0.04 x + 2.62 (R² = -0.93), results from least squares regression.
Figure 5. ASA vs. PIA. The plots show the accessible surface area (ASA, from NACCESS 40) against Voronoi/Laguerre polyhedral interface area (PIA). The values are area ratios (in percentage). Leastsquares regression to the line y = a x + b gives the values a =1.347, b = -5.269 for VPIA and a =1.323, b = -5.356 for LPIA. The tessellations were built on data including water hydrogen, with optimal weights in the Laguerre case.
Figure 6. An example of accessible residues. A folate-dependent dehydrogenase / cyclo-hydrolase bifunctional enzyme (PDB code 1a4i 60) is shown using PyMol software 56. The images on top are views of the entire protein surface in the Molecular surface (Connolly surface) (a), Voronoi polyhedral surface (b) and Laguerre polyhedral surface (c). The images on the bottom (d, e, f) focus on a cavity in the same order. A slight protein shrinkage can be noticed for the Voronoi description.
Table 1. Residue volume statistics taken from the literature. The methods and authors are indicated in the header. For each amino acid species (AA), column N gives the number of residues used, <V> is the mean residue volume in Å3 and σ the corresponding standard deviations. In the amino acids, Ch stands for free cysteines while Cs represents cysteines involved in disulfide bridges. In the extreme right column, the experimental data are amino acid volumes in solution 7.
Voronoi method Richard method Weighted Voronoi Partial specific volume
Pontius 4 Chothia 15 Harpaz 3
AA N <V> σ N <V> σ N <V> σ <V> A 316 91.5 4.9 71 91.5 6.7 378 90.1 4.2 86.4 Ch 34 114.4 7.6 4 117.7 4.9 30 113.2 3.8 107.9 Cs 33 102.4 6.3 16 105.6 6.0 43 103.5 5.0 D 30 135.2 7.0 17 124.5 7.7 36 117.1 4.0 108.6 E 7 154.6 8.9 13 155.1 11.4 7 140.8 5.3 128.7 F 84 198.8 7.9 29 203.4 10.3 115 193.5 5.9 187.3 G 239 67.5 3.9 60 66.4 4.7 323 63.8 2.9 57.8 H 22 163.2 6.6 8 167.3 7.4 23 159.3 4.9 150.1 I 212 162.6 5.9 69 168.8 9.8 234 164.9 6.2 164.6 K 4 162.5 3.6 5 171.3 6.8 6 170.0 5.1 166.2 L 226 163.4 6.9 57 167.9 10.2 276 164.6 5.9 164.6 M 56 165.9 8.8 14 170.8 8.9 72 167.7 6.7 160.9 N 27 138.3 7.7 112 135.2 10.1 41 127.5 4.2 115.6 P 25 123.4 5.1 16 129.3 7.3 64 123.1 5.9 120.6 Q 12 156.4 6.8 5 161.1 13.0 17 149.4 4.9 142.0 R 9 196.1 8.3 0 0.0 0.0 13 192.8 6.6 197.4 S 109 102.0 6.9 46 99.1 7.4 137 94.2 3.7 86.2 T 66 126.0 6.2 32 112.1 6.2 102 120.0 4.8 113.6 V 308 138.4 5.4 91 141.7 8.4 353 139.1 4.7 136.8 W 27 237.2 8.7 9 237.6 13.6 26 231.7 5.6 225.0 Y 27 209.8 11.1 13 203.6 9.6 41 197.1 6.5 190.5
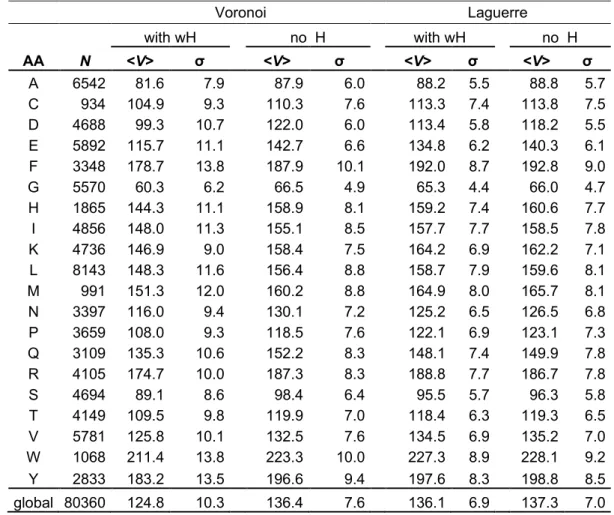
Table 2. Average residues volumes from our study. Two levels of description were used for the surrounding water: with or without H. The statistics take into account all the residues, including those at the protein surface. The Laguerre weights are the square of the Van der Waals radii given in Materials and Methods for proteins and triatomic water. For single site water, the radius is 1.25 Å. The columns are similar to Table 1. The global line contains the total number of residues Sum(N), the overall average residue volume and the rms deviation (square root of weighted average of variances) .
Voronoi Laguerre with wH no H with wH no H AA N <V> σ <V> σ <V> σ <V> σ A 6542 81.6 7.9 87.9 6.0 88.2 5.5 88.8 5.7 C 934 104.9 9.3 110.3 7.6 113.3 7.4 113.8 7.5 D 4688 99.3 10.7 122.0 6.0 113.4 5.8 118.2 5.5 E 5892 115.7 11.1 142.7 6.6 134.8 6.2 140.3 6.1 F 3348 178.7 13.8 187.9 10.1 192.0 8.7 192.8 9.0 G 5570 60.3 6.2 66.5 4.9 65.3 4.4 66.0 4.7 H 1865 144.3 11.1 158.9 8.1 159.2 7.4 160.6 7.7 I 4856 148.0 11.3 155.1 8.5 157.7 7.7 158.5 7.8 K 4736 146.9 9.0 158.4 7.5 164.2 6.9 162.2 7.1 L 8143 148.3 11.6 156.4 8.8 158.7 7.9 159.6 8.1 M 991 151.3 12.0 160.2 8.8 164.9 8.0 165.7 8.1 N 3397 116.0 9.4 130.1 7.2 125.2 6.5 126.5 6.8 P 3659 108.0 9.3 118.5 7.6 122.1 6.9 123.1 7.3 Q 3109 135.3 10.6 152.2 8.3 148.1 7.4 149.9 7.8 R 4105 174.7 10.0 187.3 8.3 188.8 7.7 186.7 7.8 S 4694 89.1 8.6 98.4 6.4 95.5 5.7 96.3 5.8 T 4149 109.5 9.8 119.9 7.0 118.4 6.3 119.3 6.5 V 5781 125.8 10.1 132.5 7.6 134.5 6.9 135.2 7.0 W 1068 211.4 13.8 223.3 10.0 227.3 8.9 228.1 9.2 Y 2833 183.2 13.5 196.6 9.4 197.6 8.3 198.8 8.5 global 80360 124.8 10.3 136.4 7.6 136.1 6.9 137.3 7.0
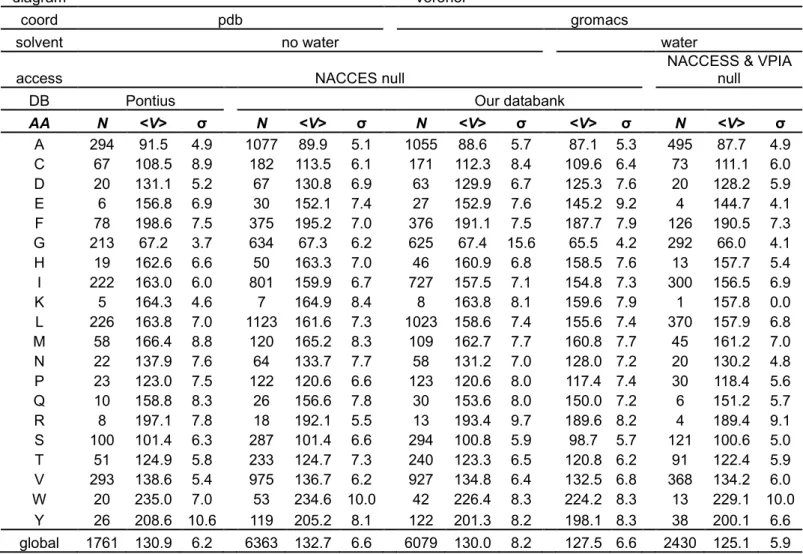
Table 3. Voronoi volumes statistics of buried residues. DB: databank used; solvent: presence or absence of solvent; coord: source of coordinate data; N: number residues; <V>: residue mean volume; σ: standard deviation for each species. The Voronoi tessellation was applied to the databank in water with explicit hydrogen.
diagram Voronoi
coord pdb gromacs
solvent no water water
access NACCES null NACCESS & VPIA null
DB Pontius Our databank
AA N <V> σ N <V> σ N <V> σ <V> σ N <V> σ A 294 91.5 4.9 1077 89.9 5.1 1055 88.6 5.7 87.1 5.3 495 87.7 4.9 C 67 108.5 8.9 182 113.5 6.1 171 112.3 8.4 109.6 6.4 73 111.1 6.0 D 20 131.1 5.2 67 130.8 6.9 63 129.9 6.7 125.3 7.6 20 128.2 5.9 E 6 156.8 6.9 30 152.1 7.4 27 152.9 7.6 145.2 9.2 4 144.7 4.1 F 78 198.6 7.5 375 195.2 7.0 376 191.1 7.5 187.7 7.9 126 190.5 7.3 G 213 67.2 3.7 634 67.3 6.2 625 67.4 15.6 65.5 4.2 292 66.0 4.1 H 19 162.6 6.6 50 163.3 7.0 46 160.9 6.8 158.5 7.6 13 157.7 5.4 I 222 163.0 6.0 801 159.9 6.7 727 157.5 7.1 154.8 7.3 300 156.5 6.9 K 5 164.3 4.6 7 164.9 8.4 8 163.8 8.1 159.6 7.9 1 157.8 0.0 L 226 163.8 7.0 1123 161.6 7.3 1023 158.6 7.4 155.6 7.4 370 157.9 6.8 M 58 166.4 8.8 120 165.2 8.3 109 162.7 7.7 160.8 7.7 45 161.2 7.0 N 22 137.9 7.6 64 133.7 7.7 58 131.2 7.0 128.0 7.2 20 130.2 4.8 P 23 123.0 7.5 122 120.6 6.6 123 120.6 8.0 117.4 7.4 30 118.4 5.6 Q 10 158.8 8.3 26 156.6 7.8 30 153.6 8.0 150.0 7.2 6 151.2 5.7 R 8 197.1 7.8 18 192.1 5.5 13 193.4 9.7 189.6 8.2 4 189.4 9.1 S 100 101.4 6.3 287 101.4 6.6 294 100.8 5.9 98.7 5.7 121 100.6 5.0 T 51 124.9 5.8 233 124.7 7.3 240 123.3 6.5 120.8 6.2 91 122.4 5.9 V 293 138.6 5.4 975 136.7 6.2 927 134.8 6.4 132.5 6.8 368 134.2 6.0 W 20 235.0 7.0 53 234.6 10.0 42 226.4 8.3 224.2 8.3 13 229.1 10.0 Y 26 208.6 10.6 119 205.2 8.1 122 201.3 8.2 198.1 8.3 38 200.1 6.6 global 1761 130.9 6.2 6363 132.7 6.6 6079 130.0 8.2 127.5 6.6 2430 125.1 5.9
Table 4. Average volumes of surface and buried residues. The threshold for sorting surface and buried residues is set at NACCESS = 25 % (above 25 % means surface, below 25 % means buried). The columns Ns and Nb indicate the resulting populations. Tessellations were applied to the databank in water with explicit hydrogen.
Voronoi Laguerre
surface buried surface buried
AA Ns Nb <V> σ <V> σ <V> σ <V> σ A 2562 3975 76.1 6.6 85.1 6.6 87.9 5.7 88.3 5.3 C 167 767 96.6 8.3 106.7 8.5 112.8 7.9 113.4 7.2 D 3487 1197 95.1 7.4 111.6 9.4 112.1 5.1 117.1 6.0 E 4810 1077 112.4 8.1 130.4 10.5 133.8 5.7 139.1 6.8 F 829 2513 165.3 12.0 183.1 11.2 190.6 9.0 192.4 8.6 G 2794 2768 57.3 5.2 63.4 5.5 65.5 4.4 65.2 4.4 H 1039 823 139.0 8.9 151.0 10.0 159.2 7.3 159.2 7.5 I 1077 3774 137.3 9.6 151.0 9.8 157.0 7.9 157.9 7.6 K 4080 655 145.6 8.5 154.7 8.1 164.2 6.9 163.7 6.9 L 2187 5952 138.0 10.0 152.0 9.8 157.9 8.2 159.0 7.8 M 335 655 142.6 10.5 155.8 10.1 165.6 8.3 164.5 7.8 N 2413 982 113.0 7.9 123.3 8.9 125.1 6.3 125.4 6.9 P 2355 1302 104.7 8.1 113.9 8.2 122.3 7.0 121.8 6.7 Q 2308 800 132.3 9.0 143.9 10.2 148.1 7.2 148.3 8.0 R 3083 1021 172.3 9.1 181.8 9.4 189.1 7.6 187.9 7.9 S 2603 2082 85.0 6.9 94.3 7.7 95.1 5.6 95.9 5.7 T 2240 1908 104.4 7.6 115.5 8.5 117.8 6.2 119.1 6.3 V 1506 4267 117.1 8.6 128.9 8.6 134.0 7.1 134.6 6.8 W 288 779 199.1 12.1 216.0 11.5 227.0 9.2 227.4 8.8 Y 1061 1769 173.4 10.4 189.1 11.6 196.8 8.0 198.1 8.5 global 41224 39066 117.5 8.3 132.4 9.1 134.1 6.6 138.3 7.0
Table 5. Average residue volumes per secondary structure classes. In the calculations, water had explicit hydrogen. N, <V>, are the residue number, average volume and standard deviation. Results for the Laguerre tessellations are presented here, whereas the ones for the Voronoi case are in Supplementary Material.
helix sheet coil
AA N <V> σ N <V> σ N <V> σ A 3106 87.2 5.2 923 90.3 5.4 1836 88.4 5.5 C 270 113.9 6.9 229 114.3 7.2 324 112.3 7.6 D 1394 112.8 5.6 455 116.3 6.1 2367 113.3 5.6 E 2756 134.1 6.0 684 137.8 6.1 1781 134.8 6.2 F 1183 192.0 8.6 896 192.8 8.4 933 190.6 8.6 G 939 64.3 4.3 664 65.7 4.1 3424 65.5 4.4 H 567 159.0 7.4 334 159.2 6.7 778 159.0 7.5 I 1761 156.6 7.6 1560 159.4 7.5 1075 156.6 7.4 K 1894 163.3 6.8 674 165.5 6.8 1693 164.5 6.9 L 3751 158.2 7.7 1581 159.9 7.5 1999 158.3 8.1 M 469 163.9 7.8 198 166.7 7.8 299 165.1 8.0 N 930 124.8 6.0 376 126.9 6.8 1776 124.9 6.5 P 710 120.3 6.2 278 123.7 6.9 2293 122.4 6.8 Q 1399 147.5 7.6 414 149.4 7.2 962 148.2 7.2 R 1652 188.0 7.4 706 189.7 7.6 1310 189.0 7.7 S 1454 94.7 5.5 741 97.0 5.4 2046 95.3 5.7 T 1140 118.1 6.5 922 119.5 5.8 1681 117.9 6.3 V 1754 133.5 6.9 2086 135.6 6.5 1386 133.8 7.0 W 410 227.9 9.2 241 226.7 8.3 337 226.5 8.4 Y 1011 197.3 8.0 740 198.5 8.2 825 197.3 8.5 global 28550 139.4 6.8 14702 144.0 6.9 29125 128.9 6.6
Table 6. Comparison of partial specific volumes. The list of investigated proteins follows the experiments 67, 68. The (Calc.) partial specific volumes are calculated with the formula 0.6023 (V/Mw). The protein volume (V) is the sum of residue Laguerre volumes from Table 2 (with water H); the protein mass (Mw) is the sum of molecular masses from Creighton 66. Computation of the last two columns is only based on the sequence.
Partial specific volume
(ml/g)
Protein Source Id Tsai 6 Exp. 67, 68 Calc. V (Å3) Mw (Da)
Alcohol dehydrogenase Equine 1lde 0.721 0.750 0.738 97470 79593
Carbonic anhydrase B Human 2cab 0.711 0.729 0.727 34707 28754
Carboxypeptidase A Bovine 2ctb 0.715 0.733 0.730 41817 34485
Chymotrypsinogen Bovine 2cga 0.721 0.732 0.731 31147 25667
Concanavalin A Jack bean 1scs 0.713 0.732 0.729 30963 25581
Elastase Porcine 1lvy 0.719 0.730 0.729 31376 25908
Hemoglobin Equine 2mhb 0.722 0.750 0.738 76240 62193
Lysozyme Chicken 8lyz 0.699 0.712 0.721 17143 14314
Ribonuclease A Bovine 1xps 0.693 0.703 0.715 16251 13691
References
1. Taylor, W. R., The classification of amino acid conservation. J. Theor. Biol. 1986,
119, 205-218.
2. Gellatly, B. J.; Finney, J. L., Calculation of protein volumes: an alternative to the Voronoi procedure. J. Mol. Biol. 1982, 161, 305-322.
3. Harpaz, Y.; Gerstein, M.; Chothia, C., Volume changes on protein folding. Structure 1994, 2, 641-649.
4. Pontius, J.; Richelle, J.; Wodak, S. J., Deviations from standard atomic volumes as a quality measure for protein crystal structures. J. Mol. Biol. 1996, 264, 121-136.
5. Richards, F. M., The interpretation of protein structures: total volume, group volume distributions and packing density. J. Mol. Biol. 1974, 82, 1-14.
6. Tsai, J.; Taylor, R.; Chothia, C.; Gerstein, M., The packing density in proteins: standard radii and volumes. J. Mol. Biol. 1999, 290, 253-266.
7. Zamyatnin, A. A., Amino acid, peptide, and protein volume in solution. Annu Rev
Biophys. Bioeng. 1984, 13, 145-165.
8. Soyer, A.; Chomilier, J.; Mornon, J. P.; Jullien, R.; Sadoc, J. F., Voronoi tessellation reveals the condensed matter character of folded proteins. Phys. Rev. Lett. 2000, 85, 3532-3535.
9. Goede, A.; Preissner, R.; Frommel, C., Voronoi Cell: new method for allocation of space among atoms: elimination of avoidable errors in calculation of atomic volume and density. J. Comp. Chem. 1997, 18, 1113-1123.