HAL Id: hal-00362155
https://hal.archives-ouvertes.fr/hal-00362155
Submitted on 30 Aug 2013
HAL is a multi-disciplinary open access
archive for the deposit and dissemination of
sci-entific research documents, whether they are
pub-lished or not. The documents may come from
teaching and research institutions in France or
abroad, or from public or private research centers.
L’archive ouverte pluridisciplinaire HAL, est
destinée au dépôt et à la diffusion de documents
scientifiques de niveau recherche, publiés ou non,
émanant des établissements d’enseignement et de
recherche français ou étrangers, des laboratoires
publics ou privés.
Space-time measurement of breaking wave kinematics
and void fraction in the surf zone
Olivier Kimmoun, Hubert Branger
To cite this version:
Olivier Kimmoun, Hubert Branger. Space-time measurement of breaking wave kinematics and void
fraction in the surf zone. ICTAM Symposium 2008, Aug 2008, Adelaide, Australia. �hal-00362155�
XXII ICTAM, 25–29 August 2008, Adelaide, Australia
SPACE-TIME MEASUREMENTS OF BREAKING WAVE KINEMATICS
AND VOID FRACTION IN THE SURF ZONE
Olivier Kimmoun
1 , 2Hubert Branger
11
IRPHE, CNRS, Aix-Marseille Université, Marseille, France
2Ecole Centrale Marseille, France
Summary Particle Image Velocimetry (PIV) measurements were performed in a wave tank under regular water waves propagating
and breaking on a 1/15 sloping beach. To obtain more accurate measurements, the domain from the initiation of the breaking to the swash zone is splited in fourteen overlapping windows. The full field is reconstructed at each time step by gathering the fourteen synchronized PIV fields. We measured then the complete space-time evolution of velocity field over the whole surf zone. From these data the ensemble-period-average and phase-average components of the flow with their associated fluctuating parts were computed. Moreover using the light intensity of the PIV images and velocity measurements, we estimated the void fraction in each point of the surf zone and at each time step.
INTRODUCTION : EXPERIMENTAL SETUP AND METHOD
Experiments were conducted in the Ecole Centrale wave tank in Marseilles. The glass-windowed tank is 17 m long and 0.65 m width. The water depth in front of the wavemaker is about 0.705 m. A polyvinyl 1/15 sloping beach was mounted on the bottom. The beach, which is about 13 m long, is partly made with transparent glass in order to let the laser light sheet cross vertically the beach from the bottom to the free surface. To characterize the wave field, water elevation was measured with a set of six resistive wave gauges. Velocity field in the water was measured with a PIV technique. In the foam generated during the breaking event, seeds were not clearly visible. Then, the PIV intercorrelation algorithm was not really based on particle displacements, but much more on micro-foam structure and bubble displacements, as explained in [1]. In this experiment, the length of the surf zone was about 3 m long. In order to retrieve the full velocity field all along this distance, we made camera PIV measurements in fourteen different locations ranging from the incipient breaking location up to the swash zone. The size of the PIV images was 37x37 cm2. We synchronized PIV image acquisition and wave gauge data using the same time trigs and duration acquisitions for all experiments. This synchronization allowed us to reconstruct, at each time step, a full velocity field covering the entire surf zone. Such experimental measurements and analysis are very time consuming and only one paddle condition for regular waves was conducted. The wave period was
T = 1.275 s and the surf similarity parameter was ζ = 0.28. The breaking process starts with a plunging phase, followed
by successive splash-up, then the wavefront moves into a roller propagating towards the shore. The PIV acquisition rate was 10 Hz, so with the chosen wave period, the duration of 51 successives PIV velocity field corresponds exactly to 4 wave periods. Consequently all the PIV velocity fields separated by 51 PIV time steps were exactly in phase. By averaging the instantaneous fields corresponding to each phase, the phase-average field and its corresponding fluctuating part were obtained. The different terms that appear in the fluctuating kinetic energy propagation equation can be also estimated [2]. We estimated at each time step, the void fraction in each point of the domain by means of light intensity image analysis and vertically-integrated velocity considerations in the domain. We used light scattering theory with a Lambert law to relate void fraction with light intensity.
WAVE KINEMATICS Phase average vorticity
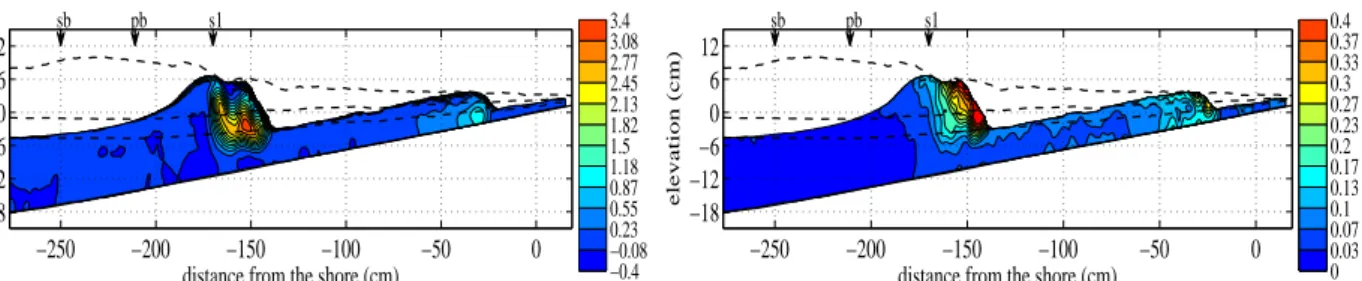
In order to have a statistical evolution of the periodic flow during a wave cycle, we computed a phase-average of velocities and water profiles by averaging all the instantaneous data that were acquired at the same phase. This procedure is com-monly used to study periodic events. The vorticity generated by wave breaking, under the trough-envelope, is of the same order of magnitude as phase speed divided by local depth D. Dimensionless phase-averaged vorticity field Ω/(√gD/D)
is displayed on figure 1-Left during the spash-up event. A large clockwise vortex structure appears first on the front side of the wave crest at the beginning of the plunging phase. This vortex is not localized at the top of the crest, but rather at the toe of the front, just above the mean sea level. The vorticity magnitude increases during the plunging. The first splash-up sequence creates a new vortex ahead of the first one (figure 1-left). Then successive vortices are generated during the following splash-up sequences. The location and intensity of the vortices generated during a wave cycle are presented in figure 2. The first vortex moves on shore with increasing magnitude during the plunging phase, then propagates more slowly downward with a decreasing intensity. The second vortex, initiated by the first splash-up, reaches 30s−1, moves
shoreward and then downward with a decreasing magnitude. The third and fourth vortices moves towards the shoreline along the trough-envelope line. Their magnitude is of order 20s−1 when they propagate near the bore-front, then they
distance from the shore (cm) elevation (cm) sb pb s1 −250 −200 −150 −100 −50 0 −18 −12 −6 0 6 12 −0.4 −0.08 0.23 0.55 0.87 1.18 1.5 1.82 2.13 2.45 2.77 3.08 3.4
distance from the shore (cm)
elevation (cm) sb pb s1 −250 −200 −150 −100 −50 0 −18 −12 −6 0 6 12 0 0.03 0.07 0.1 0.13 0.17 0.2 0.23 0.27 0.3 0.33 0.37 0.4
Figure 1. Splash-up phase : (Left) Non-dimensioned phase-averaged vorticity Ω/pg/D, (Right) Phase-locked Froude normalized
fluctuating kinetic energy (q02/gD)1/2
−250 −200 −150 −100 −50 0 0 10 20 30 max vorticity (1/s)
distance from the shore (cm) −250 −200 −150 −100 −50 0 −10
0 10
sb pb s1
distance from the shore (cm)
elevation (cm)
Figure 2. Intensity (Left) and position (Right) of the four observed vortices generated during a wave cycle (1st: red circle, 2sd: blue
square, 3rd: magenta star, 4th: green triangle).
Fluctuating kinetic energy
An example of the Froude scaled phase-averaged turbulent kinetic energy: q021/2/√gD is presented in figure 1-right.
During the breaking event, we fond that the initiation point for fluctuation generation was located at the top of the front side of the breaking crest. Values of q021/2increase during the plunging event, and the splash-up phase (figure 1-right).
Then, generated fluctuations are spread downstream and towards the bottom. At this phase, we found again three cells of fluctuating intensities. These cells are located on the edge of the vorticity cells. During the rolling phase, after the splash-up, the non-dimensional velocity scale attached to the bore does not seem to decrease until the bore reaches the shoreline. The fluctuating intensity is maintained by the moving breaking process.
distance from the shore (cm)
elevation (cm) sb pb s1 −250 −200 −150 −100 −50 0 −18 −12 −6 0 6 12 0 0.1 0.2 0.5 1 3 5 10 20 30 40 50 60 70 80 90 95 99 99.5 99.8 100 0 0.2 0.4 −6 −4 −2 0 x = −172cm α z (cm) 0 0.2 0.4 −6 −4 −2 0 x = −151cm α z (cm) 0 0.2 0.4 −6 −4 −2 0 x = −141cm α z (cm) 0 0.2 0.4 −6 −4 −2 0 x = −121cm α z (cm) 0 0.2 0.4 −6 −4 −2 0 x = −101cm α z (cm) 0 0.2 0.4 −6 −4 −2 0 x = −70cm α z (cm)
Figure 3. (Left) Phase-averaged void fraction during the splash up, (Right) Measured vertical distribution of mean void fraction α at different locations (solid red line) and comparison with the semi-theoretical law [3] (dashed blue line)
ESTIMATION OF THE SPACE-TIME EVOLUTION OF THE VOID FRACTION
We estimated the void fraction in each point of the domain by means of light intensity image analysis and vertically-integrated velocity considerations in the domain [2]. We used light scattering theory with a Lambert law to relate void fraction with light intensity. An example is presented in figure 3-left. We found an exponential decay of void fraction with depth below the mean sea level, with a very good fit to the Hoque and Aoki (2005) semi-theoretical law [3](figure 3-right). It is the first time that an space-time evolution void fraction over all the laboratory surf zone is measured. The air-entrainment is large during the first splash-up event with values of void fraction near 0.88 above mean sea level inside the splash-up. Then the void fraction decreases slowly when the wave propagates towards the shore, with values near 0.2-0.3 . Close to the shore, aeration is still present in the front face of the wave, but also at the back face of the bore near the crest. We acknowledge the support of INTAS grant 06-1000013-9236 and French National program LEFE/IDAO.
References
[1] Govender K., Mocke G.P. & Alport M.J.: Video-imaged surf zone and roller structures and flow fields. J. Geoph. Res. 107:1–21, 2002. [2] Kimmoun O. & Branger H.: A particle image velocimetry investigation of laboratory surf-zone breaking waves over a sloping beach. J. Fluid
Mech 588:353–397, 2007.