Continuous Plug Flow Crystallization
of Pharmaceutical Compounds
The MIT Faculty has made this article openly available. Please share how this access benefits you. Your story matters.
Citation Alvarez, Alejandro J., and Allan S. Myerson. “Continuous Plug Flow Crystallization of Pharmaceutical Compounds.” Crystal Growth & Design 10.5 (2010): 2219-2228.
As Published http://dx.doi.org/10.1021/cg901496s
Publisher American Chemical Society
Version Author's final manuscript
Citable link http://hdl.handle.net/1721.1/68690
Terms of Use Article is made available in accordance with the publisher's policy and may be subject to US copyright law. Please refer to the publisher's site for terms of use.
For Table of Contents Use Only:
Continuous Plug Flow Crystallization of Pharmaceutical
Compounds
Alejandro J. Alvarez, and Allan S. Myerson*
Continuous crystallization experiments were carried out using a plug flow crystallizer. A strategy of multiple points of addition of antisolvent along the crystallizer was evaluated to control the size of the crystals. It was found that crystal size of model compounds can be increased or decreased with increased number of antisolvent addition points, depending on kinetics of the system.
Continuous Plug Flow Crystallization of Pharmaceutical
Compounds
Alejandro J. Alvarez, and Allan S. Myerson*
Department of Chemical and Biological Engineering, Illinois Institute of Technology, Chicago, Illinois 60616
RECEIVED DATE (to be automatically inserted after your manuscript is accepted if required according to the journal that you are submitting your paper to)
* To whom correspondence should be addressed. Mail: Philip Danforth Armour Professor of Engineering, Department of Chemical and Biological Engineering, Illinois Institute of Technology, 10 W. 33rd St., Chicago, IL 60616. Phone: 312-567-3101. E-mail: [email protected].
ABSTRACT: Crystallization processes in the pharmaceutical industry are usually designed to obtain
crystals with controlled size, shape, purity, and polymorphic form. Knowledge of the process conditions required to fabricate crystals with controlled characteristics is critical during process development. In this work, continuous crystallization of Ketoconazole, Flufenamic Acid, and L-Glutamic Acid in a non-conventional plug flow crystallizer was investigated. Kenics type static mixers were used to promote homogeneous mixing of active pharmaceutical ingredient solution and antisolvent. A strategy of multiple points of addition of antisolvent along the crystallizer was evaluated to control the size of the
number of antisolvent addition points, depending on the kinetics of the system. It was also found that smaller crystals with narrower size distribution can be obtained with the static mixers. A model to describe the continuous crystallization process was developed through the simultaneous solution of a Population Balance Equation, kinetics expressions for crystal growth and nucleation, and a mass balance. The comparison of experimental and calculated values for crystal size distribution revealed that a growth rate dispersion model could describe accurately the continuous crystallization process. Collision of crystals with each other and with mixing elements inside the crystallizer may be the source of random fluctuation of the growth rate in the non-conventional plug flow crystallizer with static mixers.
1. Introduction
Crystallization is an important separation and purification process employed to produce a broad diversity of materials in the bulk, fine chemicals, food and pharmaceutical industries.1 Crystallization can influence the performance of downstream process operations such as filtration, drying and milling. Physical-chemical properties of the final product also depend on crystal characteristics. In the pharmaceutical industry, over 90% of the active pharmaceutical ingredients (API) are crystals of small organic molecules.
A standard crystallization procedure is the antisolvent crystallization, which involves the mixing of two miscible fluids: the solution of API and a component that reduces the solubility of API in the mixed solvent. As a result, API crystallizes out of the solution. The balance between the nucleation and crystal growth processes controls the crystal size and size distribution.2
In industrial processes the crystal size and size distribution have to be controlled within specific limits. In antisolvent crystallization, factors controlling these parameters include supersaturation, residence time, as well as addition and mixing of antisolvent.3 Increasing the steady state supersaturation in Mixed Suspension Mixed Product Removal (MSMPR) type crystallizers, or inlet supersaturation in a Plug Flow (PF) type crystallizers will normally move the crystal size distribution
supersaturation in a plug flow reactor with a T mixer.4 The weight mean size of benzoic acid decreased from 9.3 μm to 3.5 μm with increasing initial supersaturation ratio from 3.5 to 5.5. Rivera and Randolph
found that the mass weighted mean size of pentaerythritol is a linear function of the initial supersaturation when crystallized in plug flow reactor.5 The mean size of pentaerythritol decreased from 63.5 μm to 12.2 μm when the solution/ antisolvent ratio decreased from 3 to 0.25. The coefficient of variation also increased as initial supersaturation increased. Gradl et al. also reported that mean crystal size decreases with increasing supersaturation in reactive precipitation of barium sulphate in a plug flow system with a T-mixer.6 Results of Blandin et al. on precipitation of salicylic acid with a T-mixer also showed a decrease in crystal size with increased supersaturation.7 Crystal size distribution changes with residence time of the solution/antisolvent mixture. Raphael and Rohani studied crystallization of sunflower protein in a tubular precipitator. Experiments at various residence times were conducted adjusting the reactor length. They observed that crystals increased size with increases in the mean residence time.8 Experimental results with barium sulphate obtained by Baldyga and Orciuch, as well as Schwarzer and Peukert also shown the effect of residence time on crystal size distribution.9,10 Finally, control of the addition of antisolvent has been successfully employed to obtain pharmaceutical products with uniform properties.11,12,13 Lindenberg et al.,14 as well as Nagy et al.,15 have recently applied model based techniques to optimize combined cooling/antisolvent crystallization processes, resulting in superior control of the crystal size distribution.
Mixing plays an important role in crystallization.16 In antisolvent crystallization under conditions of high supersaturation, a lack of rapid mixing in the crystallizer can drastically affect the properties of the product including crystal size distribution, morphology and purity.17,18,19 If the solution is not completely mixed before the crystallization starts, the crystallization proceeds under conditions of partial segregation, which would result is wide crystal size distributions. Mahajan and Kirwan crystallized the pharmaceutical Lovastatin from methanolic solution using water as antisolvent in a rapid mixing device.20 A broader crystal size distribution with a larger mean crystal size was obtained from the experiments with characteristic micromixing times greater than the induction time. Both mean
crystal size and variance of size distribution increased with increasing the micromixing time, whereas in the experiments with characteristic micromixing times less than the induction time, there was no effect of mixing on the crystal size distribution.
A variety of systems have been proposed to ensure good mixing in antisolvent crystallization processes operated at high supersaturation to produce small crystals and narrow crystal size distributions. These systems utilize devices designed to generate rapid mixing of solution and antisolvent, and eliminate local regions of uncontrolled supersaturation. Some of these devices are: confined impinging jets, tee-mixers, and static mixers. Confined Impinging Jet consists of two equal diameter fluid jet nozzles that collide within a small chamber, and are discharged though an outlet tube.21 Use of confined impinging jets has been reported by Gillian to crystallize benzoic acid and voriconazole,22 by Hacherl to precipitate Calcium Oxalate,23 and by Mahajan and Kirwan to precipitate asparagine and lovostatin.20 Unfortunately, it is difficult to align and maintain the alignment of the impinging fluid jet steams, the scale-up of these devices is complicated,24 and various parts of the impinging jet apparatus tend to clog easily, making difficult the implementation of this technology for large scale production.
Static mixers are devices that promote mixing of fluids in a pipeline without moving parts.25,26 A common type of static mixer is the twisted-ribbon mixer known as Kenics type (Kenics KMS). This device consists of a series of alternating right and left-hand helical elements of 180° rotation, each juxtaposed at 90° As the flow profile contacts the leading edge of each helical element, it is caused to split into two and forced to follow the geometric path created by the element shape to the element preceding it. At the following element the two flows are split into two again, thus creating a geometric progression of flow division. The clockwise and counter-clockwise rotation of the elements causes the material to move from the wall to the center and from the center to the wall. After traveling through a number of these elements, the fluid is homogenized. The scale-up of mixing processes in a pipeline with static mixers is less complicated than other process configurations because of its relatively simple hydrodynamics.27 Although static mixers have been successfully used in the plastic, polymer and oil
industry for a significant length of time, literature about their application to the manufacture of pharmaceutical compounds is limited. Raphael studied the precipitation of sunflower protein in a tubular precipitator with static mixers.8 Rivera used a static mixer for precipitation of Pentaerythritol Tetranitrate (PETN).5 These applications limited the use of the static mixers only at the entrance of the reactor. The use of multistage addition of antisolvent (multiple injection points) to control crystal size of the crystals using static mixers has not previously been reported nor has their use along the entire reactor length. Hobbs and Muzzio reported that static mixers approaches plug flow, when the number of mixing elements is increased.28,29 Ideally, in a plug flow reactor there is no axial mixing, and the residence time distribution function is therefore a step function. Since a narrow residence time distribution is necessary to obtain a narrow crystal size distribution, operation in a plug flow regime is desired to reduce the variance in size distribution.
Crystallization processes can run in batch or continuous mode. Although batch is the most common method encountered in the pharmaceutical industry, continuous processing affords the advantage of enhanced reproducibility of results because all material crystallizes under uniform conditions, whereas in batch operations conditions change with time resulting in crystal characteristics difficult to control and inconsistent from batch to batch.30
The purpose of this research work is to study a non-conventional type of continuous crystallization process operating at high supersaturation to promote the formation of small crystals. It involves the use of static mixers to reach a rapid homogeneity of solution and antisolvent, as well as to promote the operation in a plug flow regime, which lead to narrow crystal size distributions. A strategy of multiple addition points of antisolvent is evaluated to control the mean size of the crystals. The production of crystals of small size in the crystallization stage of the manufacturing process of pharmaceutical compounds is important to improve properties such as dissolution rate, bioavailability, and tableting of the drugs, and to avoid additional downstream operations such as milling to reduce the crystal size. Although the use of tubular precipitators is well reported in the literature,8,31,32,33,34,35 this work focused in a particular design with multiple injection points of antisolvent to control the crystal size.
2. Experimental Section
2.1. Materials. Ketoconazole is an oral antifungal agent used for the treatment of mucocutaneous
infections. It is soluble in dilute acid and shows a broad spectrum of antifungal activity. Flufenamic Acid is a potent nonsteroidal drug with analgesic, anti-inflammatory and antipyretic properties. It is marketed to treat rheumatoid arthritis and osteoarthritis.36 This drug is a weak acid soluble in organic solvents as methanol, ethanol, chloroform, and acetone, and it has a very low solubility in water. It has been reported that Flufenamic Acid has up to seven different crystal forms, although forms III and I are the most commonly encountered.37 L-Glutamic Acid, is a small amino acid that plays an important role in the human biology.38 The substance features two polymorphs, the metastable alpha polymorph and the stable beta form; the crystal structures are both orthorhombic,39 with the crystal lattice parameters being a = 0.706, b = 1.03, c = 0.875 nm, and a = 0.517, b = 1.734, c = 0.695 nm, respectively.
Ketoconazole Lot 00500867 was obtained from Johnson & Johnson. L-Glutamic Acid and Flufenamic Acid were purchased from Sigma Aldrich Chemicals. Methanol (99%) was purchased from Fisher Scientific. Ethanol (200 proof) was supplied from Pharmco Products. Acetone (99.5%) was acquired from Sigma Aldrich Chemicals. Deionized water was obtained from a Barnstead Nanopure Infinity water purification system.
2.2. Experimental Apparatus. A continuous plug flow system was fabricated and used in the
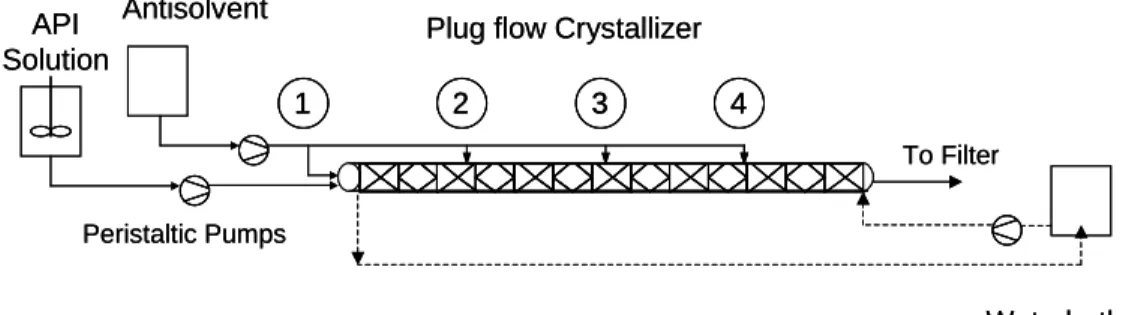
antisolvent crystallization experiments. The modular design of this system allows it to be easily adapted to various process configurations. Figure 1 shows a schematic diagram of the experimental set-up. The system consists of four glass reactor modules. Each module consists of a core glass pipe with a volume of 76 cm3 (600mm long, 12.7 mm internal diameter), and a jacket glass pipe (600 mm long, 35 mm diameter). Experiments can be conducted with one, two, three or four injection points of antisolvent addition. In experiments with one injection point, 100% of the antisolvent is injected at point 1 indicated in Figure 1. In experiments with two injection points, 50% of the antisolvent is injected at
point 1 and 50% at point 2. In the case of three injection points, one third of the antisolvent is injected at points 1, 2, and 3. Finally, in experiments with four injection points, 25% is injected at point 1, 25% at point 2, 25% at point 3 and 25% at point 4. Crystallization occurs inside the core pipe, and a heat exchanging fluid is circulated in the jacket to regulate to reactor temperature. The glass crystallizer allows an easy monitoring of the process at all times, to visually identify the different process stages occurring along the reactor, as well as to identify abnormal patterns in the flow.
Figure 1. Schematic Process Flow Diagram of the Continuous Crystallization
System with Multistage Antisolvent Addition
Each glass reactor module can be operated at controlled temperature using a NESLAB RTE Refrigerated Bath/Circulator. Solution of the active pharmaceutical ingredient (API) and antisolvent are injected in the first module of the glass reactor with a “Y” inlet to conduct both flows directly inside the static mixer using 1/8” tygon tubing. Flow of solution and antisolvent are controlled with peristaltic pumps (Masterflex L/S series, variable speed from Cole Parmer, with maximum feed rate of 1700 ml/min). Solution of API and antisolvent are contained in volumetric flasks 1000 ml.
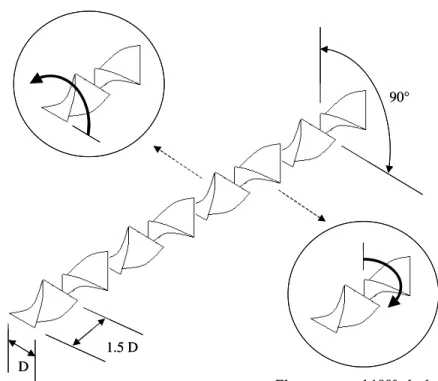
Static mixers were added to the reactor to enhance mixing of solution and antisolvent, and to keep the particles in suspension along the reactor. Static mixers are Kenics type (12 elements plastic from Cole Parmer). The geometry of the static mixer consists of a series of mixing elements of fixed length, which
Peristaltic Pumps
Plug flow Crystallizer API Solution Antisolvent Waterbath Temperature control To Filter 1 2 3 4 Peristaltic Pumps
Plug flow Crystallizer API Solution Antisolvent Waterbath Temperature control To Filter 1 1 22 33 44
is equal to 1.5 times the tube diameter. Each element consists of a short helix, which can be rotated clockwise or counterclockwise as shown in Figure 2. A mixing element with helix rotated clockwise is placed at an angle of 90° with respect to the next mixing element with helix rotated counterclockwise.
Figure 2. Details of the Kenics type Static Mixer
Solute concentration measurements were carried out to monitor the progress of the crystallization process. Concentration of Ketoconazole and Flufenamic Acid were measured with UV spectroscopy, whereas concentration of L-Glutamic Acid was measured with liquid chromatrography.
An UV Spectrophotometer (model GENESYS 20 from Thermo Spectronic) with a wavelength range 325 to 1100 nm, and a UV cell Fisher Scientific 14-385-918A 3ml capacity, were utilized for measuring the concentration of Flufenamic Acid at 339 nm, and Ketoconazole at 325 nm. An HPLC instrument (Agilent Technologies 1200 Series) with a column Zorbax Eclipse xDB-C18 (1.6 x 150 mm, 5 μm) was utilized for measuring the concentration of L-Glutamic Acid at 210 nm, using Agilent 1200 Series UV
D
1.5 D
90° Element rotated 180° counterclockwise
Element rotated 180° clockwise D
1.5 D
90° Element rotated 180° counterclockwise
detector. Measuring conditions were: 100 μl sampling vial, 36 bar column pressure, velocity: 0.5 ml/min, injection volume: 10 μl, and temperature: 25 °C.
The crystal size distribution of the solid product was characterized with Laser Diffraction for the Ketoconazole experiments, and with Focused Beam Reflectance Measurement (FBRM) for the Flufenamic Acid and L-Glutamic Acid experiments. The Laser Light Diffraction instrument was a Microtrac Standard Range Analyzer model SRA 150 from Leeds & Northrup, with measurement range from 0.7 to 704 μm. The FBRM device was a Lasentec S400 probe from Mettler Toledo, with a measurement range from 785 nm to 1000 μm. The FBRM probe uses a focused beam of laser light to measure a chord length, which is defined as the distance across a particle as observed by optics collecting backscattered light from a laser crossing the particle. The light scans in a circular path and as this light scans across a particle passing in front of the probe window, light is scattered in all directions. The light scattered back towards the probe is used to measure the chord length (the product of the reflection time and the beam velocity) of the given particle. The number of such chords measured in a specific time period yields a chord length distribution. In this work, the chord length distribution provided from the FBRM probe is used as a characteristic crystal size distribution of the particle.
Raman Spectroscopy was employed to identify the polymorphic form of the crystals obtained in the plug flow experiments. A Raman Rxn1 System from Kaiser Optical System, Inc with a range from 200 to 3200 cm-1 was utilized for characterizing the crystals. Crystal morphology was observed in an Optical Microscope model Nikon Eclipse ME 600 from Nikon Co with a Differential Interference Contrast (DIC) polarizer and magnification range from 5X to 150X.
2.3. Procedure. All experiments were conducted at 25 °C. A solution of Ketoconazole in methanol
(83 mg/ml), and water (antisolvent) were added to the glass reactor at constant flow rate using peristaltic pumps. The effect of the total flow rate on crystal size distribution of Ketoconazole was studied by running experiments at 76, 87, 101, and 122 ml/min. The ratio solution / antisolvent was 70:30 vol/vol in all experiments with Ketoconazole.
Additionally, the effect of the number of injection points of antisolvent on crystal sze distribution was evaluated with Flufenamic Acid and L-Glutamic Acid. In the first case, a solution of Flufenamic Acid in ethanol (12.4 mg/ml) with a flow rate of 100 ml/min was mixed with water (antisolvent). Experiments were conducted with 1, 2, 3, and 4 points of addition of antisolvent, corresponding to one flow of 200 ml/min, two flows of 100 ml/min, three flows of 66.67 ml/min, and four flows of 50 ml/min respectively. In the second case, a solution of L-Glutamic Acid in water (8.7 mg/ml) with a flow rate of 30 ml/min was mixed with acetone (antisolvent). Experiments were also conducted with 1, 2, 3, and 4 injection points of antisolvent corresponding to one flow of 150 ml/min, two flows of 75 ml/min, three flows of 50 ml/min, and four flows of 37.5 ml/min respectively.
The continuous crystallization process needs a period of time to reach a steady state. Frequently a period of 4 to 10 residence times is required to achieve the steady state after startup or following a serious perturbation in operating conditions.30 The total duration of the experiments with the continuous plug flow system corresponded to 7 residence times.
A sample (approximately 5 ml) of the flowing slurry was drawn at the end of the reactor, and filtered with a 0.22 μm syringe filter (Millipore Millex Sterile Syringe Filters) to determine solute concentration. Samples of the slurry were also taken and filtered with a 0.45 μm membrane (Whatman Membrane Filter) on a Buchner funnel under vacuum and the solid phase was dried overnight at 65 °C. Crystal size distribution of the solid product was characterized, and Raman spectra were collected to determine the polymorphic form.
3. Population Balance Model
The population balance approach provides a flexible framework for crystallization modeling.40 The population balance equation for a plug flow crystallizer at steady state is expressed as:
0 = ∂ ∂ + ∂ ∂ L n G x n ux (1)
where n (the population density) is a function of crystal size (L) and position (x) along the crystallizer, ux is the mean flow velocity, and G is the crystal growth rate. This equation assumes no radial or axial dispersion, growth rate independent of crystal size, and no significant agglomeration or breakage. The boundary condition for this partial differential equation is n(0,x)=B0(x)/G(x), where B0 is the nucleation rate, and the initial condition is n(L,0)=0, that is, no seeding or solids at the entrance.
For a plug flow crystallizer the rate of depletion of solute from the solution at any location along the crystallizer must equal the rate at which the mass is gained by the solid. The general form of the mass balance is:
∫
− = k G L n dL dx dC ux 3ρs v 2 (2)where C is the concentration of solute at location x, ρs is the density of solid, and kv is the volume shape factor.
Growth rate of crystals due to deposition from the solution on the crystal surface increases with an increase in supersaturation, and is given by:
(
)
gs g C C
k
G= − (3)
where C is the solute concentration, Cs is the solubility, kg is the growth rate constant, and g is the growth rate order. As the degree of supersaturation (C-Cs) decreases along the crystallizer, so does the crystal growth rate.
The formation of new particles is modeled with a nucleation rate, which also increases with an increase in supersaturation, and may be expressed as:
(
)
bs b C C
k
B0 = − (4)
where kb is the nucleation rate constant and b is the nucleation rate order. Near the entrance the nucleation rate is high and decreases as the supersaturation decreases along the crystallizer.
Equations 1 to 4 were discretized into crystallizer length steps (Δx), and crystal size steps (ΔL). Computation of the solution begins with the population balance. The calculated population density is
Equation was solved with the Lax-Wendroff scheme, a numerical method for the solution of hyperbolic partial differential equations based on finite differences.41
In order to simulate the multistage process, the system was conceptually set as a series of plug flow units, in which the exit of the previous stage becomes the inlet of the next stage. At the initial point of each stage, the values of initial solute concentration and solubility were updated to reflect the dilution factor due to the addition of fresh antisolvent.
The kinetic parameters of the model were estimated by solving an optimization problem,42,43,44 which consists of finding the values of θ that minimize the objective function Φ(θ) defined as the sum of
squares of the error, where the error is defined as the difference between the measurements and the model predictions, and θ is the vector of model parameters, θ = [ kg, g, kb, b ]. The optimization problem is expressed as:
( )
=∑
[
(
−)
]
Φ max 0 2 exp ( ) min L L y y θ θ (5) subject to equations 1 to 4where yexp is the measurement (in this case, the crystal size distribution) and y is the model prediction for CSD.
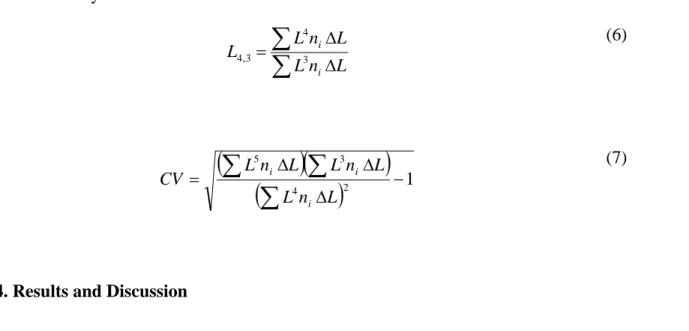
An approximation of the confidence intervals for the model parameters can be obtained by assuming that the model can be represented by linear functions in the vicinity of the estimate, as suggested by Rawlings et al. Details of the procedure can be found elsewhere.45,46 Thus, the population balance equation, as well as the mass balance and expressions for kinetics of crystallization are solved with initial values for the parameters θ, and the obtained crystal size distribution for each stage is compared to the experimental data. The value of the parameters θ is then recalculated and the procedure is repeated until a minimum value for the sum of squares of the error is found. Once the optimal values for kinetics parameters are found, the mass based mean size of the crystals can be estimated for the final product from the third and fourth moments of the size distribution (equation 6). Coefficient of variation
can also be estimated from the 0th, 1st, and 2nd moments, as shown in equation 7, to characterize the spread of the crystal size distribution around the mean size.
∑
∑
Δ Δ = L n L L n L L i i 3 4 3 , 4 (6)(
)(
)
(
)
2 1 4 3 5 − Δ Δ Δ =∑
∑
∑
L n L L n L L n L CV i i i (7)4. Results and Discussion
4.1. Solubility. The solubility of Ketoconazole in methanol/water, Flufenamic Acid in ethanol/water, and L-Glutamic Acid in water/acetone mixtures was experimentally determined using a gravimetric method. Results were fit to equation 8, where Cs is solubility in mg/ml, % antisolvent is the amount of antisolvent in vol%, and A,B are fit parameters given in Table 1. The goodness of fit of the experimental data with the exponential function given in equation 8 was acceptable, as the correlation coefficient (r) was 0.99, 0.98, and 0.99 for Ketoconazole, L-Glutamic Acid, and Flufenamic Acid respectively.
(
)
{
B antisolvent}
A
Cs = exp % (8)
Table 1. Experimental parameters for Solubility (mg/ml) as a function of %Antisolvent (vol%)
Parameter Ketoconazole in methanol/water Flufenamic Acid in ethanolwater L-Glutamic Acid in water/acetone A (mg/ml) 9.9 336.0 8.7 B (vol%-1) -0.073 -0.108 -0.048
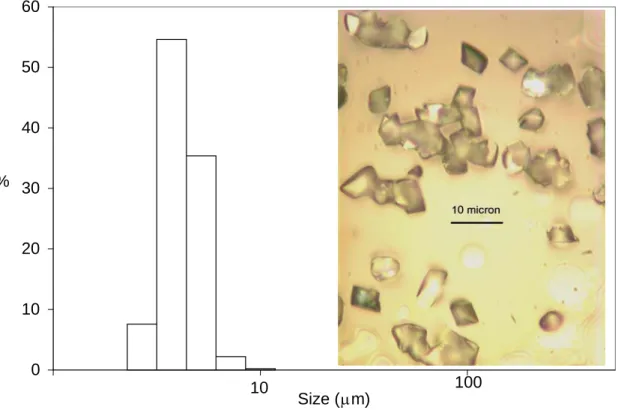
4.2. Ketoconazole. Crystal size distribution of Ketoconazole was measured at different flow rates using laser diffraction. High supersaturation values promoted the formation of small crystals, in the range from 3.2 to 5.3 μm, as nucleation becomes the dominant process at these conditions.47
Figure 3 shows that crystals obtained at a total flow rate of 87 ml/min have a narrow size distribution. This can be explained by good mixing in a molecular level (micromixing) as well as by the constant residence time distribution expected in a plug flow regime. The insets display an optical microscope picture of the crystals at the end of the experiment.
Figure 3. Experimental Crystal Size Distribution for Ketoconazole
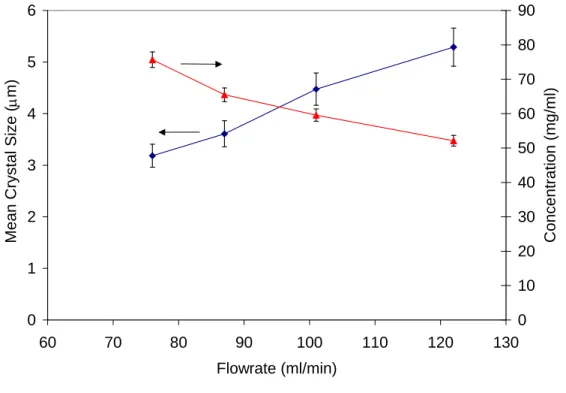
The effect of flow rate on the mean crystal size is presented in Figure 4 for crystallization of Ketoconazole with one point of addition of antisolvent. Figure 4 shows that a decrease in crystal size was observed as total flow rate decreased. This is in fact opposite to our immediate expectation in crystallization. We usually expect an increase in crystal size with decreased flow rate, as the residence time in the crystallizer is larger at low flow rates than at high flow rates, and therefore crystals have
0 10 20 30 40 50 60 Size (μ m) % 10 100
more time to grow at low flow rate. However, in the present experiments intensity of mixing is important. Intensity of mixing is known to affect the mass transfer process in which solute leaves the solution and becomes part of the crystal. High intensity of mixing enhances the mass transfer process, increasing the amount of solute incorporated into the solid phase, and consequently increasing the crystal size and depleting the solute concentration in the liquid phase. In the opposite, low intensity of mixing diminishes the transfer of solute into the solid phase, decreasing the size of the crystals and resulting in a higher concentration of solute in the liquid phase, as compared to high intensity of mixing. In the continuous plug flow crystallization process, a decrease in flow rate reduced the intensity of mixing, reducing the amount of Ketoconazole that came out of the solution, and therefore decreasing the size of the crystals and increasing the steady state solute concentration, as shown in Figure 4.
Figure 4. Experimental Mean Crystal Size for Ketoconazole as a function of total flow rate
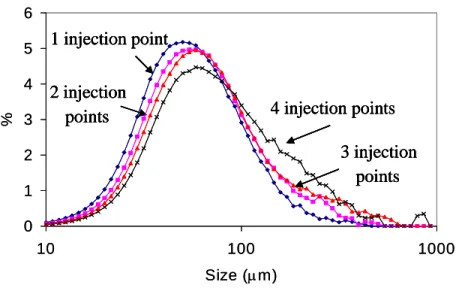
4.3. Flufenamic Acid. The effect of number of injection points of antisolvent on the crystal size distribution of Flufenamic Acid is presented in Figure 5. The mean crystal size was 67, 80, 94, and 106 μm for 1, 2, 3, and 4 points of antisolvent addition respectively. In the case of one injection point, a high number of small crystals are formed due to the high initial supersaturation. For two injection points, the
0 1 2 3 4 5 6 60 70 80 90 100 110 120 130 Flowrate (ml/min)
Mean Crystal Size (
μm) 0 10 20 30 40 50 60 70 80 90 Concentration (mg/ml)
initial supersaturation is lower than the previous case, resulting in the formation of a less number of crystals, which consume supersaturation through crystal growth and the resultant crystal size is bigger than the previous case. For three and four injection points, a similar mechanism occurs, as the initial supersaturation is even lower and the crystals are able to grow to a bigger size.
Figure 5. Crystal Size for Flufenamic Acid as a function of the Number of Points of Addition of Antisolvent
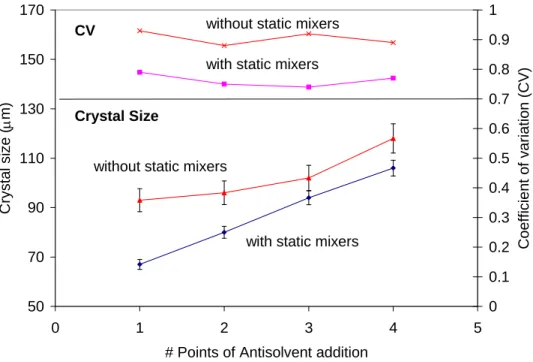
Experiments with and without static mixers were conducted to evaluate the mixing effects in crystallization of Flufenamic Acid. Figure 6 shows that smaller crystals with narrower size distribution were obtained when static mixers were used. As reported by Meyer, characteristic mixing time in an empty pipe is one order of magnitude bigger than the mixing time for a pipe with static mixers.48 As a consequence, in the experiment without static mixers the nucleation and growth of Flufenamic Acid had already started before micromixing in the empty crystallizer was complete, and the crystal size distribution resulted much wider as evidenced by the higher values of coefficient of variation. This observation is consistent with the results reported by Mahajan for crystallization of Lovastatin in two impinging jet precipitators,20 as well as Raphael for crystallization of sunflower proteins in a tubular reactor, where operation at poorly mixed conditions resulted in large crystals with wider CSD.8
1 injection point 1 injection point
2 injection points 2 injection
points 4 injection points
3 injection points 4 injection points 3 injection points 0 1 2 3 4 5 6 10 100 1000 Size (μm) % 1 injection point 1 injection point 2 injection points 2 injection
points 4 injection points
3 injection points 4 injection points 3 injection points 0 1 2 3 4 5 6 10 100 1000 Size (μm) %
50 70 90 110 130 150 170 0 1 2 3 4 5
# Points of Antisolvent addition
Crysta l si ze (μm) 0 0.1 0.2 0.3 0.4 0.5 0.6 0.7 0.8 0.9 1 Co ef fic ie n t of va ria ti on ( C V)
without static mixers
without static mixers
with static mixers
with static mixers Crystal Size
CV
Figure 6. Effect of the use of Static Mixers in the Crystal Size Distribution of Flufenamic Acid
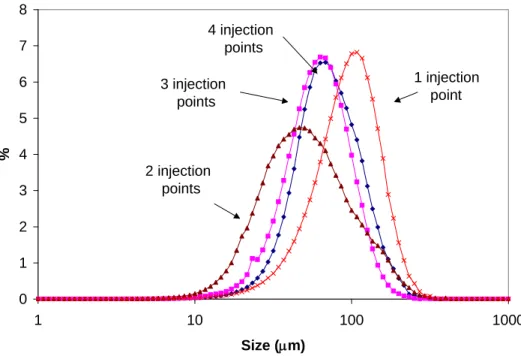
4.4 L-Glutamic Acid. The effect of number of injection points of antisolvent on the volume based crystal size distribution of L-Glutamic Acid is presented in Figure 7. Opposite to the effect found in Flufenamic Acid, it was observed an initial decrease in crystal size as a result of increasing the number of antisolvent injection points from one to two. Additional increases in the number of injection points resulted in an increase in crystal size. Mean crystal size was 105 μm, 67 μm, 70 μm and 81 μm for 1, 2, 3, and 4 point of antisolvent addition respectively.
Figure 7. Crystal Size (Volume Based) for L-Glutamic Acid as a function of the Number of Points of Addition of Antisolvent
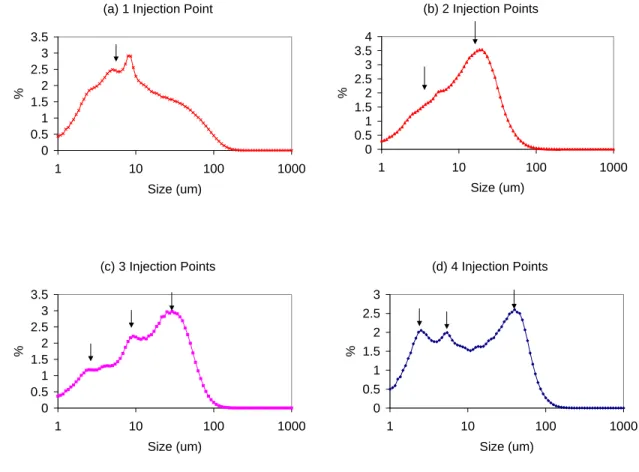
In order to understand this behavior, it is useful to look at the number based crystal size distribution showed in Figure 8 (a) (b), (c), and (d). It can be observed in Figure 8 (a) that injection of antisolvent in only one point results in a broad size distribution. Although the maximum point in the size distribution is clearly located in a smaller size than the cases of 2, 3 and 4 injection points, the broad size distribution shifts the mean size to a high value. The broad distribution may be explained by the high supersaturation, which in this case may be creating an uncontrolled number of particles.
Figure 8 (b) shows that injection of antisolvent in two points resulted in narrower size distribution, as the initial supersaturation level is lower than the case of 1 injection point.
In the case of injection of antisolvent in three points, Figure 8 (c) shows an interesting behavior. Three different populations (three peaks) can be clearly identified. The population located at the smaller crystal size can be associated with the crystals nucleated in the third injection point, where as the population located at the intermediate crystal size can be associated with the crystals nucleated in the
0 1 2 3 4 5 6 7 8 1 10 100 1000 Size (μm) % 1 injection point 2 injection points 3 injection points 4 injection points
Finally the bigger peak located at the greater crystal size can be associated with the crystals nucleated before the first injection point, which had more residence time and consequently show a bigger crystal size.
Figure 8. Crystal Size (Number Based) for L-Glutamic Acid as a function of the Number of Points of Addition of Antisolvent
Figure 8 (d) shows that injection of antisolvent in four points has a similar behavior than the case of 3 injection points, except that the number of small particles increased as it includes the particles nucleated in the 3rd and 4th injection points.
As shown in Figure 7, the mean crystal size of L-Glutamic Acid was 105 μm with one injection point of antisolvent, and decrease to 67 μm with two injection points (i.e. the mean size was 105 μm when
100% and 0% of the antisolvent was added in the first and second stage respectively, and decrease to 67 μm when 50% of the antisolvent was added in the first stage, and 50% in the second stage). Additional experiments were carried out, in which 15%, 25%, and 35% of the antisolvent was added in the second
(a) 1 Injection Point
0 0.5 1 1.5 2 2.5 3 3.5 1 10 100 1000 Size (um) % (c) 3 Injection Points 0 0.5 1 1.5 2 2.5 3 3.5 1 10 100 1000 Size (um) % (d) 4 Injection Points 0 0.5 1 1.5 2 2.5 3 1 10 100 1000 Size (um) % (b) 2 Injection Points 0 0.5 1 1.5 2 2.5 3 3.5 4 1 10 100 1000 Size (um) %
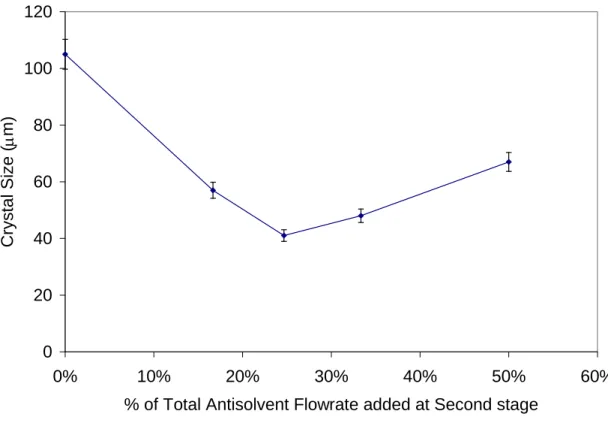
stage (and consequently, 85%, 75%, and 65% of the antisolvent was added in the first stage). Figure 9 shows that increasing the relative amount of antisolvent added at the second stage had the effect of initially decrease and then increase the crystal size of L-Glutamic Acid. The minimum crystal size was 41 μm when 25% of the antisolvent was added in the second stage. These results suggest that there is a
breakpoint at which the system changes from being a nucleation dominated process to a crystal growth dominated process. As the amount of antisolvent added at the second stage increases from 0% to 25%, the relative importance of nucleation rate over crystal growth rate increases, and thus crystal size decreases (i.e. nucleation dominated process). In contrast, an increase from 25% to 50% in the amount of antisolvent added in the second stage increases the relative importance of crystal growth rate over nucleation rate, producing an increase in crystal size (i.e. crystal growth dominated process).
Figure 9. Mean Crystal Size (Volume Based) for L-Glutamic Acid as a function of the % of Total Antisolvent flow rate added at second stage
0 20 40 60 80 100 120 0% 10% 20% 30% 40% 50% 60%
% of Total Antisolvent Flowrate added at Second stage
Crystal Size (
An experiment was carried out to evaluate the effect of flow rate in the continuous crystallization of L-Glutamic Acid. Results are shown in Figure 10. As expected, the mean size decreased as a result of a decrease in the residence time, but interestingly the observed trend on crystal size for various points of antisolvent addition was repeated at higher flow rate (i.e. the crystal size was high for one injection point, then decreased when 2 injection points were used, and increase monotonically as the number of injection points increased). This result suggests that the observed trend depends on the initial ratio of solution to antisolvent, which was maintained constant in both experiments.
0 20 40 60 80 100 120 0 1 2 3 4 5 # Injection Points Crysta l si ze (μm)
Total Flowrate 180 ml/min
Total Flowrate 360 ml/min
Figure 10. Mean Crystal Size (Volume Based) for L-Glutamic Acid as a function of Total Flow rate
Raman spectroscopy revealed that the polymorphic form obtained in Ketoconazol experiments was identical to that of the raw material. Also, the stable form (Form III) of Flufenamic Acid, as well as the stable β form of L-Glutamic Acid were obtained in all the continuous crystallization experiments.
4.5. Results of Mathematical Modeling. Estimated nucleation and crystal growth kinetic parameters and their confidence intervals for the continuous crystallization of Flufenamic Acid and L-Glutamic Acid with one, two, three and four points of antisolvent addition are presented in Table 2. The
parameters were estimated for all experiments separately using the steady state crystal size distribution at the end of the plug flow crystallizer. To obtain an efficient optimization and accelerate convergence, the parameters kg, and kb were scaled nonlinearly, using ln(kg), and ln(kb) respectively.
Table 2. Estimated Nucleation and Crystal Growth Kinetic Parameters and 95% Confidence Intervals for Flufenamic Acid and L-Glutamic Acid at different number of Antisolvent Addition Points
Compound # additio n points kg (x 10-7 m/s) G kb (x 108 #/m3 s) b Flufenamic Acid 1 8.2 +/-0.64 1.1 +/-0.12 1.5 +/-0.12 2.0 +/-0.13 2 9.8 +/-0.40 1.0 +/-0.02 1.4 +/-0.11 2.0 +/-0.09 3 9.8 +/-1.01 1.1 +/-0.08 1.3 +/-0.15 2.1 +/- 0.14 4 9.9 +/-0.58 1.1 +/-0.08 1.3 +/-0.08 2.1 +/-0.09 Glutamic acid 1 14.0 +/-0.07 1.1 +/-0.09 18.9 +/-0.11 2.0 +/-0.02 2 8.2 +/-0.71 1.1 +/-0.25 1.7 +/-0.16 2.0 +/-0.25 3 9.4 +/-0.65 1.1 +/-0.17 1.7 +/-0.14 1.8 +/-0.17 4 9.6 +/-0.24 1.0 +/-0.03 1.9 +/-0.05 1.8 +/-0.03
Kitamura measured the growth rate of L-Glutamic Acid on single crystals at 25 °C in a flowing solution at low relative supersaturation and fitted the results to a power law model.49 He reported the growth rate parameters kg= 1.11 x 10⁻⁷ m/s and g = 1 for α crystals for a relative supersaturation
supersaturation between 0.18 and 0.65. Table 1 shows estimated growth rate parameters between 8.15 x 10⁻⁷ m/s and 14 x 10 –7 m/s, which could be explained by the higher initial relative supersaturation at which the plug flow crystallization experiments were conducted (between 2.18 and 8.58).
Figure 11. Comparison of Calculated and Experimental Crystal Size Distribution for Flufenamic Acid using Plug Flow Model
Figure 11 shows a comparison of the predicted and experimental crystal size distribution for Flufenamic Acid with one point of antisolvent addition. It can be observed that the predicted mean size is in reasonable agreement with experimental value, but plug flow model predicts a CSD that is narrower than the experimentally determined. This difference in the broadness of the size distribution suggests that the assumption of no-mixing in the axial direction might be not valid. A new model was proposed to obtain a sufficiently accurate fit for the experimental crystal size distribution data. The new model, known as the dispersion model, incorporates a term for dispersion in the axial direction of the crystallizer. Dimensionless expression for the new model is
0 2 4 6 8 10 12 14 16 0.000001 0.00001 0.0001 0.001 Size (m) % calculated experimental
ξ ∂ ∂ = ∂ ∂ − ∂ ∂ y G G z y z y Pe 2 o 2 1 (9)
where the dimensionless variables y, z, ξ , and Pe are defined as
0 0 n n y = (10a) τ ξ 0 G L = (10c) x x z= (10b) D x u Pe= x (10d)
where n is the population density, n is the initial nuclei density, L is the crystal size, G00 o is the initial growth rate, τ is the residence time, x is the length along the crystallizer, x is the effective reactor
length, ux is the mean flow velocity, and D is the axial diffusivity coefficient.
The dimensionless population balance equation for the crystallizer (equation 9) assumes no radial dispersion and has initial condition: y
( )
0,z =[
B0(x)/B0(0]
/[
G(x)/G(0)]
, and boundary conditions:( )
ξ,0 −(1/Pe)∂y(ξ,0)/∂ξ =0y , and ∂y
( )
ξ,1 /∂z=0. The equation was discretized and numerically solved using Euler method. Information about Peclet number as a function of flow rate was experimentally determined and plugged into the dispersion model to estimate crystal size distribution. It can be deducted from equation 9 that a high value of Peclet number decreases the relative importance of the diffusion term, leading the system to behave as an ideal plug flow with constant residence time (no residence time distribution). On the other hand, a low value of Peclet number increases the effect of axial dispersion, increasing the spread on residence time distribution, which would be reflected as an increase in the coefficient of variation (CV) of the crystal size distribution.In order to determine the extent of dispersion the plug flow crystallizer, residence time distribution (RTD) experiments were performed using a non reactive tracer method. A step response experiment was conducted in the plug flow crystallizer, and the extent of dispersion was determined in terms of the axial Peclet number (Pe), as described by Smith.50. It was observed that increasing the flow rate from 100 ml/min to 400 ml/min, the value of Peclet number increased from 230 to 360. This is an expected result,
as the Peclet number is a measure of convection to diffusion transport rate, thus an increase in the velocity of the fluid increases the convection transport rate, leading to higher values of Pe. The high values of Peclet number obtained experimentally confirm that the behavior of the tubular crystallizer with Kenics type static mixers will be close to ideal plug flow at the operating flow rates. Similar results have been reported by Hobbs and Muzzio,51 and Brechtelsbauer.52
Using the values of Peclet number calculated from the step response experiments, the crystal size distribution of Flufenamic Acid was obtained by solving equation 9. In Figure 12, the experimental CSD for the antisolvent crystallization of Flufenamic Acid with one point of antisolvent addition is shown together with the calculated results. It can be observed that the calculated distribution is still narrower than the experimental data. This result suggests that the RTD is not the only factor that determines the size spread of the CSD from the plug flow crystallizer. A possible explanation is that the assumption of all crystals growing at the same growth rate is not valid. Growth rate dispersion is a recognized factor that may leads to increase the broadness of CSD in continuous systems, as observed by Zumstein and Rousseau.53
Figure 12. Comparison of Calculated and Experimental Crystal Size Distribution for Flufenamic Acid using Axial Dispersion Model (Pe=325)
0% 2% 4% 6% 8% 10% 12% 14% 16% 1 10 100 1000 Size (μm) % experimental calculated
Growth rate dispersion implies that crystals of the same size and shape grow at different rates in the same environment.54,55,56,57 Two different mechanisms that lead to growth rate dispersion have been proposed and have experimental support.53 The random fluctuations mechanism assumes that all crystals have the same time-averaged growth rate but that individual crystals growth rates fluctuate during growth periods. Alternatively, the constant crystal growth mechanism assumes that crystals are born with an inherent constant growth rate, but the rate from crystal to crystal varies.58 In a plug flow crystallizer with static mixers along the length of the reactor, collision of crystals with each other and with mixing elements result in changes in the dislocation network of crystals and may lead to a random fluctuation of the growth rates. Randolph and White59 proposed a model to incorporate the random fluctuation mechanism into description of crystal populations. The model characterizes random growth fluctuations with a Peclet number parameter that is representative of the magnitude of the growth rate fluctuations. For a plug flow crystallizer the model is
ξ ξ ∂ ∂ = ∂ ∂ − ∂ ∂ y z y y PeG 2 2 1 (11)
where y, z, and ξ are dimensionless variables for population density, reactor length, and crystal size, as defined previously. PeG is the Peclet number for size dispersion due to growth rate fluctuation, defined as G G D L G Pe = (12)
where G is the mean growth rate, DG is the growth diffusivity, and L is the mean crystal size.
The model for a plug flow crystallizer with growth rate dispersion, as described in Equation 11, was solved numerically using Euler method. The parameter PeG was estimated by fitting simulated size distributions to experimental data, using nonlinear optimization.
(a) One Injection Point (b) Two Injection Points
(c) Three Injection Points (d) Four Injection Points
Figure 13. Comparison of Calculated and Experimental Crystal Size Distribution for Flufenamic Acid using Growth Rate Dispersion Model (PeG=5)
In Figure 13, a comparison of calculated and experimental crystal size distribution for Flufenamic Acid using the Growth Rate Dispersion Model is presented. It can be observed that calculated CSD is in reasonable agreement with the experimental data. This suggest that the size spreading of the crystal size distribution observed in the continuous plug flow crystallizer operation might be adequately described with the proposed model. The value of Peclet number for size dispersion was PeG = 5. Randolph and White have reported growth rate dispersion characterized with typical growth Peclet numbers of the order of 5-10 for sugar crystals.59 As discussed previously, collision of crystals with each other and with mixing elements may be the source of random fluctuation of the growth rates in the non-conventional plug flow crystallizer with static mixers.
0 5 10 15 0.1 1 10 100 1000 Size (μm) % calculated experimental 0 5 10 15 0.1 1 10 100 1000 Size (μm) % calculated experimental 0 5 10 15 0.1 1 10 100 1000 Size (μm) % calculated experimental 0% 5% 10% 15% 0.1 1 10 100 1000 Size (μm) % calculated experimental
6. Conclusions
The non-conventional plug flow crystallizer is able to produce crystals of small size and narrow size distribution, as evidenced with antisolvent crystallization of Ketoconazole. Also, the addition of antisolvent at multiple points along the crystallizer is a good strategy to control the mean size of the crystals, as demonstrated with Flufenamic Acid, and L-Glutamic Acid. In the case of Flufenamic Acid, the process is dominated by crystal growth and the mean crystal size increases as the number of points of addition of antisolvent is increased. For L-Glutamic Acid, crystal size initially decreases and then increases as the number of point of addition of antisolvent increased, suggesting a process initially dominated by nucleation.
The comparison of experimental and calculated values for crystal size distribution revealed that neither a plug flow model nor an axial dispersion model could describe accurately the continuous crystallization process, as both models yielded a crystal size distribution narrower than the experimental data. A growth rate dispersion model showed a reasonable agreement to describe the size spreading of the crystal size distribution. Collision of crystals with each other and with mixing elements inside the crystallizer may be the source of random fluctuation of the growth rate in the non-conventional plug flow crystallizer with static mixers. The adequate combination of experimental data and a mathematical model help to analyze and understand the combined effect of crystal growth and nucleation in the continuous crystallizer. These results have an important relevance for the pharmaceutical industry, as there is an increased interest in development of continuous crystallization processes.
Acknowledgment
The support of Johnson and Johnson Pharmaceutical Research and Development for a portion of this work is gratefully acknowledged.
References
(1) Myerson, A. S. Handbook of Industrial Crystallization. 2nd ed.; Butterworth-Heinemann: Boston,
2002.
(2) Jones, A. G. Crystallization Process Systems. Butterworth-Heinemann: Oxford, 2002.
(3) Rohani, S.; Horne, S; Murthy, K. Org. Process Res. Dev. 2005, 9, 858-872.
(4) Stahl, M.; Aslund, B. L.; Rasmuson, A. C. AIChE J. 2001, 47, 1544-1560.
(5) Rivera, T.; Randolph, A. D. Ind. Eng. Chem. Process Des. Dev. 1978, 17, 182-188.
(6) Gradl, J.; Schwarzer, H. C.; Schwertfirm, F.; Manhart, M.; Peukert., W. Chem. Eng. Process.
2006, 45, 908-916.
(7) Blandin, A. F.; Mangin, D.; Nallet, V.; Klein, J. P.; Bossoutrot., J. M. Chem. Eng. J. 2001, 81,
91-100.
(8) Raphael, M.; Rohani, S.; Sosulski, F. Can. J. Chem. Eng. 1995, 73, 470-483.
(9) Baldyga, J.; Orciuch, W. Chem. Eng. Sci. 2001, 56, 2435-2444.
(10) Schwarzer, H. C.; Peukert, W. AIChE J. 2004, 50, 3234-3247.
(11) Fujiwara, M; Nagy, Z. K.; Chew, J. W.; Braatz, R. D. J. Process Control. 2005, 15, 493-504.
(12) Henczka, M.; Baldyga, J.; Shekunov, B. Y. Chem. Eng. Sci. 2005, 60, 2193-2201.
(13) Zhou, G. X.; Fujiwara, M.; Woo, X. Y.; Rusli, E.; Tung, H. H.; Starbuck, C.; Davidson, O.; Ge, Z.; Braatz, R. D. Cryst. Growth Des. 2006, 6, 892-898.
(15) Nagy, Z. K.; Fujiware, M.; Braatz, R. D. J. Process Control 2008, 18, 856-864
(16) Tavare, N. S. AIChE J. 1986, 32, 705-732.
(17) Baldyga, J.; Makowski, L. Ind. Eng. Chem. Res. 2005, 44, 5342-5352.
(18) Zauner, R.; Jones, A. G. Chem. Eng. Sci. 2002, 57, 821-831.
(19) Paul, E. L.; Tung, H. H.; Midler, M. Powder Technol. 2005, 150, 133-143.
(20) Mahajan, A. J.; Kirwan, D. J. J. Phys. D: Appl .Phys. 1993, 26, B176-B180.
(21) Johnson, B. K.; Prud’homme, R.K. AIChE J. 2003, 49, 2264-2282.
(22) Gillian, J. M., Reactive Precipitation of Pharmaceuticals: Mixing, Reaction, and Nucleation Kinetics, Ph.D. Thesis, University of Virginia, 2008.
(23) Hacherl, J. M.; Paul, E. L.; Buettner, H. M. AIChE J. 2003, 49, 2352-2362.
(24) Liu, Y.; Fox, R. O. AIChE J. 2006, 52, 731-744.
(25) Bourne, J. R.; Lenzner, J.; Petrozzi, S. Ind. Eng. Chem. Res. 1992, 31, 1216-1222.
(26) Baldyga, J.; Bourne, J. R.; Hearn, S. J. Chem. Eng. Sci. 1997, 52, 457-466.
(27) Taylor, R. A.; Penney, W. R.; Vo, H. X. Ind. Eng. Chem. Res. 2005, 44, 6095-6102.
(28) Hobbs, D. M.; Muzzio, F. J. Chem. Eng. J. 1997, 67, 153-166.
(29) Hobbs, D. M.; Muzzio, F. J. Chem. Eng. Sci. 1998, 53, 3199-3213.
(30) Randolph, A. D.; Larson, M. A. Theory of Particulate Processes. 2nd ed.; Academic Press: San
Diego, 1988.
(31) Virkar, P. D.; Hoare, M.; Chan, M. Y. Y.; Dunnill, P. Biotechnol. Bioeng. 1982, 24, 871-887.
(33) Mendez del Rio, J. R.; Rousseau, R. W. Cryst. Growth Des. 2006, 6, 1407-1414.
(34) Kawase, M.; Suzuki, T.; Miura, K. Chem. Eng. Sci. 2007, 62, 4875-4879.
(35) Van Wageningen, W. F. C.; Mudde, R. F.; van den Akker, H. E. A. Chem. Eng. Sci. 2004, 50,
5193-5200.
(36) Kovala-Demertzi, D. J. Organometallic Chem. 2006, 691, 1767-1774.
(37) Hu, Y; Liang, J. K.; Myerson, A.S. Ind. Eng. Chem. Res. 2005, 44, 1233-1240.
(38) Orella, C. J.; Kirwan, D. J. Biotechnol. Progr. 1989, 5, 89–91.
(39) Roelands, C. P. M.; ter Horst, J. H.; Kramer, H. J. M.; Jansens, P. J. AIChE J. 2007, 53, 354-362.
(40) Ramkrishna, D.; Mahoney, A. W. Chem. Eng. Sci. 2002, 57, 595-606.
(41) Benett, M. K.; Rohani, S. Chem. Eng. Sci. 2001, 56, 6623-6633.
(42) Togkalidou, T.; Tung, H. H.; Sun, Y.; Andrews, A. T.; Braatz, R. B. Ind. Eng. Chem. Res. 2004,
43, 6168-6188.
(43) Hu, Q; Rohani, S.; Wang, D. X.; Jutan, A. AIChE J. 2004, 50, 1786-1794.
(44) Scholl, J.; Lindenberg, C.; Vicum, L.; Mazzotti, M. Cryst. Growth Des. 2007, 7, 1653-1661.
(45) Rawlings, J. B.; Miller, S. M.; Witkowski, W. R. Ind. Eng. Chem. Res. 1993, 32, 1275-1296.
(46) Matthews, H. B.; Miller, S. M.; Rawlings, J. B. Powder Technol. 1996, 88, 227-235.
(47) Rasenack, N.; Muller, B. W. Pharm. Res. 2002, 19, 1894-1900.
(48) Meyer, T.; David, R.; Renken, A.; Villermaux, J. Chem. Eng. Sci. 1988, 43, 1955-1960.
(49) Kitamura, M.; Ishizu, T. J. Cryst. Growth. 1998, 192, 225-235.
(51) Hobbs, D. M.; Swanson, P. D.; Muzzio, F. J. Chem. Eng. Sci. 1998, 3, 1565-1584.
(52) Brechtelsbauer, C.; Ricard, F. Org. Process Res. Dev. 2001, 5, 646-651.
(53) Zumstein, R. C.; Rousseau, R. W. AIChE J. 1987, 33, 121-129.
(54) Bohlin, M.; Rasmuson, A. C. AIChE J. 1992, 38, 1853-1863.
(55) Larson, M. A.; White, E. T.; Ramanarayanan, K. A.; Berglund, K. E. AIChE J. 1985, 31, 90-94.
(56) Patience D. B.; Dell’Orco, P. C.; Rawlings, J. B. Org. Process Res. Dev. 2004, 8, 609–615.
(57) Haseltine, E. L.; Patience, D. B.; Rawlings, J. B. Chem. Eng. Sci. 2005, 60, 2627-2641.
(58) Klug, D. L.; Pigford, R. L. Ind. Eng. Chem. Res. 1989, 28, 1718-1725.