Publisher’s version / Version de l'éditeur:
Proceedings 17th International Symposium on Ice, 2, pp. 68-76
READ THESE TERMS AND CONDITIONS CAREFULLY BEFORE USING THIS WEBSITE. https://nrc-publications.canada.ca/eng/copyright
Vous avez des questions? Nous pouvons vous aider. Pour communiquer directement avec un auteur, consultez la
première page de la revue dans laquelle son article a été publié afin de trouver ses coordonnées. Si vous n’arrivez pas à les repérer, communiquez avec nous à [email protected].
Questions? Contact the NRC Publications Archive team at
[email protected]. If you wish to email the authors directly, please see the first page of the publication for their contact information.
NRC Publications Archive
Archives des publications du CNRC
This publication could be one of several versions: author’s original, accepted manuscript or the publisher’s version. / La version de cette publication peut être l’une des suivantes : la version prépublication de l’auteur, la version acceptée du manuscrit ou la version de l’éditeur.
Access and use of this website and the material on it are subject to the Terms and Conditions set forth at
Probabilistic Analysis of Seasonal Ice Loads on the Molikpaq
Timco, Garry; Frederking, Robert
https://publications-cnrc.canada.ca/fra/droits
L’accès à ce site Web et l’utilisation de son contenu sont assujettis aux conditions présentées dans le site LISEZ CES CONDITIONS ATTENTIVEMENT AVANT D’UTILISER CE SITE WEB.
NRC Publications Record / Notice d'Archives des publications de CNRC:
https://nrc-publications.canada.ca/eng/view/object/?id=d48aee53-4a93-4e8f-a7c0-d8bd5bec0351 https://publications-cnrc.canada.ca/fra/voir/objet/?id=d48aee53-4a93-4e8f-a7c0-d8bd5bec0351
17th International Symposium on Ice Saint Petersburg, Russia, 21-25 June 2004
International Association of Hydraulic Engineering and Research Proceedings IAHR’04, Vol.2, pp68-76, 2004.
PROBABILISTIC ANALYSIS OF SEASONAL ICE LOADS
ON THE MOLIKPAQ
G.W. Timco1 and R. Frederking1
ABSTRACT
A probabilistic analysis is made to predict the seasonal evolution of first-year ice loads on the Molikpaq offshore structure throughout a winter in the Canadian Beaufort Sea. The analysis is based solely on the failure modes of the ice, the ice thickness, and the number of weekly ice loading events. The paper illustrates the use of the probabilistic approach using these basic input values. The results of the analysis show good agreement with the measured ice loads on the Molikpaq in the Beaufort Sea.
INTRODUCTION
An offshore structure placed in ice-covered waters experiences loading due to the ice. Observations from structures in the Beaufort Sea and Sea of Okhotsk have clearly shown that the ice can fail in a variety of modes during its interaction with the offshore structure. Recently, Timco and Johnston (2004) have shown that the global loads on offshore caisson structures reflect the failure mode of the ice. The analysis showed quantitatively that for level first-year ice, the ice loads dramatically increased as the failure mode changed from flexure, to mixed-mode, to crushing. The question is: “Is it possible to use this information to predict the global loads on an offshore structure throughout a winter season?”. This paper explores this question.
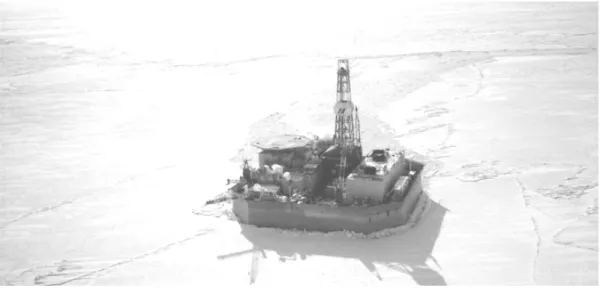
A previous study by Wright and Timco (1994) has characterized the failure mode behaviour at the Molikpaq caisson (Figure 1) during its deployment at the Amauligak I-65 site. With this information and information on the ice thickness throughout the winter, a simple probabilistic model will be developed to predict weekly ice loads. Probabilistic analysis has traditionally been focused on defining the maximum annual load at some level, say at the 10-4 exceedance level, for design. While the maximum annual load is needed for design, information on the likely maximum weekly load has operational applications. The present paper introduces a new factor, failure mode, to probabilistic analysis of ice loads and as well presents the seasonal evolution of ice loads.
Figure 1: Photograph showing the Molikpaq in the Canadian Beaufort Sea.
BACKGROUND INFORMATION
Defining Equations
Timco and Johnston (2004) provided information on over 170 ice load events on three caisson structures (Molikpaq, SSDC, Tarsiut caissons) that were used for exploratory drilling in the Canadian Beaufort Sea. The paper provides complete details of the ice loading events. Timco and Johnston showed that the ice loads could be directly related to the failure mode of the ice. They proposed the following equation for predicting global ice loads:
h w T
Lgl = fm (1)
where the Lgl is the global load (in MN) on the structure, w is the width (in m) of the
structure and h is the ice thickness (in m). Tfm is a failure-mode parameter with the
following values:
Tfm = 1.09 MN/m2 for ice crushing
= 0.83 MN/m2 for long-term creep (i.e. thermally-induced creep) = 0.63 MN/m2 for mixed-mode failure
= 0.18 MN/m2 for flexure failures.
This equation and these values for Tfm represent data on a wide caisson structure
subjected to ice loading. This equation can be used in this analysis if information is known of the failure mode pattern at an offshore site. This information is known for one site in the Beaufort Sea. Also, the ice thickness at the site throughout the winter is required.
Failure Modes on the Molikpaq
The Molikpaq structure (Figure 1) was developed by Gulf Canada Resources Ltd. and operated by Beaudril, a subsidiary of Gulf. It is a Mobile Arctic Caisson (MAC) which was deployed in the Canadian Beaufort Sea in 1984 and used for exploration drilling for four winter seasons in the Canadian Arctic. It consists of a continuous steel annulus on which sits a self-contained deck structure. The core of the annulus was filled with sand, which provided over 80 percent of the horizontal resistance. The outer face of the Molikpaq was designed for extreme ice features. The structure was extensively instrumented to monitor both ice loads and structural response.
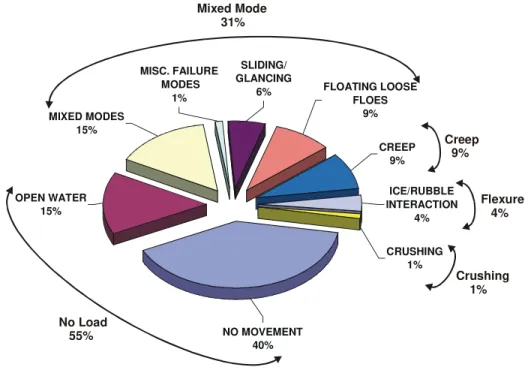
Wright and Timco (1994) provided information on the observed failure mode of first-year sea ice as it interacted with the Molikpaq at the Amauligak I-65 site in the winter of 1985/86. The ice at this site was very dynamic since it was in the shear zone region in the Canadian Beaufort Sea. Figure 2 shows a pie chart of the ice behaviour and associated failure modes (modified from Wright and Timco, 1994). This figure is based on a review of over 6000 hours of video recordings.
The observed ice behaviour has been categorized according to the failure modes presented in Equation (1):
• 55% of the time the structure experienced no load (open water or no ice movement)
• 31% of the time the ice failed in a mixed mode (mixed mode, miscellaneous, sliding/glancing, isolated floes)
• 9% of the time the ice failed in creep
• 4% of the time the ice failed in flexure (ice/rubble interaction) • 1% of the time the ice failed in crushing.
These values will be used in the present analysis. It is very important to understand that this failure mode pattern is not representative for all offshore structure sites. Figure 2 is, in fact, unique to the Molikpaq at the Amauligak I-65 site for the winter of 1985/86. This must be considered if the proposed probabilistic approach is used at other offshore regions and sites.
Ice Thickness
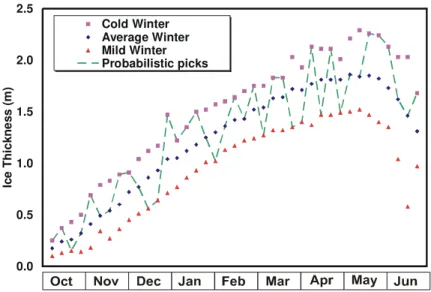
Knowledge of the ice thickness is required for Equation (1). The thickness of the ice interacting with the structure can vary considerably throughout the year with typically thinner ice in the autumn and thicker ice later in the winter season. Recorded observations and ice maps from the Molikpaq showed a wide variability in the ice thickness. For the present analysis, a simplified approach is adopted. Information on landfast sea ice thickness for the Beaufort Sea is shown in Figure 3 for a cold winter, an average winter and a mild winter. The plot shows the ice growing throughout the winter and a gradual decrease in thickness in the late spring and early summer season. Given the dynamic nature of ice in the Beaufort, a random pick of thickness within a range is reasonable since it is possible for older (thicker) or newer (thinner) ice to move past the structure. In actual fact, ice thickness in the drifting pack ice is likely to be even more
year ice floes. Note that in this analysis, only first-year level ice is considered in determining the loads on the structure.
MIXED MODES 15% OPEN WATER 15% NO MOVEMENT 40% CRUSHING 1% ICE/RUBBLE INTERACTION 4% CREEP 9% FLOATING LOOSE FLOES 9% MISC. FAILURE MODES 1% SLIDING/ GLANCING 6% No Load 55% Mixed Mode 31% Creep 9% Flexure 4% Crushing 1%
Figure 2: Pie chart illustration of the ice failure modes observed on the Molikpaq at the Amauligak I-65 site (modified from Wright and Timco, 1994). The failure patterns have been mapped to those identified in Equation (1).
Exposure
The amount of ice interacting with the structure will determine the number of ice loading events that will take place. This is a key part of any probabilistic model. Since this type of information is not available in the open literature, a simplified approach is used in this analysis. Wright et al. (1986) have provided information on the global ice loads on the Molikpaq at the Tarsiut P-45 site during the winter of 1984/85 (see Figure 4). This site is in less severe ice conditions than the Amauligak I-65 site. To gain an initial estimate of the number of weekly events, the figure by Wright et al. was digitized to extract the ice loading events from first-year ice. Using this simple approach indicated that on average, there were 18 loading events per week, with a standard deviation of 12 events. Thus, for this analysis, a random number of events between 0 and 30 were chosen for each week. In reality, the actual number of weekly events is quite variable and is related to ice concentration and the amount of ice drift past the structure. The amount and direction of drift in turn is dependent on major weather patterns that provide the driving force for ice movements. In future development of the model, a link between weather patterns, drift and number of events will be incorporated.
0.0 0.5 1.0 1.5 2.0 2.5 0 5 10 15 20 25 30 35 40 Ic e Thi c k ne s s (m ) Cold Winter Average Winter Mild Winter Probabilistic picks
Figure 3: Ice thickness throughout a winter in the Beaufort Sea showing a cold, average and mild winter.
0 50 100 150 0 5 10 15 20 25 30 35 G lob a l Lo a d (M N ) Molikpaq at Tarsiut P-45
Figure 4: Global first-year ice loads on the Molikpaq at the Tarsiut P-45 site during the winter of 1984/85 (after Wright et al. 1986).
PROBABILISTIC APPROACH
A very simple probabilistic approach was developed to predict the ice loads on the Molikpaq throughout the winter. It was assumed that the failure mode pattern for the ice behaved throughout the year as shown in Figure 2. This implies that the failure mode pattern is independent of the ice thickness and ice speed. Since there is little quantitative information in the literature on thickness and speed effects on failure modes, this simple
ice is considered. A more comprehensive analysis would also include ridges, rubble fields and different ice types.
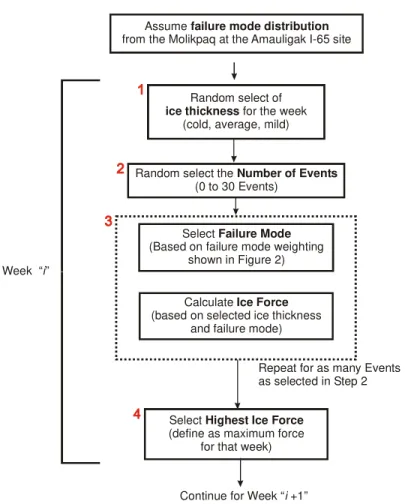
The steps for performing the probabilistic analysis for each week are shown schematically in Figure 5 and are discussed below. Note that the steps shown in this figure represent just one winter. In a full probabilistic model, many “winters” have to be simulated in order to predict load at the 10-4 or whatever exceedance level is desired.
1. The ice thickness was chosen by a random number generator to give three possible values for the week - a cold winter (upper curve in Figure 3), and average winter (middle curve in Figure 3) or a mild winter (lower curve in Figure 3). The distribution of the three values was uniform. The values that were selected using the random number generator for the one winter simulated are shown in Figure 3. In further development of the model it is envisioned that other distributions of weekly ice thickness will be developed. In actual practice, past records of ice conditions at the specific (drill) site could be used as an input into the model.
2. The number of events in a week was selected such that they could vary between zero and thirty. The choice was again based on a random number generation and selected from a uniform (linear) distribution.
3. For each event in the total selected for that week, the failure mode was chosen based on the probability of occurrence shown in Figure 2. The ice load was calculated for each failure mode using Equation (1) with the appropriate failure mode coefficient (Tfm).
4. The highest value of the calculated ice loads for the week was selected and used in the analysis.
The highest calculated ice load for each week is plotted in Figure 6 for one winter of simulation. It can be seen that there is a general increase in the weekly loads. This is a reflection of the ice thickness increase over the winter. Also, due to the random pick of the number of events there were four weeks for which there were no events, and hence a zero weekly load. Similar behaviour was observed in the original Tarsiut P-45 data, where there were also weeks in which there was no ice movement or open water around the structure, and hence, no ice loads during that week.
A comparison between the loads measured on the Molikpaq and those simulated for one winter is shown in Figure 7. The deterministic value of the global load based on the Korzhavin (1971) equation is also included on the figure. This was calculated using a compressive strength of 3 MPa, which corresponds to an indentation rate of 0.1 m/s, a contact factor of 0.6, structure width of 90 m, and the average ice thickness. It can be seen that the Korzhavin equation predicts significantly higher loads than the probabilistic simulation and the measured loads, except in the early winter when measured loads exceeded the Korzhavin prediction.
Figure 7 shows that the load values determined from the probabilistic simulation are generally comparable with those measured on the Molikpaq at the Tarsiut P-45 site. They show weekly fluctuations in a manner similar to that observed on the structure. The present approach provides a much more realistic estimate of the loads on the structure than the Korzhavin deterministic approach.
Week “ ”i
Repeat for as many Events as selected in Step 2
Continue for Week “ +1”i Random select of
for the week (cold, average, mild) ice thickness
Random select the (0 to 30 Events)
Number of Events
Select
(Based on failure mode weighting shown in Figure 2)
Failure Mode
Calculate (based on selected ice thickness
and failure mode) Ice Force
Select (define as maximum force
for that week) Highest Ice Force Assume
from the Molikpaq at the Amauligak I-65 site failure mode distribution
Figure 5: Schematic illustration of the method used for the probabilistic analysis.
0 50 100 150 200 250 1 2 3 4 5 6 7 8 9 10 11 12 13 14 15 16 17 18 19 20 21 22 23 24 25 26 27 28 29 30 31 32 33 34 35 36 37 38 Gl ob a l L o a d (M N )
Figure 6: Global Loads throughout the winter based on the probabilistic analysis. These represent the maximum load for each week based on the approach outlined in
0 50 100 150 200 250 300 350 1 2 3 4 5 6 7 8 9 10 11 12 13 14 15 16 17 18 19 20 21 22 23 24 25 26 27 28 29 30 31 32 33 34 35 36 37 38 39 G lob al L o ad (M N ) Probabilistic Calculation Molikpaq at Tarsiut P-45 Korzhavin Equation
Figure 7: Comparison on the global first-year ice loads measured on the Molikpaq at Tarsiut P-45 site with those calculated using the probabilistic approach. The deterministic Korzhavin equation is also included for comparison.
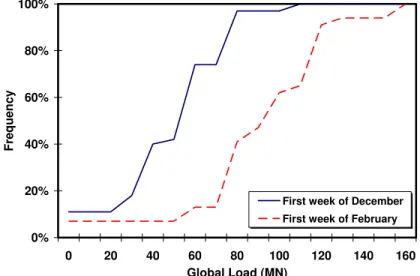
Figure 7 represents a single winter simulation. To explore variability more systematically, multiple simulations were carried out for two one-week periods, one for the first week of December and the other for the first week in February. A hundred simulations were run for each week period with ice thickness, number of events and failure mode being the variables. The results are plotted in Figure 8 as cumulative distributions. Since there are only three ice thickness values each week and four failure mode parameters, there are just twelve possible weekly maximum loads, ignoring a zero load. Thus the plot is “steppy”. This type of an analysis could be used to estimate expected loads at various times during the winter. It provides a basis for comparing weekly measured loads with those predicted for design load validation purposes, and for guiding operational procedures.
SUMMARY
A simple probabilistic model has been developed that incorporates a number of ice failure modes. It has been shown that loads calculated using this model quantitatively agree with observed ice loads on a wide offshore structure. The output from the probabilistic model shows that maximum weekly loads can vary greatly throughout the winter. It provided a more realistic prediction of the ice loads than the deterministic Korzhavin equation. Various improvements to the model have been discussed in this paper. In applying this model for a structure to be located at a specific site, there are a number of environmental parameters that must be known. These include details on the annual variation of the ice thickness, ice types, ice macrostructures, and ice movement. Details regarding the structure, including the waterline width, angle of outer face, and water depth are also key inputs into the model. An estimate of the potential for ice
grounding around the structure is also important since this can alter the failure mode distribution on the structure. It is planned to implement these features in the analysis in the near future. Overall, this approach should provide realistic load levels and information on the evolution of loads throughout the winter season.
0% 20% 40% 60% 80% 100% 0 20 40 60 80 100 120 140 160 Global Load (MN) Freq uen c y
First week of December First week of February
Figure 8: Cumulative distribution of predicted weekly maximum global loads on the Molikpaq for two different weeks in the winter.
ACKNOWELDGEMENTS
The authors would like to acknowledge the financial support for this work from the Program of Energy Research and Development (PERD) through the ice-structure interaction activity, and to Dennis Seidlitz and Conoco-Phillips for access to the Molikpaq data.
REFERENCES
Korzhavin, K.N. 1971. Action of Ice on Engineering Structures. US Army CRREL Translation TL260, Hanover, N.H., USA.
Timco, G.W. and Johnston, M. 2004. Ice Loads on the Caisson Structures in the Canadian Beaufort Sea. Cold Regions Science and Technology 38, pp 185-209. Wright, B., Pilkington, G.R., Woolner, K.S. and Wright, W.H. 1986. Winter ice
Interactions with a Arctic Offshore Structure, IAHR Symposium on Ice, Vol. III, pp 49-73, Iowa City, Iowa, USA.
Wright, B.D. and Timco, G.W. 1994. A Review of Ice Forces and Failure Modes on the Molikpaq. Proceedings of the 12th IAHR Ice Symposium, IAHR'94, Vol. 2,