HAL Id: hal-01183904
https://hal.inria.fr/hal-01183904
Submitted on 11 Aug 2015
HAL is a multi-disciplinary open access
archive for the deposit and dissemination of
sci-entific research documents, whether they are
pub-lished or not. The documents may come from
teaching and research institutions in France or
L’archive ouverte pluridisciplinaire HAL, est
destinée au dépôt et à la diffusion de documents
scientifiques de niveau recherche, publiés ou non,
émanant des établissements d’enseignement et de
recherche français ou étrangers, des laboratoires
for NUMA Multicores
Humayun Kabir, Joshua Booth, Guillaume Aupy, Anne Benoit, Yves Robert,
Padma Raghavan
To cite this version:
Humayun Kabir, Joshua Booth, Guillaume Aupy, Anne Benoit, Yves Robert, et al.. STS-k: A
Mul-tilevel Sparse Triangular Solution Scheme for NUMA Multicores. [Research Report] RR-8763, Penn
State University; ENS Lyon; INRIA. 2015. �hal-01183904�
0249-6399 ISRN INRIA/RR--8763--FR+ENG
RESEARCH
REPORT
N° 8763
August 2015Sparse Triangular
Solution Scheme for
NUMA Multicores
Humayun Kabir, Joshua Booth, Guillaume Aupy, Anne Benoit, Yves
Robert, Padma Raghavan
RESEARCH CENTRE GRENOBLE – RHÔNE-ALPES
Inovallée
Humayun Kabir
∗, Joshua Booth
†, Guillaume Aupy
‡, Anne
Benoit
‡, Yves Robert
द, Padma Raghavan
∗Project-Team ROMA
Research Report n° 8763 — August 2015 — 29 pages
Abstract: We consider techniques to improve the performance of parallel sparse triangular
solution on non-uniform memory architecture multicores by extending earlier coloring and level set schemes for single-core multiprocessors. We develop STS-k, where k represents a small number of transformations for latency reduction from increased spatial and temporal locality of data accesses. We propose a graph model of data reuse to inform the development of STS-k and to prove that computing an optimal cost schedule is NP-complete. We observe significant speed-ups with STS-3 on STS-32-core Intel Westmere-EX and 24-core AMD ‘MagnyCours’ processors. Incremental gains solely from the 3-level transformations in STS-3 for a fixed ordering, correspond to reductions in execution times by factors of 1.4 (Intel) and 1.5 (AMD) for level sets and 2 (Intel) and 2.2 (AMD) for coloring. On average, execution times are reduced by a factor of 6 (Intel) and 4 (AMD) for STS-3 with coloring compared to a reference implementation using level sets.
Key-words: Linear algebra; distributed computing; NUMA architecture.
∗Department of Computer Science & Engineering, Pennsylvania State University, USA †Center for Computer Research, Sandia National Laboratories, USA
‡LIP, ´Ecole Normale Sup´erieure de Lyon, INRIA, France §Institut Universitaire de France
R´esum´e : Nous montrons comment am´eliorer les performances des solveurs
parall`eles pour les syst`emes lin´eaires triangulaires creux sur des architectures
multi-cœurs, en ´etendant les techniques coloring et level set utilis´ees sur des
clusters de processeurs `a un seul cœur. Nous pr´esentons STS-k, o`u le param`etre
k repr´esente le nombre de transformations pour r´eduire la latence. Nous
pro-posons une mod´elisation de la r´e-utilisation des donn´ees, et nous ´etablissons la
NP-compl´etude du probl`eme d’ordonnancement associ´e.
Les facteurs d’acc´el´eration obtenus avec STS-3 observ´es sont notables, que
ce soit sur des processeurs Intel Westmere-EX 32-core ou sur des AMD
‘Magny-Cours’ 24-core. Les temps d’ex´ecution sont r´eduits en moyenne d’un facteur 6
(intel) et 4 (AMD) pour STS-3 utilisant coloring compar´e `a une impl´ementation
de r´ef´erence qui utilise level-set.
1
Introduction
Sparse triangular solutions are required in many scientific applications, and particularly when sparse linear systems are solved using a method such as pre-conditioned conjugate gradient. Parallel implementations of sparse triangular solution tend to perform poorly for several reasons. The dependencies aris-ing from the sparsity structure can reduce the number of tasks that can be computed in parallel. There are often significant overheads related to synchro-nization after the completion of each set of independent tasks. Furthermore, higher data access latencies can degrade the efficiency of an implementation especially on multicores with large core counts and non-uniform memory ar-chitectures (NUMA). These factors present new opportunities for speeding-up sparse triangular solution on NUMA multicores [12]. An added benefit is that any performance gains that can be achieved at a multicore node will also increase efficiencies when larger problems are solved across multiple multicore nodes of a high performance computing cluster.
We consider sparse triangular solutions with a lower triangular coefficient matrix L, i.e., solving for x in the system L×x = b. We provide a new multilevel method that we call STS-k, where k is a small integer that reflects the number of transformations. These transformations lead to k-levels of sub-structuring of the data with large independent sets or packs of tasks that reuse components of the solution vector. These packs can be scheduled on a NUMA multicore to promote reuse through temporal locality for enhanced levels of performance from reduced latencies of data accesses.
The remainder of this paper is organized as follows. Section 2 contains a brief overview of parallel sparse triangular solution and prior related research. Section 3 contains our main contributions. These include a Data Affinity and Reuse (DAR) task graph model to study the complexity of optimal scheduling schemes, to prove that computing the schedule of minimum time is NP-complete, and to formulate heuristics that inform the development of STS-k. Section 4 concerns an in-depth empirical evaluation of STS-k, with k=3 on 1-32 cores of an Intel Westmere-EX processor and on 1-24 cores of an AMD ‘MagnyCours’ processor. Section 5 contains concluding remarks including directions for future research.
2
Background and Related Work
In this section, we provide a brief overview of sparse triangular solution and review of related work.
Sparse Triangular Solution. Sparse triangular solution concerns a linear system of equations of the form L × x = b, where L is a sparse lower triangular matrix and b a vector. Components of the solution vector x are computed using elements of L and b. Observe that if the matrix L were dense, then triangular
solution would be inherently sequential in that the solution for component xi
components have to be computed in order from the first to the last one. The sparsity of L, i.e., the presence of zeroes, removes this constraint although there will be dependencies among groups of the solution vector components. These dependencies need to be managed for effective parallelization and to promote data reuse to reduce latencies of data accesses on NUMA multicores.
Related Research. There are two alternative techniques, one based on color-ing and the other on level sets, to compute ordercolor-ings that expose parallelism in sparse triangular solution.
The earliest scheme, based on graph coloring, was proposed by Schreiber and Tang [9] in the eighties to extract parallelism in sparse triangular solution for efficient implementations on multiprocessors. Consider the graph of the matrix
A = L + LT, G = (V, E) where each row/column in A corresponds to a vertex
in G and an edge exists between vertex i and j if and only if Aij6= 0. Now G is
colored, followed by a reordering of the matrix L in which rows/columns in each color are numbered contiguously, in some order of the colors. This method is very effective in identifying large independent sets of tasks that can be processed in parallel to calculate corresponding components of the solution vector.
In the nineties, a level set reordering was proposed by Saltz [8] as a scheme to enable parallel sparse triangular solution on multiprocessors. In this approach,
a variant of breadth-first search is performed on the graph of A = L + LT to
identify a succession of vector solution components that can be computed con-currently. Each level identified in the search corresponds to a set of calculations that can be performed in parallel after the previous levels have been completed. A parallel step in sparse triangular solution corresponds to solving unknowns within the same color or same level, concurrently. These parallel steps must be performed one after the other because they depend on unknowns that were computed in a preceding step, i.e., at a preceding color or level. Consequently, their total number, which is equal to the number of colors or levels, and the average number of solution components per step provide a measure of available parallelism. The total number of these steps is also a measure of the overheads of synchronization that must occur within an implementation of parallel sparse triangular solution.
More recently, Naumov [6] developed a sparse triangular solution scheme for Nvidia GPUs using the level set ordering to extract parallelism. We utilized the fact that graph coloring is very effective in extracting large independent sets of calculations to develop an alternate scheme for sparse triangular solution on GPUs [11]. This scheme resulted in very large factors of performance gains relative to the Nvidia implementation based on level set ordering [6].
Wolf et al. [12] considered several factors influencing the performance of sparse triangular solution on multicores to conclude that the overheads of syn-chronization between parallel steps have the greatest effect on the performance of sparse triangular solution. Earlier, we had proposed a multilevel compressed sparse row sub-structuring (CSR-k) as an alternative to the traditional com-pressed sparse row format for sparse matrix calculations on NUMA multi-cores [4]. This sub-structuring of the sparse matrix seeks to mimic the mul-tiple levels of caches present in NUMA multicores to increase locality of data
accesses. Our evaluation for parallel sparse matrix vector multiplication indi-cated significant performance benefits largely as a consequence of higher cache hit rates and an effective reduction in data access latencies.
In this paper, we adapt CSR-k, coloring and level-set approaches and develop a scheduling framework for efficient parallel sparse triangular solution on NUMA multicores. l11# l13# l19# l22# l24# l29# l31# l33# l36# l42# l44# l46# l47# l55# l57# l58# l63# l64# l66# l67# l74# l75# l76# l77# l78# l85# l87# l88# l89# l91# l92# l98# l99# x6# G1#=#G(A)# A#=#L#+#L’# x9# x8# x5# x7# x4# x2# x1# x3# 6,7# 9# 1,3# 2,4# 5,8# G2#
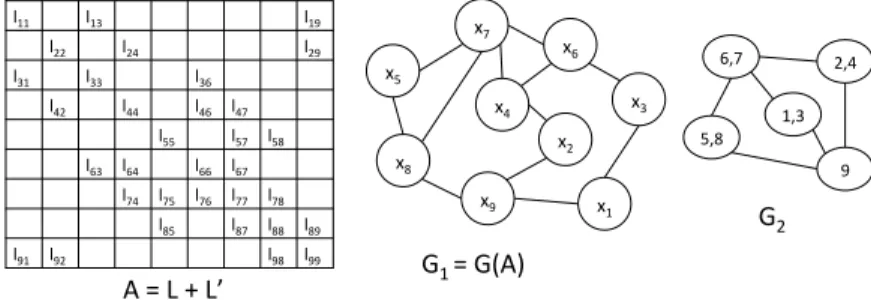
Figure 1: A = L + LT (left) and its graph G
1 (middle) transformed into G2
(right) with super-rows through coarsening. A vertex of G2 is formed by
col-lapsing two connected vertices of G1.
3
STS-k:
A
Multilevel
Sparse
Triangular Solution Scheme
for NUMA Multicores
In this section, we develop STS-k, a multilevel scheme for sparse triangular solution to achieve high performance on NUMA multicores. The key idea is to restructure the traditional scheme to exploit the memory hierarchy of NUMA multicores that affect data access latencies.
We develop STS-k as a specific composition of key techniques. We first con-sider techniques to increase: (i) spatial locality of memory accesses by grouping rows into super-rows; and (ii) the size of independent sets of super-rows that can be processed in parallel. Next, we develop a NUMA-aware task graph model of calculations in an independent set, or pack, and specify a scheduling prob-lem, which we show to be NP-complete. Then, we present a special case of the scheduling problem and its heuristic solution. These results inform a fur-ther level of sub-structuring to promote data reuse through temporal locality of shared solution components among tasks in a pack to yield STS-k. We ex-pect that STS-k will permit high levels of parallelism and spatial and temporal locality of data accesses to significantly speed-up sparse triangular solution on NUMA multicores.
3.1
Super-rows for Increasing Spatial Locality in Data
Ac-cesses
In our previous work [4], we introduced CSR-k, a multi-level compressed sparse row format for efficient sparse matrix-vector multiplication, SpMV, on multi-core processors. In this scheme, k is an integer greater than 1 that represents the number of well-differentiated levels in the memory hierarchy of a multicore processor and it is used to repeatedly (k − 1 times) group rows of the matrix into a format that increased the spatial locality of access during SpMV. We now adapt CSR-k to improve spatial locality in accesses to L and x in sparse triangular solution.
CSR-k uses the graph form of a symmetric sparse matrix; in sparse tri-angular solution we have only a sparse lower tritri-angular matrix L but we can
construct an equivalent symmetric matrix A = L + LT and consider its
undi-rected graph G1 (see Figure 1 for an example). Consider a number of rows
of A that have in common one or more columns with nonzeroes in them, or
equivalently, their vertex counterparts in G1that are connected by many edges.
The latter can be agglomerated to form a super-vertex with the corresponding rows in A forming a super-row. This agglomeration can be formalized using graph coarsening or grouping together continuous rows of A, if it is ordered us-ing band-reducus-ing orderus-ing, such as reverse Cuthill-McKee [1] (more details can be found in [4]). The coarsened graph corresponding to this grouping, whose
vertices now represent super-rows, is denoted by G2. For example, in Figure 1,
each super-row consists of two rows of A that share nonzeroes in a column. In CSR-k this process is repeated k − 1 times to get super-rows, super-super-rows and so on. Further, coarsening is performed in such a way to seek super-rows with equal numbers of nonzeroes to enable equal work tasks.
When CSR-k is developed for performing parallel SpMV, observe that there are no dependencies among tasks that operate on super-rows. Instead, there are opportunities to exploit spatial locality in accessing the matrix, the vector and potentially promoting reuse in the vector [4]. Consequently, k could be selected and combined with certain data reordering and restructuring techniques purely to promote locality at various levels of the NUMA cache hierarchy [4]. However, parallelism in sparse triangular solution is markedly more limited and complex. Consequently, we recommend keeping k to a very small value of 1 or 2 to increase spatial locality to a certain extent while retaining a large fraction of the fine-grained connectivity structure to extract parallelism before additional locality enhancing techniques are applied.
3.2
Identifying Large Packs or Sets of Independent
Super-rows for Parallel Processing
Traditionally, methods such as level-set [6, 8] and coloring [9, 11] have been
ap-plied to G1, the graph of A1= L + LT to identify independent sets of solution
vector components so that the associated tasks can be performed in parallel. The number and sizes of such independent sets matter with larger and fewer
sets being more desirable. This is because larger sets represent a greater degree of available parallelism. Further, there are dependencies between these indepen-dent sets in that they have to be computed one after the other in order to ensure that components computed in earlier sets are available for use in later sets; a smaller number of sets leads to fewer synchronization points during sparse tri-angular solution. As discussed in Section 2, coloring is generally superior to level-set in regard to these factors.
To identify independent set of super-rows and the subsets of their solution vector components that can be computed in parallel, either level-set or coloring
can be applied to G2. We expect that coloring will be more effective than
level-set in producing fewer and larger independent sets or packs. Further, we
expect that level-set may actually do better when applied to G2 as opposed to
G1 because G2 has fewer vertices leading to a fewer levels in level-set and thus
fewer independent sets representing larger amounts of parallel work. To further accentuate this effect, we propose that level-set be applied starting with a vertex
of largest degree. Assume that some n3 packs are obtained and that they are
denoted by Pk, k ∈ 1, . . . , n3. Typically, tasks related to solving for unknowns
in Pk will depend on solution components from all previous packs P1, . . . , Pk−1.
To increase the level of reuse of solution components from earlier independent sets, we propose ordering the independent sets in increasing order of their sizes,
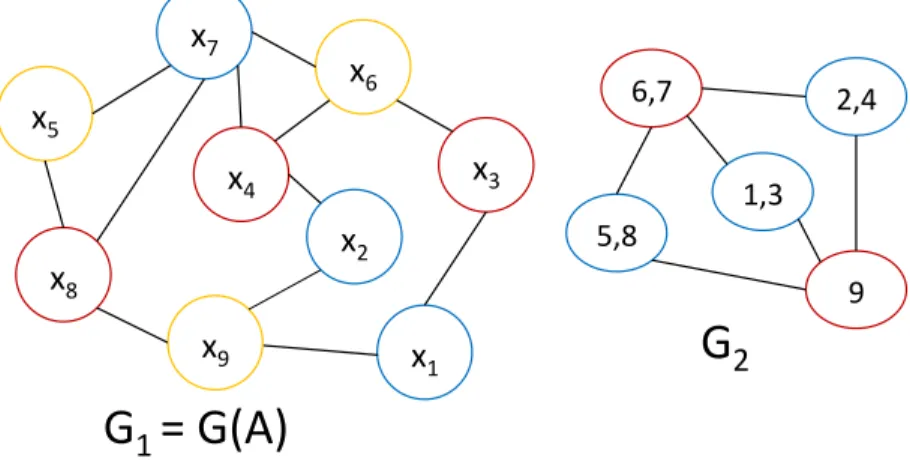
i.e., find a permutation π such that |Pπ(1)| ≤ |Pπ(2)| ≤ · · · ≤ |Pπ(n3)|. Figure 2
shows G2 from the earlier example organized into independent sets or packs
after coloring.
l
11#
l
13#
l
19#
l
22#
l
24#
l
29#
l
31#
l
33#
l
36#
l
42#
l
44#
l
46# l
47#
l
55#
l
57# l
58#
l
63# l
64#
l
66# l
67#
l
74# l
75# l
76# l
77# l
78#
l
85#
l
87# l
88# l
89#
l
91# l
92#
l
98# l
99#
x
6#
G
1#
=#G(A)#
A#=#L#+#L’#
x
9#
x
8#
x
5#
x
7#
x
4#
x
2#
x
1#
x
3#
6,7#
9#
1,3#
2,4#
5,8#
G
2
#
Figure 2: Independent sets or packs of rows obtained after coloring of G1(left)
and packs of super-rows after coloring of G2 of the example shown earlier in
3.3
NUMA-aware Scheduling of Packs for Utilizing
Tem-poral Locality of Data Accesses
Once packs and their ordering have been determined, their constituent tasks can
be processed in order from pack P1through to Pn3. We now consider scheduling
tasks in a pack in order to utilize the sharing of specific solution components from a previous pack among tasks in the current pack.
Without loss of generality, assume that a task corresponds to a super-row and its associated solution components. Such a task would require arithmetic operations proportional to the number of nonzeroes in the associated super-row. By construction, each super-row was selected to have approximately the same number of non-zeroes and so the number of arithmetic operations per task could be assumed to be equal and of a certain value e. However, actual execution times would depend on the cost of data accesses. One way to reduce latencies is by promoting reuse of solution components from proximal caches in the NUMA sense. We now seek to formalize these costs so we may study how tasks within a pack may be scheduled in a NUMA-aware manner.
We formulate a data affinity and reuse, i.e., a DAR graph of pack k, DAR(k) =
(Vk, Ek), where Vk= {tm∈ Pk}, the set of tasks in Pk. We denote the unknowns
in a task tl by xl and the set of unknowns on which the solution of xldepends
upon is denoted by DXl. Now, there is an edge between tasks tl and tm, i.e.,
(tl, tm) ∈ Ek, if DXl∩ DXm6= ∅.
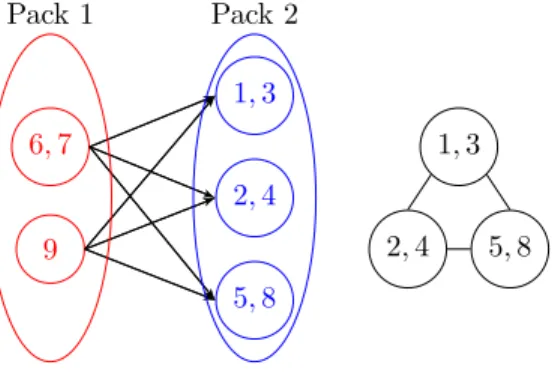
A DAR of a pack is shown in Figure 3. We want a schedule of the tasks in a pack, i.e., tasks to cores mapping is sought in order to balance the load across cores and to minimize data access costs based on a latency model that concern NUMA-distances between cores. First, we show that this scheduling problem is NP-complete even on a Uniform Memory Access (UMA) architecture. After that we propose a heuristic algorithm for this assignment problem which is useful for a particular kind of DAR.
6, 7 9 1, 3 2, 4 5, 8 Pack 2 Pack 1 1, 3 2, 4 5, 8
Figure 3: The construction of packs (left) and data affinity and reuse (DAR)
graph of tasks of the second pack of G2 (right) based on the example shown in
Figure 2. Each task corresponds to a super-row and two tasks are connected if they need elements of x computed in the first pack.
To assess the complexity, we start by simplifying the cache-model of the processor as much as possible while retaining the combinatorial nature of the problem. It turns out that we can consider a single level of cache with unlimited capacity. Roughly speaking, this would be similar to only considering the (very large) L3 cache.
Definition 1 (One-level platform). We suppose that we have q processors that share a storage location of infinite volume (called memory). There are q caches
C1, . . . , Cq such that:
• Processor j can only read data stored in cache Cj at a cost r.
• The cost to copy some unit of data from memory to any cache is w. • Each cache has an infinite volume.
Definition 2 (In-Pack). In-pack affinity-aware assignment problem:
We have a set of tasks (t1, . . . , tn) that we want to schedule on q processors.
We assume that the tasks have equal execution time e. Let Ii be the set of data
inputs necessary for the execution of ti. The In-Pack problem is to schedule
the n tasks on q processors while minimizing execution time.
In order to schedule the n tasks on the q processors, we need to partition
the tasks onto these processors. Let π be a schedule: task ti is mapped onto
processor π(ti). For 1 ≤ j ≤ q, let Vj = {i | π(ti) = j} denote the indices of
tasks mapped onto processor j. The execution time of processor j is the sum of:
• the cost of transferring required data inputs to its cache: w · | ∪i∈VjIi|;
• the time to execute the tasks:
e · |Vj|;
• the time to perform the required number of reads:
r ·X
i∈Vj
|Ii|.
Note that we have the sum of the cardinalsP |Ii| rather than the cardinal
of their union |S Ii| (as for the copy from memory to cache), because the
input of the ALU buffers must be reloaded for each task. Finally, the execution time of a schedule is:
max 1≤j≤q w · [ i∈Vj Ii + e · |Vj| + r · X i∈Vj |Ii| . (1)
The decision problem associated to In-Pack is to determine whether their exists a schedule of given length K.
Theorem 1. The In-Pack problem is NP-complete even when r = e = 0, i.e., when accounting only for memory to cache transfers.
Proof. The In-Pack problem clearly belongs to NP. To show the completeness,
we use a reduction from 3-Partition. Consider an arbitrary instance I1 of
3-Partition: given an integer B and 3n integers a1, . . . , a3n (for all i, B4 <
ai < B2), can we partition the 3n integers into n triplets, each of sum B? We
can assume thatP3n
i=1ai = nB, otherwise I1has no solution. The 3-Partition
problem is NP-hard in the strong sense [3], which implies that we can encode
all integers (a1, . . . , a3n, B) in unary.
We build the following instance I2 of In-Pack:
• There are q = n processors;
• There are Bn tasks (t1, . . . , tBn);
• There are Bn data inputs X = (x1, . . . , xBn);
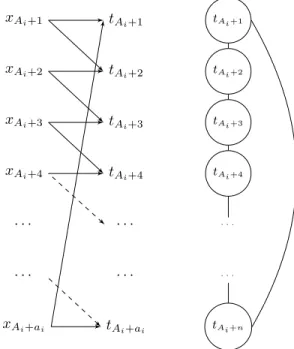
• The dependence graph has 3n connected components (intuitively, one for
each ai). Each task in a connected component has two data inputs, as
shown in Figure 4. Formally, let Ai =P
i−1
i=1ai, then for j ∈ {1, . . . , ai},
the inputs of task tAi+j are
IAi+j= {xAi+j, xAi+(j mod ai)+1}.
• Finally, we take r = 0 and e = 0 and ask whether there exists a schedule of execution time at most K = wB.
Clearly, I2 has a size polynomial in the size of I1 when I1 is written in
unary. With r = e = 0, minimizing the execution time becomes the problem of minimizing: max 1≤j≤q [ i∈Vj Ii . (2)
In the following, we let Ti= {tAi+1, . . . , tAi+ai} be the set of the aitasks in
the connected component corresponding to ai. By construction,
[
tj∈Ti
Ij= {xAi+1, . . . , xAi+ai}. (3)
Furthermore, let i 6= i0, then
[ tj∈Ti Ij \ [ tj∈Ti0 Ij = ∅. (4)
We now prove that I1has a solution if and only if I2does. Assume first that
I1has a solution. For each triplet of the n triplets (ai, aj, ak) of I1, we schedule
Ti, Tj and Tk on a single processor. According to Equations (3) and (4), then
xAi+1 xAi+2 xAi+3 xAi+4 · · · · · · xAi+ai tAi+1 tAi+2 tAi+3 tAi+4 · · · · · · tAi+ai tAi+1 tAi+2 tAi+3 tAi+4 · · · · · · tAi+n
Figure 4: Input dependencies for the tasks (left) and its DAR graph (right). There are 3n such connected components.
to ai+ aj+ ak = B. Hence this schedule has an execution time of wB. Hence
a solution to I2.
Assume now that I2 has a solution. Since the execution time is wB, there
are at most B data input copied on each cache. Furthermore, because we have to copy all data input at least once, there are exactly B data input copied on each cache. Finally, no data input is copied on two different caches, otherwise we would copy at least nB + 1 data inputs, which would make at best an execution
time of wnB+1n .
Let us now show that for each set of tasks Ti, all the tasks of Tiare scheduled
on the same processor. By contradiction, assume that there exists j < j0 such
that tAi+j, tAi+j0 ∈ Ti, and π(tAi+j) 6= π(tAi+j0). Then we have two successive
tasks between tAi+j and tAi+j0 that are not mapped onto the same processor.
Formally, there exists jmin> j such that
π(tAi+j) = π(tAi+jmin −1) 6= π(tAi+jmin) = π(tAi+j0).
Then xAi+jmin −1 is an input common to both tasks tAi+jmin −1 and tAi+jmin,
hence it has to be copied on both processors π(tAi+j) and π(tAi+j0), which
contradicts the fact that each input is copied at most once.
This shows that each connected component of the task graph is mapped onto a single processor. Now each processor has execution time at most wB, hence it can be assigned at most three such connected components, because of
the condition B
4 < ai< B
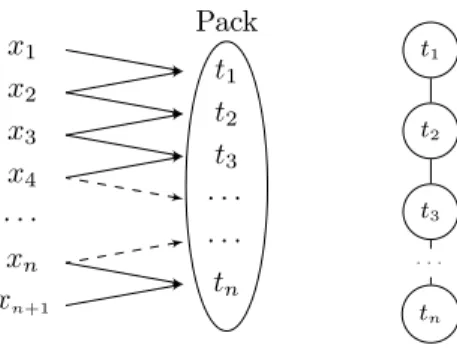
x1 x2 x3 x4 · · · xn xn+1 t1 t2 t3 · · · · · · tn Pack t1 t2 t3 · · · tn
Figure 5: The dependency graph for a pack where tionly shares input with ti−1
and ti+1 (left), and its DAR graph (right).
nB, each processor has execution time exactly wB, and this gives a solution to I1.
A heuristic algorithm for the In-Pack problem.
Fortunately, some task graphs are easier to schedule. Consider the task graph represented in Figure 5, where we have a long suite of tasks in a pack each with two inputs. We discuss in the next subsection when this structure arises in sparse triangular solution. In the In-Pack task graph on the right
of the figure, there is an edge between ti and ti+1 if they reuse data to solve
for the unknowns in these tasks. This reuse is due to temporal locality of x during concurrent execution of the tasks. Note that this graph corresponds to one connected component in Figure 4 but without the backward edge (and n
tasks instead of ai). We will use this simple task graph in Section 4. Simply
assume that n is a multiple of q, n = mq. Then the static scheduling algorithm that assigns blocks of m tasks to processors is optimal: it has an execution time w · (m + 1) + e · m + r · (2m), and each of these terms is optimal. However, the model does not account for variability across processor speeds, a phenomenon to be expected in practice, and we transform the stator algorithm above into a dynamic heuristic as follows: To complete the tasks at the earliest, assign the
available processors c1, c2, . . . , cq to the tasks t1, t2, . . . , tq. At some point the
tasks t1, t2, . . . , tkwould be completed. Assign the next task tk+1to processor cj
if it is free. This assignment ensures sharing of x in L3 between tasks tk and
tk+1.
Other scheduling techniques to enhance temporal locality could be envi-sioned, and we leave them for future work. In Section 4, we perform an experi-mental evaluation of the STS-k algorithm.
3.4
STS-k: A k-level Sub-structuring of Sparse L × x = b
for Spatial and Temporal Locality of Data Accesses
We now propose a heuristic STS-k, that is informed by the algorithm to utilize temporal locality in the In-Pack assignment problem when its DAR is a line as shown in Figure 5. STS-k involves a further restructuring of super-rows in a pack so that its DAR will contain the line graph form.
Starting with the ordering across independent sets proposed earlier, namely
a permutation π in increasing order of pack size, consider a specific Pk and its
DAR(k). Let Lkxk = bk− L∗jx∗j correspond to the calculations across all tasks
in Pk. The xk are calculated using Lk and bk after previously computed
com-ponents x∗j and their corresponding elements in L, namely L∗j, are removed.
Observe that DAR(k) does not correspond to the graph of Ak = Lk + Lk T.
Instead it corresponds to the graph G( ˆAk) where ˆAk
il6= 0 if and only if ˆLij 6= 0
and ˆLlj 6= 0, j < i, l , i.e., two rows share a solution component xj from a
previ-ous pack corresponding to elements in L∗j. The matrix ˆAk need not be formed
at all. However, observe that if ˆA were to be tri-diagonal then G( ˆAk) would
indeed be a line graph. Similarly, if ˆAk could be put in a sparse band-reduced
form, then its corresponding G( ˆAk) would contain a line graph. We therefore
reorder DAR(k), and hence G( ˆAk) using Reverse Cuthill-McKee [1]. Following
that, we permute Lk according to this ordering. Other bandwidth reducing
or-dering schemes can also be used to reorder ˆAk, we consider them in our future
work.
The ordering across and within packs of the super-rows and their constituent
rows, gives a 3-level sub-structure that we denote as LST S−k∗xST S−k = bST S−k.
For a small sparse matrix from a fluid dynamics application L is shown with coloring (9 colors), and restructured L with STS-3 (4 colors) in Figure 6. Con-sider the last pack in each case; observe how the off-diagonal parts of our STS-k formulation are structured whereas these areas are disordered for the traditional scheme. These substructures in STS-k reflect the line graph form that is present in the reuse of solution components from previous packs.
The 3-level structure in STS-k maps very simply to the traditional com-pressed sparse row representation of sparse triangular solution formulation as
shown in Algorithm 1 by using two additional sets of indices. An array index3
of size n3, the number of packs, points to the first super-row of each pack.
Simi-larly, index2array indicates the first row of each super-row. These two arrays in
addition to the traditional compressed sparse row format arrays, namely index1,
subscript1, and valueLcomplete the 3-level representation. Observe that the
storage format is similar to what was developed earlier for parallel sparse matrix vector multiplication [4]. However, it differs in how it was specifically derived to expose parallelism and locality of data accesses for sparse triangular solution. These attributes derive in part from the original sparsity structure of L and additionally from the effect of orderings across and within packs for spatial and temporal locality.
Thus far we have developed STS-k for k=3. However, depending on how many distinct levels there may be in a given NUMA multicore, additional group-ings of super-rows into tasks could be considered for exposing locality in ways that could be potentially utilized for higher levels of sharing in the memory subsystem.
Algorithm 1 STS-k with k=3 for sparse L × x = b; the packs form the highest level of agglomeration at k = 3, followed by super-rows k = 2, and rows in the traditional compressed sparse row format k = 1, for a natural OpenMP implementation.
1: INPUT: index3, index2
2: INPUT: index1, subscript1, valueL, x, b
3: for i3= 1 to n3 do
4: #pragma omp parallel for schedule(runtime, chunk)
5: for i2= index3[i3] to index3[i3+ 1] − 1 do
6: for i1= index2[i2] to index2[i2+ 1] − 1 do
7: temp val = 0
8: for j = index1[i1] to index1[i1+ 1] − 2 do
9: temp val+ = valueL[j] ∗ x[subscript1[j]]
10: end for
11: x[i1] = (b[i1] − temp val)/valL[index1[i1+ 1] − 1]
12: end for
13: end for
14: end for
4
Experimental Results
In this section, we empirically evaluate the performance of STS-3 including comparisons with reference implementations with either level-set or coloring orderings. After a brief description of our evaluation approach, we consider the following. We first seek to characterize the levels of parallelism that are exposed when coloring or level-set orderings are applied to either the original matrix or its CSR-2 representation in STS-k. Next, we consider the incremental impact on performance solely from the k-level sub-structuring in STS-k for either ordering schemes. Finally, we consider how effective STS-k is in speeding-up the largest pack by increasing the locality of data accesses for its tasks.
4.1
Test Environment and Approach
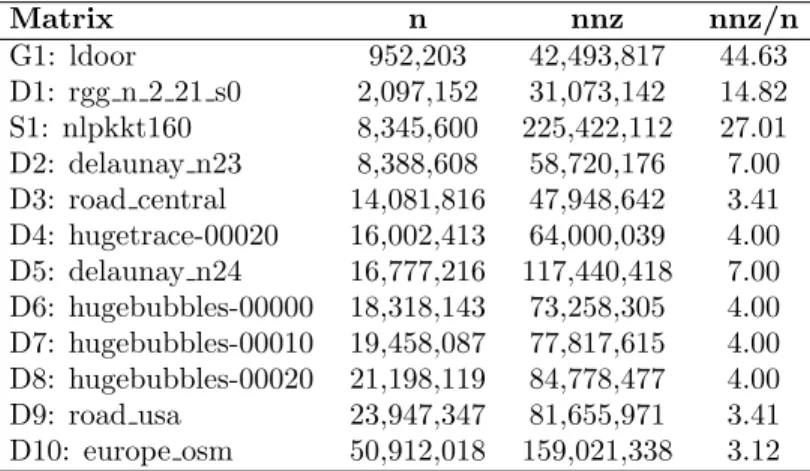
Matrix Test Suite. Our test suite consists of the lower triangular parts of 12 sparse symmetric matrices selected from the University of Florida Sparse Matrix Collection [2]. These are listed in Table 1 with the number of rows n ranging from 0.9 to 50.9 million, non-zeros (nnz) in the range 31.0 to 225.4 million and row densities (nnz/n) in the range 3.1 to 44.63.
Multicore Architectures. We perform tests on an Intel and on an AMD multicore node. The Intel node contains 4 Intel Xeon E7-8837 chips each containing 8 cores connected via QPI (Westmere-EX microarchitecture). The memory hierarchy of the system consists of L1, L2, L3 cache and 512 GB of DRAM. Each core has private 64 KB L1 and 256 KB L2 caches with access latencies of 4 and 10 cycles respectively [5]. The 24 MB L3 cache is shared among all 8 cores and it shows NUMA effects with latencies that can vary from 38 to 170 cycles depending on location. Furthermore, the memory access latencies are 175-290 cycles [5]. We
Matrix n nnz nnz/n G1: ldoor 952,203 42,493,817 44.63 D1: rgg n 2 21 s0 2,097,152 31,073,142 14.82 S1: nlpkkt160 8,345,600 225,422,112 27.01 D2: delaunay n23 8,388,608 58,720,176 7.00 D3: road central 14,081,816 47,948,642 3.41 D4: hugetrace-00020 16,002,413 64,000,039 4.00 D5: delaunay n24 16,777,216 117,440,418 7.00 D6: hugebubbles-00000 18,318,143 73,258,305 4.00 D7: hugebubbles-00010 19,458,087 77,817,615 4.00 D8: hugebubbles-00020 21,198,119 84,778,477 4.00 D9: road usa 23,947,347 81,655,971 3.41 D10: europe osm 50,912,018 159,021,338 3.12
Table 1: Test suite of matrices with dimension n, the number of non-zeroes nnz, and the average row densities nnz/n.
denote this node by Intel in the rest of the paper.
The AMD node consists of 2 twelve-core AMD ‘MagnyCours’ processors [7]. The memory subsystem of this processor has L1, L2, L3 cache and 64 GB of DRAM. Each core has private 64 KB L1 and 512 KB L2 cache and a 6 MB L3 cache is shared among 6 cores. This processor is denoted by AMD in the rest of the paper.
The value of k in STS-k is determined as follows. One value of k is reserved for set of independent tasks, i.e., at the pack level. The value of k-1 depends on a particular architecture and the number of distinct levels of caches with well-differentiated latencies from NUMA effects. In our test systems, L1 and L2 are private with relatively low latencies while L3 is shared with a large variation in latencies, leading to k-1=2, with third value indicating pack level grouping. So we choose k = 3 and evaluate the performance of STS-3 on both Intel and AMD processors. In practice, the sensitivity of performance to the value of k could be tested by trying +/-1 values. Additionally, to correspond to bigger
L2 cache on AMD, super-rows are consisted of 320 rows of G1 while super-rows
have 80 rows of G1 on Intel.
Sparse Triangular Solution Schemes. We consider sparse triangular solution using the compressed sparse row format (CSR) with either level-set or coloring orderings as the reference schemes for comparisons. These are labeled as CSR-LS and CSR-COL in the remainder of this paper. Our STS-k formulation with k = 3 and coloring is denoted by STS-3 or equivalently CSR-3-COL. Its alternative formulation with level-set ordering is indicated as CSR-3-LS.
The reference implementations, namely CSR-LS and CSR-COL, tend to be
far more sensitive to the initial ordering of the matrix than STS-k. They
typically perform best when the matrix is presented in the Reverse Cuthill-McKee [1], i.e., RCM, ordering. We therefore use the RCM ordered matrix as the input to all schemes including STS-k. Furthermore, for all schemes,
fol-lowing the application of either level-set or coloring, the packs are arranged in increasing order of their sizes and the rows within packs are renumbered con-tiguously. Level-set orderings are constructed starting with a vertex of largest degree, because we have observed this leads to fewer and larger packs. Con-sequently, they provide near best case instances for comparisons with coloring in regard to effectiveness in extracting parallelism. Colorings were obtained us-ing the Boost library [10]. These steps ensure that differences between the two pairs, CSR-3-LS and CSR-LS, and CSR-3-COL (or STS-3) and CSR-COL, are removed except when that are by design.
All methods were compiled using Intel’s icc 15.0.0 (Intel) and 15.0.1 (AMD) with -O3 optimization. We use Intel’s OpenMP 4.0 with thread affinity set via KMP AFFINITY = compact, and with KMP LIBRARY = throughput. Tests with CSR-COL and CSR-LS used scheduling with
OMP SCHEDULE = dynamic, 32 because they resulted in the best
perfor-mance. For similar reasons, tests with STS-3 (CSR-3-COL) and CSR-3-LS
used OMP SCHEDULE = guided, 1. We consider execution time in seconds measured as the average of 10 sparse triangular solution repeats. Overheads of pre-processing for all schemes are ignored. This is an accepted approach because such systems are solved for large sequences of right-hand side vectors within an application with the pre-processing costs getting amortized over all these repetitions.
4.2
Effectiveness Level-Set and Coloring Orderings in
Ex-tracting Parallelism
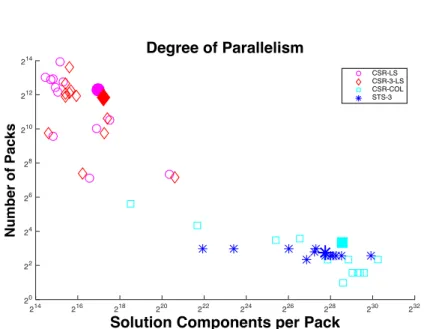
We would like to consider how effective level-set and coloring orderings are in regard to exposing parallelism. Figure 7 shows how the four methods cluster over all 12 matrices along two key dimensions, namely the number of packs and the number of solution components that are calculated on average per pack. The clustering indicates that coloring is significantly more effective than level-set at exposing parallelism; the number of packs using level-set are larger while their sizes are larger using coloring, both by several orders of magnitude (note log scale). Furthermore, applying CSR-3, as we propose for the STS-3 formulation, causes small decreases in the number of packs with slight increases in their sizes. This is evident from the positioning of the cluster centroids for CSR-3-COL (STS-3) and CSR-3-LS slightly below and to the left of those for CSR-COL and CSR-LS respectively.
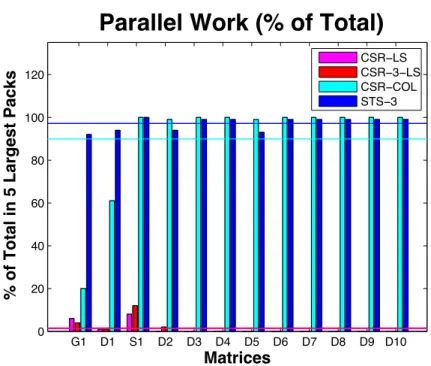
The total work in sparse triangular solution is proportional to the number of nonzeroes, where work is a fused multiple-add instruction. The percentage of this total work contained in a few of the largest packs is another measure of the degree of parallelism. This measure is particularly important because it reflects how latencies could be masked by parallelism subject to bandwidth constraints (Little’s Law). Additionally, when the total work is scattered across many packs, synchronization costs between packs can be substantial, degrading performance. The percentage of parallel work in the 5 largest packs is shown in Figure 8 further substantiating coloring to be the ordering of choice.
The measures of parallelism that we have reported thus far in Figures 7 and 8, are independent of the multicore architecture. Although they predict a sizable gap in performance between schemes that use level-set versus coloring, hardware and OpenMP attributes will likely modify the actual gaps that will be presented in terms of execution times. We consider this aspect next.
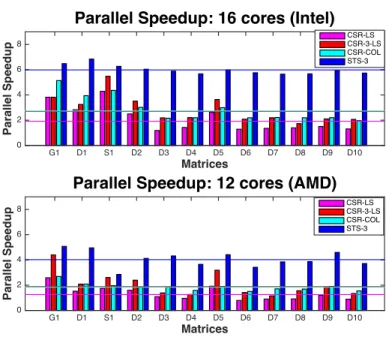
Let T (mat, method, q) indicate the execution time for a matrix mat, with q cores, and method as one of STS-3, CSR-3-LS, CSR-LS and CSR-COL. To compare across both coloring and level-set orderings, we use CSR-LS as the reference method relative to which we report performance measures. We define parallel speedup for a specific method and matrix mat on q cores as:
T (mat, CSR-LS, 1)
T (mat, method, q).
The parallel speedup factors are shown in Figure 9 for 16 cores on Intel and 12 cores on AMD processors; geometric means are shown as horizontal lines. Key observations include the following:
• STS-k or equivalently CSR-3-COL is readily the best with a factor 6 (Intel) and 4 (AMD) improvement relative to the reference CSR-LS implemen-tation. CSR-COL which also uses coloring is next in rank for Intel and CSR-3-LS is next in rank for AMD. However, there is a big gap in per-formance of CSR-3-COL and CSR-COL which is not apparent from the data in Figures 7 and 8. The fact that STS-k outperforms CSR-COL significantly is largely a consequence of the k-level subs-structuring and its effect in decreasing data access latencies.
• Interestingly, despite the very large gap in the levels of parallelism between CSR-COL and CSR-3-LS as shown in Figures 7 and 8, their parallel speed-up values are very close, with mean values of approximately 2.85 (Intel) and 1.8 (AMD) relative to the reference CSR-LS implementation. This is largely a result of the effect of the k-level sub-structuring that we have proposed which reduces the latencies of data access times.
4.3
Performance: Evaluating Incremental Impacts from
k-Level Sub-Structuring
We now seek to evaluate the incremental impacts on parallel performance solely from the k-level sub-structuring in STS-k. We focus on the performance of CSR-3-COL relative to CSR-COL and CSR-3-LS relative to CSR-LS. We define relative speedup for coloring orderings as:
relative speedup(coloring) = T (mat, CSR-COL, q)
T (mat, STS-3, q) ,
The relative speedup for level-set orderings is defined as:
relative speedup(level-set) = T (mat, CSR-LS, q)
T (mat, CSR-3-LS, q).
A value greater than 1 of relative speedup indicates the factor by which the k-level scheme outperforms the reference method. Figure 10 indicates that our k-level sub-structuring is indeed beneficial on 16 cores of Intel with a factor of 2.2 and on 12 cores of AMD with a factor of 2.19 improvement on average over all matrices when applied with coloring. Similarly, Figure 11 shows that our k-level sub-structuring is beneficial with level-set ordering, with a factor of 1.4 and 1.5 improvement on average on Intel and AMD respectively.
We next consider the relative speedup measured using the total time over all the matrices in the test suite. We denote the sum of execution time over all matrices for a method on q core as T (∗, method, q), where q ranging from 1-32 on Intel and 1-24 on AMD. Using total execution time, relative speedup for coloring is defined as:
T (∗, CSR-COL, q)
T (∗, STS-3, q) ,
and relative speedup for level-set ordering is defined as: T (∗, CSR-LS, q)
T (∗, CSR-3-LS, q).
Figures 12 and 13 show the factors by which our k-level structuring scheme outperforms the reference methods on all the core counts and over the whole test suite. We observe that k-level structuring outperforms by a factor of 2 with coloring and a factor of 1.4 for level-set on 8 − 32 cores of Intel. The k-level structuring also outperforms by a factor of 2.2 with coloring and 1.5 with level-set on 6 − 24 cores of AMD. These results show that our k-level sub-structuring is indeed very effective and can reduce execution times by one-third to one-half.
4.4
Effects of Enhanced Levels of Locality on Execution
Times of Largest Pack with Coloring
Our findings thus far confirm the superiority of coloring over level-set orderings and demonstrate substantial performance gains from the k-level sub-structuring. In particular, we would like to assess to what extent the latter contribute towards enhanced levels of spatial and temporal locality in processing a pack. To measure this we will need to remove other factors such as synchronization costs between packs that can be significant as observed by Wolf et. al [12]. Additionally, we need to account for the fact that there is not a one-to-one correspondence between packs for a given matrix with CSR-COL and CSR-3-COL.
Let t(method, q) denote the execution time for the largest pack P ∗ for a given method on q cores scaled by its number of unknowns (solution components). We define the parallel speedup per unknown as the ratio:
t(CSR-COL, q)
The parallel speedup per unknown on 16 cores of Intel and 12 cores of AMD is shown in Figure 14. Observe that on average, this measure is high at 1.75 on Intel and 2.12 on AMD across all the matrices in the test suite. Thus the performance gain of STS-k is due to our STS-k formulation.
5
Conclusions
We have developed a multilevel sub-structured formulation of sparse triangular solution to increase locality of data accesses and thus reduce effective access latencies in NUMA multicores. Our data affinity and reuse graph model of the underlying computations informs how packs of independent tasks may be scheduled for enhanced levels of reuse from temporal locality of accesses. The observed performance gains are both promising and significant.
We plan to consider more complex NUMA systems where STS-k with values of k greater than 3 may be appropriate. Such formulations could potentially be obtained through further groupings of super-rows based on dependencies before coloring orderings are applied or after they are applied to define tasks in terms of collections of super-rows.
We expect to study the problem of NUMA-aware schedules when data affin-ity and reuse graphs are constructed to span more than one pack. While optimal versions will likely be NP-complete, heuristic approaches and special cases of graphs can inform alternate sub-structuring schemes that could reduce synchro-nization overheads and increase locality.
Current trends in microprocessor architecture indicate increasing core counts with complex NUMA hierarchies. These NUMA effects are expected to become more pronounced when network-on-chip (NoC) architectures are considered. In this context, we see potential for further performance benefits through schemes for parallel sparse computations such as the ones we have developed, with mul-tiple levels of sub-structuring for enhancing locality of accesses and the explicit consideration of data reuse for the scheduling of tasks.
References
[1] E. Cuthill and J. McKee. Reducing the bandwidth of sparse symmetric matrices. In Proceedings of the 1969 24th national conference, ACM ’69, pages 157–172, New York, NY, USA, 1969. ACM.
[2] T. A. Davis. University of Florida Sparse Matrix Collection. NA Digest, 92, 1994.
[3] M. R. Garey and D. S. Johnson. Computers and Intractability, A Guide to the Theory of NP-Completeness. W.H. Freeman and Co, 1979.
[4] H. Kabir, J. Booth, and P. Raghavan. A multilevel compressed sparse row format for efficient sparse computations on multicore processors. In High
Performance Computing (HiPC), 2014 21st International Conference on, pages 1–10, Dec 2014.
[5] D. Molka, D. Hackenberg, R. Schone, and M. S. Muller. Memory Perfor-mance and Cache Coherency Effects on an Intel Nehalem Multiprocessor System. In Proceedings of the 2009 18th International Conference on Par-allel Architectures and Compilation Techniques, PACT ’09, pages 261–270, Washington, DC, USA, 2009. IEEE Computer Society.
[6] M. Naumov. Incomplete-LU and Cholesky Preconditioned Iterative Meth-ods Using cuSPARSE and cuBLAS. Technical report, Nvidia, 2011. [7] NERSC. Hopper at NERSC,
https://www.nersc.gov/users/computational-systems/hopper.
[8] J. H. Saltz. Aggregation methods for solving sparse triangular systems on multiprocessors. SIAM J. Sci. Stat. Comput., 11(1):123–144, Jan. 1990. [9] R. Schreiber and W. P. Tang. Vectorizing the conjugate gradient method.
Symposium on CYBER 205 Applications, 1982.
[10] J. G. Siek, L.-Q. Lee, and A. Lumsdaine. The Boost Graph Library: User Guide and Reference Manual (C++ In-Depth Series). Addison-Wesley Pro-fessional, 2001.
[11] B. Suchoski, C. Severn, M. Shantharam, and P. Raghavan. Adapting Sparse Triangular Solution to GPUs. In Proceedings of the 2012 41st International Conference on Parallel Processing Workshops, ICPPW ’12, pages 140–148, Washington, DC, USA, 2012. IEEE Computer Society.
[12] M. M. Wolf, M. A. Heroux, and E. G. Boman. Factors impacting per-formance of multithreaded sparse triangular solve. In Proceedings of the 9th International Conference on High Performance Computing for Com-putational Science, VECPAR’10, pages 32–44, Berlin, Heidelberg, 2011. Springer-Verlag.
0 5 10 15 20 25 0 5 10 15 20 25 nz = 153 0 5 10 15 20 25 0 5 10 15 20 25 nz = 153
Figure 6: L is shown with coloring (top) and STS-k (bottom); the two biggest packs are are enclosed in boxes along the diagonal. Observe the sub-structures that are revealed in STS-k that correspond to reuse of solution components among tasks in each pack.
Solution Components per Pack 214 216 218 220 222 224 226 228 230 232 Number of Packs 20 22 24 26 28 210 212 214 Degree of Parallelism CSR-LS CSR-3-LS CSR-COL STS-3
Figure 7: Each point represents observed values of the two measures of paral-lelism, the number of packs and the umber of solution components per pack, for one of four methods on a matrix. Observe that across all matrices in the test suite, clusters for level-set (with the pair CSR-LS and CSR-3-LS) and coloring with the pair (CSR-COL and CSR-3-COL) are very well separated. Further, their centroids clearly show coloring to be vastly superior (note the log scale).
G1 D1 S1 D2 D3 D4 D5 D6 D7 D8 D9 D10 0 20 40 60 80 100 120
Matrices
% of Total in 5 Largest Packs
Parallel Work (% of Total)
CSR−LS CSR−3−LS CSR−COL STS−3
Figure 8: The percentage of total work in the 5 largest packs with mean value shown as lines. Observe that CSR-COL and STS-3 (CSR-3-COL) in the largest 5 packs contain over 90% of total work, where as in CSR-3-LS and CSR-LS the largest 5 packs contain less than 5% of total work.
Matrices G1 D1 S1 D2 D3 D4 D5 D6 D7 D8 D9 D10 Parallel Speedup 0 2 4 6 8
Parallel Speedup: 16 cores (Intel)
CSR-LS CSR-3-LS CSR-COL STS-3 Matrices G1 D1 S1 D2 D3 D4 D5 D6 D7 D8 D9 D10 Parallel Speedup 0 2 4 6 8
Parallel Speedup: 12 cores (AMD)
CSR-LS CSR-3-LS CSR-COL STS-3
Figure 9: Parallel speedup of STS-3, CSR-COL and CSR-3-LS compared to CSR-LS on 16 cores Intel (top) and 12 cores AMD (bottom). The horizontal lines show the mean speed up for the entire test suite.
Matrices G1 D1 S1 D2 D3 D4 D5 D6 D7 D8 D9 D10 Relative Speedup 0 0.5 1 1.5 2 2.5
3
Relative Speedup (Color): 16 cores (Intel)
CSR-COL STS-3 Matrices G1 D1 S1 D2 D3 D4 D5 D6 D7 D8 D9 D10 Relative Speedup 0 0.5 1 1.5 2 2.5
3
Relative Speedup (Color): 12 cores (AMD)
CSR-COL STS-3
Figure 10: Relative speedup of STS-3 compared to coloring on Intel (top) and AMD (bottom). The horizontal line shows the mean speedup of STS-3.
Matrices G1 D1 S1 D2 D3 D4 D5 D6 D7 D8 D9 D10 Relative Speedup 0 0.5 1 1.5
2
Relative Speedup (LS): 16 cores (Intel)
CSR-LS CSR-3-LS Matrices G1 D1 S1 D2 D3 D4 D5 D6 D7 D8 D9 D10 Relative Speedup 0 0.5 1 1.5
2
Relative Speedup (LS): 12 cores (AMD)
CSR-LS CSR-3-LS
Figure 11: Relative speedup of CSR-3-LS compared to CSR-LS on Intel (top) and on AMD (bottom). The horizontal line shows the mean speedup of CSR-3-LS.
Cores 1 2 4 8 16 24 32 Relative Speedup 0 0.5 1 1.5 2
2.5 Relative Speedup - Color (Intel)
CSR-COL STS-3 Cores 1 2 4 6 12 18 24 Relative Speedup 0 0.5 1 1.5 2
2.5 Relative Speedup - Color (AMD)
CSR-COL STS-3
Figure 12: Relative speedup of STS-3 compared to CSR-COL for the whole test suite on 1-32 cores of Intel (top) and 1-24 cores of AMD (bottom). The horizontal line shows mean value for 8-32 cores (Intel) and 6-24 cores (AMD).
Cores 1 2 4 8 16 24 32 Relative Speedup 0 0.5 1 1.5
2 Relative Speedup - LS (Intel)
CSR-LS CSR-3-LS Cores 1 2 4 6 12 18 24 Relative Speedup 0 0.5 1 1.5
2 Relative Speedup - LS (AMD)
CSR-LS CSR-3-LS
Figure 13: Relative speedup of CSR-3-LS compared to CSR-LS for the whole test suite on 1-32 cores of Intel (top) and 1-24 cores of AMD (bottom). The horizontal line shows the mean value for 8-32 cores (Intel) and 6-24 cores (AMD).
Matrices G1 D1 S1 D2 D3 D4 D5 D6 D7 D8 D9 D10 Relative Speedup 0 0.5 1 1.5 2 2.5
3
Relative Speedup per Unknown (Intel)
CSR-COL STS-3 Matrices G1 D1 S1 D2 D3 D4 D5 D6 D7 D8 D9 D10 Relative Speedup 0 0.5 1 1.5 2 2.5
3
Relative Speedup per Unknown (AMD)
CSR-COL STS-3
Figure 14: Relative speedup of STS-3 compared to CSR-COL for processing one solution component on Intel (top) and on AMD (bottom). The horizontal line shows the mean value of STS-3.