HAL Id: hal-01833211
https://hal-univ-rennes1.archives-ouvertes.fr/hal-01833211v2
Submitted on 11 Sep 2018
HAL is a multi-disciplinary open access archive for the deposit and dissemination of sci-entific research documents, whether they are pub-lished or not. The documents may come from teaching and research institutions in France or abroad, or from public or private research centers.
L’archive ouverte pluridisciplinaire HAL, est destinée au dépôt et à la diffusion de documents scientifiques de niveau recherche, publiés ou non, émanant des établissements d’enseignement et de recherche français ou étrangers, des laboratoires publics ou privés.
Jean-Michel Hartmann, Ha Tran, Raymond Armante, Christian Boulet, Alain
Campargue, Francois Forget, Livio Gianfrani, Iouli Gordon, Sandrine Guerlet,
Magnus Gustafsson, et al.
To cite this version:
Jean-Michel Hartmann, Ha Tran, Raymond Armante, Christian Boulet, Alain Campargue, et al.. Re-cent advances in collisional effects on spectra of molecular gases and their practical consequences. Journal of Quantitative Spectroscopy and Radiative Transfer, Elsevier, 2018, 213, pp.178-227. �10.1016/j.jqsrt.2018.03.016�. �hal-01833211v2�
ACCEPTED MANUSCRIPT
Highlights
A review on the progress made in the last decade on pressure effects on absorption shapes
High accuracy measurement techniques
Theories, models and available data for the absorption shapes
Consequences for remote sensing, metrology and heat transfer applications
ACCEPTED MANUSCRIPT
Recent advances in collisional effects on spectra of molecular gases
and their practical consequences
Jean-Michel Hartmanna,#, Ha Tranb, Raymond Armantea, Christian Bouletc, Alain Campargued, François Forgetb, Livio Gianfranie, Iouli Gordonf, Sandrine Guerletb,
Magnus Gustafssong, Joseph T. Hodgesh, Samir Kassid, Daniel Lisaki, Franck Thibaultj, Geoffrey C. Toonk
a
Laboratoire de Météorologie Dynamique/IPSL, CNRS, École polytechnique, Sorbonne Université, École normale supérieure, PSL Research University, F-91120 Palaiseau, France.
#
Corresponding author: jean-michel.hartmann@lmd.polytechnique.fr b
Laboratoire de Météorologie Dynamique/IPSL, CNRS, Sorbonne Université, École normale supérieure, PSL Research University, École polytechnique, F-75005 Paris, France. c
Institut des Sciences Moléculaires d’Orsay, CNRS, Université Paris-Sud, Université Paris-Saclay, Orsay F-91405, France.
d
Univ. Grenoble Alpes, CNRS, LIPhy, 38000 Grenoble, France. e
Dipartimento di Matematica e Fisica, Università degli Studi della Campania "Luigi Vanvitelli" Viale Lincoln 5, 81100 Caserta, Italy
f
Harvard-Smithsonian Center for Astrophysics, Atomic and Molecular Physics Division, Cambridge, MA 02138, USA.
g
Department of Engineering Sciences and Mathematics, Luleå University of Technology, SE-97187 Luleå, Sweden.
h
National Institute of Standards and Technology, 100 Bureau Drive, Gaithersburg, MD 20899, USA. i
Institute of Physics, Faculty of Physics, Astronomy and Informatics, Nicolaus Copernicus University, Grudziadzka 5, 87-100 Torun, Poland.
j
Institut de Physique de Rennes, UMR CNRS 6251, Université de Rennes 1, Campus de Beaulieu, Bât.11B, F-35042 Rennes, France.
k
Jet Propulsion Laboratory, California Institute of Technology, Pasadena, California, USA.
ABSTRACT
We review progress, since publication of the book "Collisional effects on molecular
spectra: Laboratory experiments and models, consequences for applications" (Elsevier,
Amsterdam, 2008), on measuring, modeling and predicting the influence of pressure (ie of intermolecular collisions) on the spectra of gas molecules. We first introduce recently developed experimental techniques of high accuracy and sensitivity. We then complement the above mentioned book by presenting the theoretical approaches, results and data proposed (mostly) in the last decade on the topics of isolated line shapes, line-broadening and -shifting, line-mixing, the far wings and associated continua, and collision-induced absorption. Examples of recently demonstrated consequences of the progress in the description of spectral shapes for some practical applications (metrology, probing of gas media, climate predictions) are then given. Remaining issues and directions for future research are finally discussed.
Key words: pressure effects on spectral shapes; experimental techniques; theories and
ACCEPTED MANUSCRIPT
Table of contents
List of acronyms 1. Introduction
2. Laboratory experimental techniques
2.1 Introduction
2.2 Cavity Enhanced Absorption Spectroscopy (CEAS) 2.3 Cavity Ring-Down Spectroscopy (CRDS)
2.4 Frequency-comb assisted methods
2.5 Cavity mode-width and mode-dispersion spectroscopies 2.6 Direct frequency-comb spectroscopy
2.7 Cavity-enhanced direct frequency-comb spectroscopy 2.8 Dual-laser absorption spectroscopy
2.9 Fourier-transform spectroscopy (FTS) methods 2.10 Advances in coherent terahertz spectroscopy
3. Theories, models, results
3.1 Introduction and selection criteria 3.2 Isolated line shapes
3.2.1 Direct and empirically corrected predictions from Molecular Dynamics Simulations 3.2.2 Using a kinetic equation
3.2.2a The Keilson-Storer (KS) model for the velocity collision kernel 3.2.2b The billiard-ball (BB) approximation for the velocity collision kernel 3.2.2c Velocity collision kernel calculated from CMDS
3.2.3 Relativistic and dispersion correction to line-shape models
3.2.4 Phenomenological line-shape models
3.2.4a The Hartmann-Tran profile
3.2.4b Temperature dependence of the line-shape parameters 3.2.4c Quadratic versus hypergeometric speed dependences 3.2.4d Kochanov’s approach
3.3 Pressure-broadening and -shifting coefficients 3.3.1 Quantal approaches
3.3.2 Refined semi-classical Robert-Bonamy formalism 3.3.3 Fully classical approach
3.3.4 Some recent applications of the “usual” Robert-Bonamy formalism 3.4 Line-mixing
3.4.1 Requantized Classical Molecular Dynamics Simulations 3.4.2 Quantal approaches
3.4.3 Refined semi-classical Robert-Bonamy formalism 3.4.4 Fully classical formalism
3.4.5 Dynamically-based scaling laws
3.4.6 Energy-gap fitting laws and state-to-state cross sections 3.4.7 The ovoid sphere model
3.4.8 Kochanov’s approach
3.5 Far wings and associated continua
3.5.1 Direct predictions from Molecular Dynamics Simulations 3.5.2 Non Markovian Energy-Corrected Sudden approach 3.5.3 Asymptotic line shape and -factor empirical models 3.5.4 The MT_CKD water-vapor continuum
ACCEPTED MANUSCRIPT
3.6 Collision-induced absorption (CIA) 3.6.1 Quantum scattering advances 3.6.2 Intra-collisional interference effects 3.6.3 Standard binary-collision treatments
3.6.4 Direct predictions from Molecular Dynamics Simulations 3.6.5 Integrated CIA intensities
4. Available data
4.1 Isolated lines 4.2 Line-mixing
4.3 Far wings and associated continua 4.3.1 The water-vapor continua
4.3.1a The self-continuum 4.3.1b The foreign-continua
4.3.2 The CO2 far-wings continua
4.4 Collision-induced absorption 4.5 Spectroscopic databases 4.5.1 The HITRAN database
4.5.2 The GEISA database and 4A/OP code
5. Consequences for applications
5.1 Remote sensing
5.1.1 Probing atmospheres
5.1.1a The Earth 5.1.1b Other planets
5.1.2 Probing combustion gases 5.1.3 Probing confined gases 5.2 Metrology
5.2.1 Doppler thermometry 5.2.2 Amount of gas metrology
5.3 Radiative heat transfer and climate modeling 5.3.1 Heat transfer in "industrial" devices.
5.3.2 Modeling atmospheres observed in the solar system
5.3.3 New challenges: simulating exoplanets and ancient atmospheres.
6. Remaining issues and directions for future research
6.1 Experiments
6.2 Theories and models 6.3 Databases
Acknowledgements References list
ACCEPTED MANUSCRIPT
List of acronyms
Acronym Meaning
1D-CMDS One-Dimensional Cavity-Mode Dispersion Spectroscopy ACF Auto-Correlation Function
BB Billiard-Ball
BWO Backward Wave Oscillator
CAVIAR Continuum Absorption at Visible and Infrared wavelengths and its Atmospheric Relevance
CC Close-Coupling
CEAS Cavity Enhanced Absorption Spectroscopy CIA Collision-Induced Absorption
CMDS Classical Molecular Dynamics Simulations CMWS Cavity Mode-Width Spectroscopy
CRDS Cavity Ring-Down Spectroscopy CS Coupled-States
CW Continuous Wave
DBT Doppler Broadening Thermometry DCS Dual Comb Spectroscopy
DFBL Distributed Feed Back diode Laser ECDL External Cavity Diode Laser ECS Energy-Corrected Sudden EOM Electro-Optic phase Modulator FP Fabry-Pérot
FS-CRDS Frequency-Stabilized CRDS FSR Free Spectral Range
FTS Fourier Transform Spectrometer FWHM Full Width at Half Maximum GP Galatry Profile
HAPI HITRAN Application Programming Interface HC Hard Collision
HTP Hartmann-Tran Profile ICL Interband Cascade Laser IOS Infinite-Order Sudden KS Keilson-Storer
LM Line-Mixing
MT_CKD Mlawer-Tobin_Clough-Kneizys-Davies
NICE-OHMS
Noise-Immune Cavity-Enhanced Optical Heterodyne Molecular Spectroscopy
OFC Optical Frequency Combs
OF-CEAS Optical-Feedback Cavity-Enhanced Absorption Spectroscopy pCqSDHC partially-Correlated quadratic-Speed-Dependent Hard Collision QCL Quantum Cascade Laser
RB Robert-Bonamy RP Rautian Profile SC Soft Collision
SDBB Speed-Dependent Billiard-Ball SDVP Speed-Dependent Voigt Profile SI Système International d’Unités SNR Signal-to-Noise Ratio
ACCEPTED MANUSCRIPT
TCCON Total Carbon Column Observatory Network VIPA Virtually Imaged Phased Array
VMR Volume Mixing Ratio VP Voigt Profile
ACCEPTED MANUSCRIPT
1. Introduction
In 2008, some authors of this paper completed a book [1] devoted to the effects of pressure (of intermolecular collisions) on the spectra of gas molecules. They reviewed the processes involved, the available theories, models and experimental results, and discussed the consequences for some practical applications. Considerable qualitative and quantitative progress has been made on all aspects of this subject that are discussed in this book since its publication a decade ago. The aim of the present review is to give the reader an overall view of these advances together with an update of the bibliography on the subject, including recent techniques for measurements of light absorption by gases. This rapidly growing field has many relevant publications, here we review those that we are aware of and that demonstrate new progress in one or more aspects of the research.
The remainder of this article is organized as follows: Section 2 is devoted to laboratory experimental techniques, a topic not treated in [1]. While it focuses mainly on recent developments based on the use of lasers and often of high finesse cavities, which enable measured absorption spectra with unprecedented high SNRs and accuracies, Fourier transform and terahertz techniques are also discussed. The new spectral-shape theories and models, as well as recently made comparisons between calculated and measured results are the subjects of Sec. 3. In the latter, the profiles of isolated lines, the pressurebroadening and -shifting coefficients, line-mixing processes, the (far) line wings and continua, and collision-induced absorption are successively considered (following chapters III-VI of [1]). Some recently made available spectral-shape parameters in these fields are presented in Sec. 4 together with the evolutions and current statuses of spectroscopic databases. The effects of collisions on molecular spectra are important to many applications, as discussed in Chapt. VII of [1]. Section 5 is devoted to the impact of achievements on this topic in a variety of other fields. These include metrology, the probing of various media including atmospheres, and radiative transfer and climate. Remaining problems and possible directions for future research are finally discussed in Sec. 6.
2. Laboratory experimental techniques
2.1 Introduction
Molecular spectra reveal collisional effects through changes in their shapes recorded along a frequency axis. To properly test the most advanced theories and models it is mandatory to minimize experimental biases, at least below the expected precision of the predictions. In addition, some applications (Sec. 5) require extremely reliable simulations or analysis of spectra. These constraints call for accuracy in both the frequency and absorption axes, which are intimately linked by the spectral profile, as well as for the accurate determination of the composition, temperature and pressure of the sample gas (Sec. 5.2.2). As an example, consider a direct absorption experiment in which a laser probes a gas and the transmission is recorded. Any uncontrolled laser-intensity noise would obviously convert into an effective absorption noise, impairing the fast and precise determination of a line contour. To some extent, this may be corrected for by stabilizing the instantaneous laser power that irradiates the gas sample, for example by using an acousto-optic modulator in a servo configuration [2]. However, while such a method can lead to baseline relative intensity noise levels approaching 10-5, going below this degree of intensity stabilization is practically impossible. In addition, fluctuations in the optical frequency of the probe laser that occur on time scales shorter than the characteristic data-acquisition rate are known as “frequency-jitter” and are manifest as noise in acquired spectra, particularly in regions of steep absorption. Worse, if the laser source, or the measurement of its optical frequency, slowly drifts during an experiment, the absorption spectrum is irreversibly deformed. Nevertheless, probe-laser jitter
ACCEPTED MANUSCRIPT
can be substantially reduced by active stabilization methods that incorporate a reference oscillator. These remarks show that an optimized classical spectrometer for absorption measurements should use an optical source having low amplitude and frequency noises, with a stable emission frequency that must be accurately monitored and determined.
Nowadays, the most accurate and sensitive techniques for absorption measurements use CW lasers as the light source and resonant optical cavities surrounding the sample gas. When compared to classical incoherent sources and pulsed lasers, CW lasers provide relatively low intensity noise and narrow emission widths capable of probing individual cavity resonances (modes). Resonant optical cavities comprise two or more high-reflectivity dielectric mirrors that sustain standing-wave or traveling-wave intra-cavity fields. Using such a resonator to enclose the gas sample increases the sensitivity by enhancing the path length of the photons trapped inside the cavity. This enhancement increases with the mirror reflectivities, as explained later. Also, because of the relatively long photon lifetime () in the cavity and coherent nature of the excitation, these cavities are highly efficient frequency filters that can potentially overcome the effect of residual laser-frequency jitter. Indeed, the optical resonances manifest as a comb of sharp transmission features whose width ( and spacing (f) are typically in the ranges of kHz and 100 MHz, respectively. For instance, an optical
cavity comprising two mirrors of reflectivity R=0.99999 separated by 1 m, corresponds to= 333s= 477Hz and an effective path length of 100 km. This example illustrates the long photon lifetime, narrow mode width and extensive path length achievable with laboratory-scale high-finesse cavities.
Optical cavities are most commonly used to interrogate molecular absorption in two different ways. One can measure either the steady-state transmission of incident light through the cavity or the photon lifetime, both of which are sensitive to light absorption by the cavity medium. In both cases, the highest spectral resolution is achieved using mode-by-mode cavity excitation to yield spectra sampled at well-defined frequency intervals. The first approach leads to cavity-enhanced absorption spectroscopy (CEAS, Sec. 2.2) and the second to cavity ring-down spectroscopy (CRDS, Sec. 2.3). Importantly, unlike CEAS, CRDS is immune to intensity noise in the light source and to absorption outside the cavity. There are advanced versions of CRDS in which the resonant frequencies are made immune to laser-frequency drift and/or external perturbations via active cavity or laser stabilization methods. These include the frequency-stabilized CRDS (FS-CRDS) technique [3,4] and optical feedback frequency-stabilized CRDS (OFFS-CRDS) [5,6]. Both approaches are insensitive to laser-intensity and -frequency noises, and are based on precise and accurate observations of mode-frequency intervals (x-axis) and time (y-axis). They can provide line profiles with minimal instrumental distortion and SNRs routinely ranging from 103 to 2×10⁴ [7-10] with exceptional cases in the 2×10⁵ to 106 range [5,11,12]. Other cavity-enhanced methods include (Sec. 2.5) cavity mode-width spectroscopy (CMWS) which measures absorption-dependent widths of individual cavity resonances, and one-dimensional cavity-mode dispersion spectroscopy (1D-CMDS) [13] which measures frequency shifts of the cavity resonances to quantify gas-induced dispersion. We note that CMWS is a high-resolution variant of CEAS that uses the mode width instead of the amplitude decrease to measure absorption and thus overcomes the need for spectrally broadband intensity normalization. The 1D-CMDS also shares this property and yields spectra where both axes are based upon measurements of the optical frequency.
Interestingly, optical cavities also can be simultaneously probed at several wavelengths in a multiplexed manner. For this, femto-second laser sources or electro-optic modulated CW lasers that consist of combs of phase-locked narrow emitters [14] can be efficiently coupled to an optical cavity. This can be achieved in a raw (cavity-enhanced optical frequency comb spectroscopy) [15-19], one-by-one (Vernier effect) [20,21], or in self- or multi-heterodyne
ACCEPTED MANUSCRIPT
configurations [22] to yield both field amplitude and phase information quantifying complex-valued line shapes.
In the remainder of Sec. 2.1 we provide a general description of light-matter interaction in an enhancement cavity. For simplicity, we consider a FP interferometer having two identical dielectric (absorption-free) mirrors with reflectivity R, and transmission T such that
R=1-T. Neglecting intracavity-medium scattering or other losses, considering a single
transverse mode and in the limit of a linear absorption process, the complex-valued transmittance y( ) of the incident field at frequency is given by the Airy formula:
e exp ( i ) / 2 ( ) 1 exp( i ) T l y R , (1)where all variables (except for l) on the right-hand-side depend upon . is the intensity-based absorption coefficient, is the resonator length, 2 tr is the phase shift corresponding to the round-trip time tr 2 /l c (with c the speed of light), and
e R exp( )
R l is the effective mirror reflectivity that incorporates the single-pass absorption loss of the medium. The resonant frequencies occur when is a multiple of 2 In the absence of absorption and dispersion effects, the modulus squared of the Airy formula reduces to a comb of equidistant peaks of unity transmission separated by the free spectral range (FSR) denoted by f . Absorption reduces the peak transmission and broadens the resonances, whereas dispersion in the medium shifts the positions of the resonances relative to the empty-cavity case (cf Sec. 2.5).
With the incorporation of models for absorption and dispersion, the preceding formulas can be used to calculate the cavity transmission (amplitude and phase) by summing over all relevant electromagnetic field components at one or more frequencies. Both heterodyne and intensity-based transmission measurements can be modeled. In the former case, the field transmitted by the cavity is combined with that of a local oscillator (generally either a single- or multi-frequency laser such as an OFC), which results in a complex-valued transmission signal at one or more heterodyne beat frequencies. Similarly, for intensity-based measurements at a given frequency, the real-valued transmission is obtained by squaring the modulus of Eq. (1).
Note that the complex Airy formula, which is a comb-like function of representing a series of resonances, can be reduced to a complex Lorentzian profile near an individual resonance. This is a good approximation when the cavity finesse F, given by Re / (1Re), is large and when 1. In this limit, we can write the complex field transmission for excitation of a single cavity mode as:
e exp( i / 2) ( ) 1 1 i( / ) T y R F , (2)
where (2 ) / f and is the frequency detuning of the light source about the local resonance. Furthermore, for measurements of photon lifetime of the resonator (eg, CRDS, Sec. 2.3), the time-dependent ring-down decay signal s(t) is found by squaring the modulus of the Fourier transform of Eq. (2) which gives:
0
s( )t s exp( t/ ) , (3) with a frequency-dependent time constant
( ) 1 exp( ) l c R l . (4) lACCEPTED MANUSCRIPT
These results illustrate the simple correspondence between the frequency- and time-domain responses for excitation of a single cavity mode. Assuming high mirror reflectivity (R~1) and weak intra-cavity absorption ( l 1), Eq. (4) reduces to1/ [ ( )]c ( ) 1/ [c 0( )], where 0( ) l/ [ (1c R)] is the time constant in the absence of absorption. This relation indicates that the x and y axes of CRDS absorption spectra can be determined from measurements of frequency and time, respectively, without explicit determination of path length. The power transmitted by the cavity, Pt() as detected by a photodiode placed after the
resonator and assuming perfect mode matching, is given by the square of the modulus of Eq. (1). Assuming on-resonant excitation (= 0), one has:
2 t( ) 0 2exp( ) 1 exp( ) T P P l R l , (5)where all variables on the right-hand-side depend upon and P0 is the incident power. For
high mirror reflectivity and weak intra-cavity absorption, Eq. (5) can be expanded to first order in l, leading to:
eff 0 ( ) (1 ) t P l P , (6) with eff 2 /(1 ) l l R . (7)
Eq. (7) explicitly highlights the path length enhancement induced by the resonant cavity as mirror reflectivity and cavity finesse increase. This enhancement effect is referred to in the cavity-enhanced absorption spectroscopy (CEAS, Sec. 2.2) acronym.
Although the first mention of the use of a FP assembly to enhance intra-cavity absorption is by Jackson [23], O'Keefe and Deacon [24] were the first to use CRDS (cf Sec. 2.3) to measure molecular absorption spectra. In general, the reader may refer to Chapt. 1 of [25] for a deeper understanding of the CEAS process and to [26] for CRDS.
Except for Secs. 2.9 and 2.10, the next sub-sections describe recent experimental efforts toward accurate spectroscopy, essentially disregarding low-resolution or large-apparatus-function setups. We consider CW laser-based techniques with cavities to enhance sensitivity and/or resolution, which measure the cavity transmission (Sec. 2.2), the lifetime of photons trapped in the cavity (Sec. 2.3) or the cavity mode width (Sec. 2.5). The referencing of probe laser frequencies to an OFC for absolute calibration is also presented (Sec. 2.4). Laser-comb sources, which can be used with (Sec. 2.7) or without an enhancement cavity (Sec. 2.6), offering broadband coverage and/or multiplexed approaches also are discussed. Then, we evaluate (Sec. 2.8) the performance of dual-laser direct-absorption methods for high-precision line shape studies. Finally, the interests of Fourier transform spectroscopy and terahertz techniques for spectral-shape studies are discussed in Secs. 2.9 and 2.10, respectively.
Before discussing these various techniques, it is important to recall that obtaining spectra of very high quality is not the only criterion for accurate spectroscopic studies of pressure effects. Indeed, the reliability of the tests of theories and models as well as that of the spectral-shape parameters retrieved from fits of measurements also depend on the knowledge of the sample (composition, pressure, temperature, path length). Obviously, uncertainties on these experimental parameters can spoil many of the efforts made to improve the set-up and the quality of the data that it produces. While this rather technical and difficult issue is beyond the scope of this review, some discussions concerning the determination of the temperature can be found in some of the references cited in Sec. 5.2.1, the importance of knowing the gas composition being addressed in Sec. 5.2.2.
ACCEPTED MANUSCRIPT
An intuitive way to take advantage of the absorption-enhancement effect of a FP cavity consists in monitoring the frequency dependence of its on-resonance transmission as expressed in Eq. (5). This provides (within the limit of weak absorption) direct access to the absorption coefficient through a Beer-Lambert-like law that exhibits an enhanced path length [Eq. (7)]. Note that, for studies of narrow absorption lines and accurate determinations of their areas, the base length l and mirror properties must be accurately known because they govern the mode spacing and effective path length. Actually, the FP cavity length differs from a basic ruler-based measurement according to Gaussian mode theory [27,28] and may be determined from measurements of the local FSR (cf Sec. 2.5). The mirror reflectivity can be determined from a CRDS measurement (Sec. 2.3) or by a cavity-mode width measurement (cf Sec. 2.5). To address the problem of measuring absorption continua (Sec. 4.3), the mirror- and gas-dependent losses must also be independently characterized. Let us emphasize that the cavity mirrors’ properties are generally frequency dependent because of the present coating technology (dielectric films), but also because of the refractive nature of the intra-cavity probed medium. From [29], the magnitude of the absorption-induced mode shift is 0.3c(). Referring again to a one-meter long FP cavity with 99.999 % reflectivity mirrors (Sec. 2.1), a local absorption coefficient of 3.4×10⁻⁷cm-1 is sufficient to shift an FP resonance by its mode width. Furthermore, at wavelength of 1.6 µm for instance, a 1 nm variation of the cavity length (10-9 relative) shifts all the FP resonances by about 200 kHz, which is more than 100 times the mode width. The use of high reflectivity mirrors therefore requires stable FP assemblies. On the other hand, typical tunable semiconductor lasers (eg telecommunications type) have line widths of the order of 1 MHz (jitter), obviously leading to extremely noisy cavity transmission under CW excitation. However, the optical cavity and laser noise sources are of different physical origin and act on different time scales. An optical cavity, as any mechanical assembly, exhibits a slow thermo-mechanical expansion (~1s scale) that sums with acoustic noise (<20 kHz) yielding time constants ranging from s to ms timescales, respectively. This makes it rather easy to control the cavity length, typically with piezoelectric transducers. Telecommunications semiconductor lasers typically exhibit white noise that extends over several MHz, making it difficult, but possible [30-32], to actively cancel the frequency noise on time scales comparable to the buildup time of the optical cavity. Note that external cavity diode lasers (ECDL) have narrower short-term line widths (< 500 kHz) than semiconductor lasers and are therefore better suited for electronic control loops that directly actuate laser current [33].
Several strategies have been developed to overcome highly intermittent laser-to-cavity-longitudinal mode overlap which occurs when the probe laser frequency and cavity resonance are not coupled. These methods include: (i) averaging a series of passages through resonance to reduce the intensity noise, known as Integrated Cavity Output Spectroscopy (ICOS) [34]. (ii) Off-axis injection of a FP cavity (OA-ICOS) [35] to induce the excitation of a series of higher-order transverse modes having various resonant frequencies. With an appropriate FP geometry, this results in quasi-continuous transmission, smoothing out the peaks of the Airy formula. Unfortunately, these two strategies are still limited in terms of SNR, essentially because of residual optical fringes, transverse-mode-dependent mirror losses and laser phase noise which manifests itself as fluctuations in the transmitted power. They are, therefore, not recommended for accurate line-profile determinations. (iii) Electronic or optical locking of the laser emission of an ECDL to a stable FP or other frequency reference is an efficient CEAS approach for accurate line-profile determination (Sec. 2.5). Several methods can serve this purpose, eg: PDH [36], tilt-lock [37] and NICE-OHMS [38]. An alternative attractive method consists in optical-feedback locking (OF-CEAS) [39]. Under certain conditions, the laser self-locks to the mode of the FP to which it is injected and remains locked even if one tries to detune it. This behavior results from counter-propagating cavity photons that seed the
ACCEPTED MANUSCRIPT
laser with the proper optical phase. Such a condition is achieved by precise control of the laser-to-FP distance, which typically requires a piezoelectrically actuated steering mirror and simple electronics. A drastic reduction of the laser emission line width occurs, well below the FP mode width, leading to near-perfect mode injections and allowing the laser frequency to be hopped over successive longitudinal modes of the FP. This technique can be applied to virtually any single-frequency semiconductor laser including DFBLs [40], ECDLs [41], QCLs [42] and ICLs [43].
For CEAS, the lowest limit of detection (1×10-14 cm-1 for 1 s of averaging) was obtained using the NICE-OHMS method [38]. It was calculated from the noise level observed in a 1 MHz-wide saturation-dip structure having a peak absorbance of 4×10⁻⁹ and SNR equal 7700. For a broadband OF-CEAS spectrum spanning 30 GHz, 8×10-11 cm-1 was obtained based on the noise in the spectrum baseline [44].
2.3 Cavity Ring-Down Spectroscopy (CRDS)
In CRDS, the ring-down events [Eq. (3)] are insensitive to laser intensity fluctuation, enabling extremely high SNR spectra [6,11,12] and low detection limits [45] to be attained. However, laser jitter and/or cavity length fluctuation impair precise laser frequency determination and photon coupling into the cavity. The former affects the frequency axis, while the latter limits the data throughput and sets the ultimate reachable sensitivity, governed by photon shot noise. Consequently, the implementation of frequency locking mechanisms is mandatory for the acquisition of high fidelity absorption profiles. The first CRDS effort (with CW probe lasers) towards this goal involved a dual-laser scheme [3]. The length of the CRDS cell was actively locked to a frequency-stabilized reference laser, while a probe laser was brought into resonance, mode by mode, resulting in spectra having a precise optical detuning axis. This technique, called Frequency-Stabilized CRDS (FS-CRDS) was used in many line-shape studies (eg [4,8,12,46]) and had sufficient spectral resolution to reveal MHz-wide saturation dips [46]. The acquisition rate of ring-down events was greatly improved by locking the laser to the cavity with PDH frequency locking schemes [47-50]. This approach was refined [51] using a dual-polarization configuration and EOM-based frequency shifting, leading to robust locking of the probe laser to the ring-down cavity with a 130 Hz relative line width, 5 kHz-level ring-down acquisition rates, minimal dead-time between cavity mode excitations and decay-time measurement precision better than 1 part in 104. Alternatively, a dual-cavity approach was used [5] which transferred the stability of a reference cavity to the ring-down cavity. First, the source laser was locked to individual modes of the reference cavity by optical feedback [39], with capability for mode by mode scanning. This step stabilizes the probe laser frequency and renders its bandwidth narrow by comparison to that of the ring-down cavity mode. Second, continuous optical tuning is realized up to 20 GHz using a single-sideband optical modulator, transforming the stabilized single-frequency light source into an arbitrarily tunable probe laser [52]. Third, the ring-down cavity is locked to the probe laser allowing CRDS spectra to be acquired with fully adjustable resolution and high SNR. This approach has been used for applications to line metrology [5,6,53] and more recently to
17
O isotopic ratio measurements in CO2 [54]. Here, 17Oln(17O+1)Rln(18O+1)R,
where 17Oand 18 are the usual "" values for relative isotopic abundance and R is the slope of a reference line R, which is used to quantify non-mass-dependent isotopic anomalies from an assumed mass-dependent fractionation law. An unprecedented precision of 10 parts-per-million for 17O was demonstrated [54].
The quality of the spectra retrieved by CRDS makes active frequency stabilization techniques perfectly adapted for ultra-precise line-shape recordings of weakly absorbing lines
ACCEPTED MANUSCRIPT
with SNRs as high as 106 [5,11,12]. In all these studies, the source laser optical frequency was measured against or locked to one tooth of an OFC for an absolute frequency determination as explained in the next section.
2.4 Frequency-comb assisted methods
The highly coherent and broadband nature of OFCs makes these devices appealing as light sources for high resolution spectroscopic experiments that require rapid and wide spectral coverage with a well-defined frequency axis (cf Secs. 2.6 and 2.7). Typically, the OFC repetition rate and carrier-envelope offset frequency are stabilized relative to an absolute frequency standard (eg, Rb or Cs clock), thus providing a comb of known laser frequencies with stabilities at the sub-kHz level. However, unlike the extremely high stability of OFC frequencies, the intensity can vary substantially with time and from tooth-to-tooth, thus driving the limit of detection and often resulting in highly structured spectral baselines that alter the observed line shape. These effects can be reduced (but not completely eliminated) by signal averaging and intensity normalization.
Another important use consists in referencing a probe laser to one tooth of a frequency-stabilized OFC. An early example includes CRDS line-shape measurements of the S(0) and S(1) transitions of deuterium near 3 m, where a Cs-clock-referenced OFC was used to provide absolute frequencies of the pump and signal beams in a difference-frequency generation probe laser [55]. These experiments yielded line positions and intensities with relative uncertainties of 6x10⁻⁸ and 1 %, respectively. In several other line shape experiments [7,30,53,54,56-59], the OFC was used as an optical frequency reference for a single-frequency probe laser or for measuring the mode spacing of an optical resonator [60]. The OFC-assisted technique yields a much more accurate and precise (< 100 kHz) frequency axis than conventional techniques using a wavelength meter (> 1 MHz precision). Thus, this approach is especially attractive for measurements of absolute line positions and pressure-shifting coefficients with levels of performance that are substantially improved by comparison to those achieved with traditional FTS instruments.
Another possibility consists in locking the probe laser to a tooth of the OFC that is slowly tuned by changing its repetition rate [30,61-63], for instance.
2.5 Cavity mode-width and mode-dispersion spectroscopies
Progress in phase-locking CW lasers to high-finesse cavities has recently enabled the development of cavity-enhanced spectroscopic techniques based on high-precision measurements of the cavity mode widths and positions. As derived above, the exponentially decaying intensity measured in CRDS [Eqs. (3),(4)] is the time-domain equivalent of the cavity-mode width measured under CW excitation in the frequency domain, see Fig. 1. Specifically, the FWHM of a Lorentzian FP mode is given by (2)-1. This property is exploited in CMWS [64-66] where the absorption spectrum is retrieved from the widths of the cavity modes measured in transmission. Because the spectral interval probed is so narrow, this measurement is also relatively insensitive to the frequency-dependence of the probe laser intensity. The properties of CMWS make it complementary to CRDS (Sec. 2.3) in terms of achievable accuracies at various levels of intra-cavity absorption. For low absorption, where the ring-down time is long and the modes are narrow, a higher precision is expected with CRDS. For high absorption, the ring-down time is short while the modes are broad and the precision of CMWS tends to be higher. Considered together, the CRDS and CMWS methods provide a wider dynamic range of measurable absorption levels than those associated with either method considered alone. It is important to recall that, in the context of line-shape measurements, short ring-down times associated with strong absorption may lead to systematic errors caused by the finite bandwidth of the detection system. Therefore, CMWS
ACCEPTED MANUSCRIPT
potentially has a higher dynamic range than CRDS provided that the frequency axis of the cavity-mode spectrum is sufficiently accurate, as indicated in [64] and demonstrated in [67]. Experimental setups for CMWS require ultra-narrow probe laser line widths and sub-kHz resolutions of the frequency tuning to measure the kHz-level mode widths of high-finesse cavities. This can be achieved in a dual-beam configuration, where two orthogonal polarizations of the laser beam are used: the first for phase-locking the laser to the cavity mode and the second for scanning through the neighboring cavity-mode shapes [51,65,66]. This technique also eliminates the influence of the cavity acoustic noise on the mode spectrum.
Fig. 1: (a) - transmission spectrum of the empty optical cavity (red) and cavity filled with a gas (blue) having an absorption line (green); (b) –
principles of absorption
spectroscopies in the time
(CRDS) and frequency
(CMWS) domains, and
dispersion spectroscopy
(1D-CMDS) in the frequency
domain. After [13].
The measurement of dispersive mode shifts provides another interesting approach for quantitative spectroscopy because frequency is the physical observable that can be measured with the highest precision and lowest uncertainty. Furthermore, the determination of absolute or relative mode frequencies in the One-Dimensional Cavity Mode Dispersion Spectroscopy (1D-CMDS) [13] eliminates potential systematic errors in measured line-shapes caused by nonlinearities of the detection system. Contrary to "usual" spectra, which have absorption and frequency axes, in 1D-CMDS both axes of the dispersion or differential-dispersion spectrum are created from the same measurements of mode-center frequencies. They can thus be directly linked to primary frequency standards, as demonstrated in [67].
Comparisons of spectra obtained with different cavity-enhanced techniques also enable the quantification of potential systematic instrumental errors at the sub-percent level of uncertainty. For example, simultaneous measurements of both absorption and dispersion spectra provide a precise method to check the self-consistency of experimental line shapes. In [68], the accuracy of FS-CRDS (in the limit of strong absorption) was studied by comparison with 1D-CMDS. The line-shape fits revealed sub-percent level inconsistency between absorption and dispersion for high absorption, which could not be detected and were not manifest in the residuals of the individual fits, see Fig. 2. The above-described frequency-based cavity-enhanced techniques are thus particularly useful in applications (eg studies of self-broadened line-shapes over a wide pressure range) that require highly accurate measurements spanning a broad range of absorption. For applications that require extremely high accuracy and SI traceability of measurements (eg Sec. 5.2), the frequency-based 1D-CMDS should be an attractive alternative to traditional absorption techniques. So far both CMWS and 1D-CMDS were used for measurements of the shapes and absolute positions of
ACCEPTED MANUSCRIPT
CO lines with SNRs exceeding 104 [67]. CMWS was also applied to low-pressure CO spectra [69] using a NICE-OHMS experimental setup. It was recently demonstrated [70,71] that the CMWS and 1D-CMDS methods also can be combined with optical frequency comb single-tooth resolved spectroscopy [72]. In this case a broadband frequency-based absorption and dispersion spectrum can be measured with a kHz-level resolution (cf Sec. 2.7).
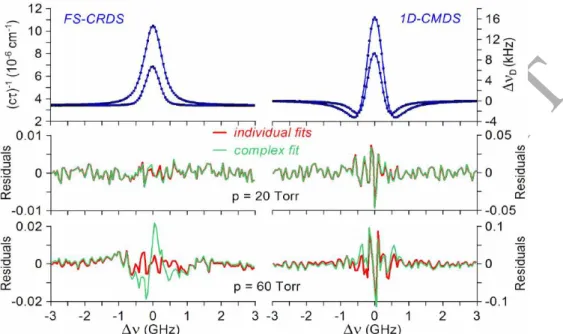
Fig. 2: Complex spectra (absorption from FS-CRDS and differential dispersion from 1D-CMDS) of 13C16O (3 –
0) band P3 line measured at two CO pressures p. Below residuals from the complex speed-dependent Nelkin-Ghatak profile fits (red) reveal perfect agreement between FS-CRDS and 1D-CMDS at p = 20 Torr and considerable disagreement at p = 60 Torr. Residuals from the individual absorption or dispersion fits (blue) do not allow detection of this systematic line-shape distortion. After [73].
2.6 Direct frequency-comb spectroscopy
For OFCs, the extremely high stability of the frequency axis combined with their broadband spectrum makes them attractive light sources for absorption measurements. A review of various experimental schemes of direct OFC-based spectroscopy can be found in [74]. For line-shape investigations, single-tooth resolved methods, which provide a spectral resolution limited only by the OFC stability, are particularly attractive. Indeed, FTS combined with an OFC source is suitable to line-shape studies since it combines extremely high resolution with a broad spectral coverage. Two approaches to this experimental scheme were developed: dual comb and mechanical FTS comb spectroscopy.
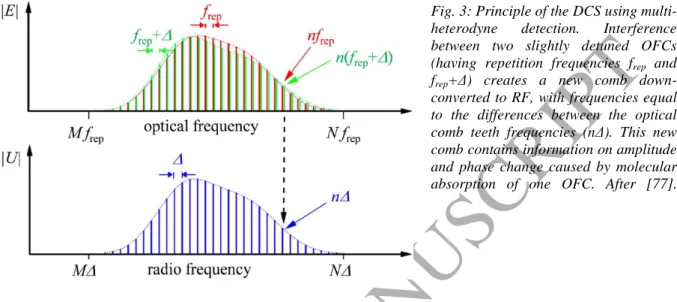
- Dual Comb with two femto-second lasers: The idea of Dual Comb Spectroscopy (DCS) [75]
is to interfere two OFCs having slightly different repetition rates, see Fig. 3. When both OFCs are combined and transmitted through a gas sample, the down-converted heterodyne beat spectrum of slightly detuned comb teeth provides an intensity absorption spectrum, similar to traditional FTS [76,77]. If only one OFC passes through the sample and the other serves as a local oscillator [78,79], both the absorption (amplitude) and dispersion (phase) spectra of the sample can be measured, analogous to dispersive FTS [80]. Note that for high SNR measurements using DCS, it is crucial to normalize the spectra for frequency- and time-dependent variations in both OFC amplitudes [79,81]. Coherent signal averaging also requires that the relative line width between corresponding teeth of the two combs is not larger than the inverse of the averaging time, which in practice requires phase-locking of both combs to the same optical reference [81]. Several studies of molecular spectra with DCS have demonstrated its potential for line-shape investigations. For instance, absorption and
ACCEPTED MANUSCRIPT
dispersion spectra of HCN with SNRs up to 4000 were measured [81]. DCS was also used to detect variations in atmospheric CO2, CH4 and H2O [82]. In this case, the high-resolution
spectra enabled comparison of the fit results obtained using the VP and SDVP with line-mixing for CO2 lines. Another example is given by [83] in which the positions of CH4 lines in
the 3 band were accurately determined from absorption and dispersion spectra having SNRs
up to 3500 and a spectral point spacing 4 times smaller than the OFC repetition frequency.
Fig. 3: Principle of the DCS using
multi-heterodyne detection. Interference
between two slightly detuned OFCs
(having repetition frequencies frep and
frep+Δ) creates a new comb
down-converted to RF, with frequencies equal to the differences between the optical comb teeth frequencies (nΔ). This new comb contains information on amplitude and phase change caused by molecular absorption of one OFC. After [77].
- Dual Comb with mini-combs: An alternative approach to DCS uses frequency combs
generated from a single continuous-wave laser radiation [14] by two electro-optic phase modulators with slightly different modulation frequencies. Such combs have a high relative coherence and enable over 2 hours of real-time signal averaging. The achieved 50 GHz span of the comb spectrum in the near infrared enabled simultaneous measurement of CO2, CO,
H2O and HDO lines at atmospheric pressure [84]. When compared to the femto-second OFCs,
this system has a low cost and easily adjustable comb spacing but a relatively narrow bandwidth. It can potentially provide higher SNR due to the extremely high coherence of the two combs and high power per tooth. These features make it suitable for accurate line-shape measurements.
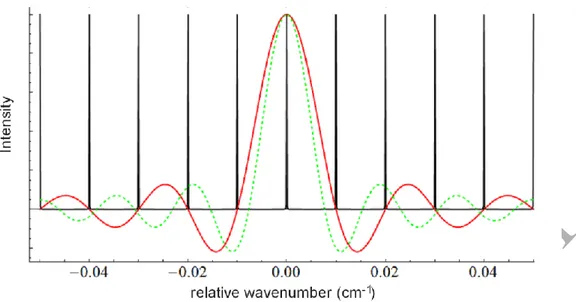
- Comb-based FTS with sub-nominal resolution: As recently shown [72], Fourier-transform
comb spectroscopy based on a single OFC and a Michelson interferometer can deliver the resolution of a comb-tooth, surpassing the natural limits of traditional FTS because of the unique properties of the OFC. When the travel length of the Michelson interferometer moving mirror equals c/frep, where frep is the repetition frequency of the comb, crosstalk
between frequency elements (the comb teeth) after Fourier transformation is completely eliminated (Fig. 4). Any spectral points between the comb teeth can be probed in consecutive scans with different frep and Δ. This technique enables the construction of relatively low-cost
and compact FT spectrometers with a resolution limited only by the comb line width. Proof-of principle line-shape measurements were made in the fundamental band of CO and 3ν1+ν3
band of CO2 with SNR of several hundred [72]. In the latter case, a high-finesse cavity locked
to the comb was used to enhance the path length. This method was used recently to study non-Voigt spectral shapes of CO2 lines [85]. With a SNR of about 250 the effects of the speed
ACCEPTED MANUSCRIPT
Fig. 4: Principle of the comb-based FT spectroscopy with sub-nominal resolution. When the length of the FT
interferogram Δ equals c/frep the instrumental sinc function (red curve) of given transformed comb tooth crosses
zero at multiples of frep which correspond to consecutive comb teeth (black curve). In this case FT instrumental
function does not influence the measured spectrum. When Δ differs from c/frep , the corresponding sinc function
(green dashed curve) has non-zero values at the comb teeth frequencies and influences the spectrum. After [72].
2.7 Cavity-enhanced direct frequency-comb spectroscopy
The use of a high-finesse cavity to improve the sensitivity of DCS is attractive. However, mirror- and gas-induced dispersions in the cavity affect the cavity-mode spacing and preclude the perfect matching with the equally spaced teeth of the OFC over a broad spectral range. Because this frequency mismatch affects the transmission spectrum, it must be properly modeled [86] so that dispersion must be accounted for when tightly locking a high-finesse enhancement cavity to a broadband OFC [87]. The problem may be also solved, at the cost of lower transmitted power and effective enhancement, using a dither locking scheme [15-18] in which the cavity length oscillates around the resonance with the comb and the oscillation amplitude is larger than the dispersive mode shifts.
Direct frequency comb based Fourier-transform spectroscopy methods described in the previous section were also used with enhancement cavities. A Michelson interferometer based FT was used to record CO2 line shapes with SNRs of several hundred [72] and
cavity-enhanced DCS for high-resolution spectroscopy was demonstrated in [14].
In comb-based Vernier spectroscopy [20,88] the cavity is used to filter the comb modes by setting the cavity FSR to a value slightly different than the comb-teeth spacing frep.
Such a filtered comb contains a reduced number of teeth with increased distance between them. Every nth tooth is transmitted through the cavity while all others are reflected. Here n must be large enough to enable single-tooth resolution by a dispersive grating or VIPA etalon. Their transmission may be measured simultaneously by a detector array, eg CCD. By precisely tuning the cavity length, an arbitrary set of filtered comb teeth can be selected in consecutive measurements. This method is competitive with the previously described direct FT-comb spectroscopies. This approach provides equally high resolution and a higher power-per-spectral element, but lower spectral coverage of the parallel measurement. For quantitative absorption measurements, one must account for the mismatch between the cavity modes and the comb teeth caused by broadband and resonant dispersion in the cavity [86]. Examples of spectra with individual line shapes having SNR over 100 were presented for CO [86] and HCN [89]. In the latter case, both absorption and dispersion spectra were recorded.
Broadband CMWS and 1D-CMDS measurements (Sec. 2.5) with an OFC as a light source were recently demonstrated. This experimental scheme significantly increases the
ACCEPTED MANUSCRIPT
acquisition rate of broadband spectra (by comparison to CW-laser setups) by the parallel measurement of hundreds of the cavity mode widths and shifts. In these methods of absorption and dispersion spectroscopy achieving single comb tooth resolution is critical. Both subnominal-resolution FT [71] and optical Vernier with a VIPA etalon [90] schemes yielded sub-kHz precision of the cavity mode and position measurements. The two approaches are based solely on frequency measurements and the recorded spectra therefore are insensitive to OFC power variations. Note that these methods have uncertainties that are unaffected by dispersion in the enhancement cavity [86]. They are thus promising for high-precision spectral line-shape measurements covering entire molecular bands.
2.8 Dual-laser absorption spectroscopy
Recording a line with high precision necessitates a stable and narrow optical frequency reference to which the probe laser can be referenced. Rather than using the tooth of an expensive self-referenced frequency comb (Sec. 2.4), an alternative solution was proposed [91] in which a kHz-linewidth-master laser (ML) is locked to a saturated absorption feature [33,92]. The probe laser is then forced to maintain a precise frequency-offset, provided by a radiofrequency (RF) synthesizer which is phase locked to an ultra stable Rb oscillator, from the ML. By tuning the RF frequency, it is possible to perform continuous, highly linear and accurate frequency scans of the probe laser around a given center frequency [91]. This feature, in conjunction with the extremely high linearity of the detection electronics, makes it possible to avoid any instrumental distortion in measured absorption line shapes, reaching an experimental accuracy limited only by the shot noise.
This dual-laser method has been used to investigate the shape of H218O lines in the
Doppler regime [93], evidencing the influence of speed-dependences of the pressure-broadening and shifting coefficients. Subsequently, the quality of the quadratic and hypergeometric models for these speed dependences was tested [94] (cf Sec. 3.2.4c). A recent improvement of the dual-laser technique involves a reference laser and the NICE-OHMS approach, making it possible to reduce the uncertainty associated with the frequency scale and allowing locking on weaker reference lines [95]. This technique was applied to measurements of spectroscopic parameters of C2H2 leading, in particular, to a determination of the 23+5
band Pe(14) line strength with a combined uncertainty of 0.22 % [96]. Apart from molecular
spectroscopy, the dual-laser technique has been successfully applied to the fields of Doppler thermometry and isotope research, as described in Secs. 5.2.1 and 5.2.2.
Finally note that the technique of offset-frequency locking of a pair of diode lasers is extensively used in atomic physics experiments, while it has been almost ignored in the field of molecular spectroscopy, until the work described in [97], in which the authors propose a dual laser method for water-vapor differential absorption sensing (cf also [98]).
2.9 Fourier-transform spectroscopy (FTS) methods
With the exception of direct frequency-comb-based methods (cf Sec. 2.6), the spectral resolution of most FT spectrometers is generally lower than that of laser-based systems. Nevertheless, these instruments typically provide more global spectral-shape information than can be obtained using relatively narrowband laser methods. Key attributes of FTS include the applicability to optically thick samples and the realization of accurate frequency axes with spectral coverage that is sufficient to investigate entire absorption bands. These attributes of FTS are most effectively exploited by carrying out physically constrained, multispectrum analyses [99] of several measured spectra that are acquired at known values of sample composition, pressure and temperature. In the last decade and before, such methods have provided a wealth of measured spectra for the test of theories and models, as well as for the determination of absorption-shape parameters from their fits. Given their broad spectral
ACCEPTED MANUSCRIPT
coverage and high data throughput, they have been, and remain, the workhorse for populating line-by-line spectroscopic databases. Numerous references cited in Secs. 3 and 4 demonstrate the interest of FTS and, in many cases, its advantages. An example can be found in [100] where information on individual line shapes, on line mixing and on collision-induced absorption in the O2 A band has been simultaneously retrieved from FTS and CRDS spectra.
This study shows the complementarity of these two experimental methods and the interest of investigating an extended spectral range that is analyzed through the simultaneous fit of spectra recorded at various pressures. The interest of such a method when the FTS is coupled to coolable cells (eg [101]) is further illustrated by [102], where multispectrum fits of broadband CH4 spectra recorded for various pressures and temperatures enabled the retrieval
of information on line-broadening, -shifting and -mixing coefficients together, for some lines, with the speed dependence. In addition, FTS has brought a lot of experimental information on the broadband water vapor continuum and on collision-induced absorption spectra, as shown by many references cited in Secs. 4.3.1 and 4.4. Let us finally mention a study [103], which is to our knowledge the first in which FT spectra have enabled the investigation of the effects of temperature on the parameters of a very refined individual line-shape model. Indeed, the T dependences of not only the line-broadening and -mixing coefficients but also those of the speed dependence of the width and of the Dicke narrowing parameter have been determined from fits of measured spectra.
2.10 Advances in coherent terahertz spectroscopy
The measurement of light-matter interaction in the terahertz spectral region (roughly 0.1-10 THz) is a fertile research area with numerous applications in spectroscopy. Although many materials that are opaque or absorb at infrared and visible wavelengths are transparent for THz (also known as mm-wave), there are species, such as water vapor, which have strong rotational absorption fingerprints there. Given the relatively small Doppler widths of transitions in this region, the line shapes are dominated by collisional effects at relatively low pressure.
Coherent sources required for THz spectrometers can be produced by photomixing of infrared lasers, backward wave oscillators or by frequency multiplication of radiofrequency (RF) sources [104]. These types of sources typically provide output powers no greater than a few microwatts, which has hindered more widespread implementation of high-resolution spectroscopy in the THz region. Recently, compact quantum-cascade lasers (QCLs) are emerging as attractive sources with emission frequency down to 5 THz, output powers as high as 10 mW and line widths from 100 Hz to 500 kHz [105-108]. The first high-resolution absorption spectroscopic measurement with a THz QCL was in 2006 and involved measurement of CH3OH [105]. More recently, a frequency-comb-assisted THz QCL
spectrometer resulted in an SNR of approximately 3000 and line centers measured with an uncertainty of 10 kHz [108]. These experiments clearly demonstrate the potential of QCL technology for realizing new high-precision line-shape studies in the THz region, although the stability of cryogenic detection schemes often remains a limiting factor in measurement precision.
Numerous THz line-shape studies were carried out prior to the development of THz-QCL sources. A spectrometer employing a custom-built coherent radiation source (based on photo mixing of two near-infrared lasers) provided temperature-dependent collisional width and shift coefficients of water vapor [109]. These measurements were made over the temperature range 263-340 K, yielding a spectral resolution of 15 MHz and relative uncertainty in the broadening coefficient from 1 to 3 %. In [110-112], a coherent source comprising a phase-locked, frequency-multiplied RF diode was developed to measure self-, nitrogen- and oxygen-broadened pure rotational lines of HNO3 and H2O. Absorption spectra
ACCEPTED MANUSCRIPT
were acquired using intensity- and frequency-modulation methods with phase-sensitive detection, and various line shapes were fit to the data to yield pressurebroadening and -shifting coefficients as well as speed-dependent broadening and collisional narrowing parameters. Recently, a coherent THz source based on frequency-multiplied RF synthesizer signals with a resolution of 5-10 MHz was used to measure absorption by water vapor within a multipass cell [113]. A global, multispectrum fit of 145 spectra yielded line positions, shift and broadening parameters as well as continuum coefficients for several line profiles.
An experiment using a phase-locked Gunn diode source [114] demonstrated the feasibility of CRDS measurements in the 75-100 GHz region. Subsequently, high-resolution determinations of N2 and O2 continua and H2O rotational lines in the THz region were made
using a fast-scanning (30 GHz/s) BWO source with a tuning range of 170-260 GHz [115]. This experiment employed a 10-m-long cavity, with finesse of 1000, line width of 13 kHz and resulted in a spectrum baseline noise of 2×10⁻⁷ cm-1. Also using a FP resonator, cavity line width measurements straddling the microwave and THz regions were used to measure O2 and
H2O absorption line shapes, with baseline noise levels of 4×10⁻⁹ cm-1 and spectrum SNRs
approaching 1000. Recently, cavity-enhanced measurements of N2O near 0.1 THz were
realized with a low-mass, CMOS-based instrument having a 3-cm-long resonator, finesse of 200 and mode width of 20 MHz [116]. Fourier transforming the echo induced by the pulsed source yielded pressure-broadened N2O line shapes nominally 1 MHz wide and a detection
limit of 5×10¹¹ molec.cm-3. It is worth noting that although cavity-enhancement in these long wavelength regions increases measurement sensitivity compared to direct absorption methods, the maximum finesse of metallic-reflector-based resonators is typically diffraction limited and nominally two orders of magnitude lower than that achieved with the super-polished dielectric mirrors available for visible and near-infrared systems.
3. Theories, models, results
3.1 Introduction and selection criteria
This section is devoted to theories, models and results concerning pressure effects on absorption spectra, which are to be understood as follows: "Theories" means theoretical approaches that enable direct predictions of some measured quantities (spectra, line widths,
etc). Within this topic we limit ourselves to those proposed since [1], ie 2007. "Models" refers
to those assumptions and resulting equations that enable the description of experimental results based on parameters that are fitted to measured data. Here again, we focus on those proposed in the last decade. "Results" must be understood in the sense of comparisons between the predictions of "theories" and experiments, or tests of the ability of "models" to represent measurements. We consider those results obtained since 2007, regardless of when the theory or model used was published.
The remainder of Sec. 3 is divided into five parts in which we try to update the information given in chapters III-VI of [1]. Section 3.2 focuses on "isolated lines" that are not affected by neighboring transitions but are influenced by various effects leading to non-Voigt profiles. The calculations of "pressure-broadening and -shifting coefficients", primary ingredients of their shapes, are discussed in Sec. 3.3. "Line-mixing", through which the transfer of population between rotational levels has spectral consequences not too far from line centers, is the subject of Sec. 3.4. Section 3.5 then focuses on the spectral regions of the "far wings and associated continua" to which many processes, including the finite duration of collisions, contribute in a complex manner. Finally, "collision-induced absorption", when the interaction of molecules with light results from the dipole that only exists during intermolecular collisions, is considered in Sec. 3.6.
Note that most of the studies discussed in this section have been made at or near room temperature. In the following, we will thus generally give information on the
temperature-ACCEPTED MANUSCRIPT
range investigated only when the latter is broad enough to enable a significant test of the ability of a theory or model to describe the T dependence.
3.2 Isolated line shapes
As in Chapt. III of [1], we consider here "isolated transitions", ie those sufficiently distant from others for their core region not to be influenced by their neighbors under the considered gas conditions. Describing their shapes requires simultaneously accounting for the Doppler effect, the collision-induced velocity changes of the radiating molecule, and the pressure-induced speed-dependent line broadening and spectral shifting. With regard to this topic, the last decade has witnessed several advances, largely based on the high quality of spectra recorded with laser techniques (Sec. 2). Various phenomenological line-shape models have been proposed and/or tested, while theories for predictions of the line shape were developed. In the first part of this section, we present a new approach for the direct calculation of isolated line profiles (Sec. 3.2.1). Other approaches evaluating the spectral shapes by using a kinetic equation describing the time evolution of the dipole auto-correlation function (ACF) are presented in Sec. 3.2.2. Models and methods developed or used to compute the velocity collision kernels involved in this equation are also reviewed in Sec. 3.2.2. Approaches proposed that account for relativistic and dispersion effects on the line shape are the subjects of Sec. 3.2.3. Finally, recent advances concerning phenomenological line-profile models are reviewed in Sec 3.2.4.
3.2.1 Direct and empirically corrected predictions from Molecular Dynamics Simulations
A new theory for the direct prediction of isolated line shapes of linear molecules was proposed in [117]. It uses classical dynamics and an assumed intermolecular potential to compute the translational and rotational evolutions of a large number of molecules. These Classical Molecular Dynamics Simulations (CMDS) provide the center-of-mass position
( )
m
q t and velocity, as well as the axis orientation um( )t and rotational angular momentum,
of each molecule m at all times t. For the linear species considered, the dipole moment lies along the molecular axis and its ACF is proportional to the average u(0). ( )u t . The Doppler
effect is introduced through the relative displacement
qm( )t qm(0) .
z along the radiation-propagation direction z. The Laplace-Fourier transform of this ACF (ie multiplying the ACF by exp( i t)and integrating from t=0 to ) then yields the absorption spectrum. However, because CMDS lead to a continuous distribution of rotational speeds, this spectrum shows no line structure. In order to solve this problem, a requantization procedure was proposed [117]. As first demonstrated for pure CO2 [117,118] and confirmed for other systems [119,120],these requantized CMDS (rCMDS) closely predict the observed relative deviations of line shapes from the VP without adjusting parameters. Note that an alternative requantization was proposed in [121], which is more suitable for light rotors and was successfully applied to HCl [121] and CH4 [122] lines. It also enables one to constrain the positions and intensities of the
lines in the calculated spectrum to literature values (taken from a database, for instance), a possibility that was used in [123,124].
While rCMDS accurately predict the relative deviations of line shapes from the best VP fits, the line shapes themselves are not as well described because the line widths in rCMDS-calculated spectra may deviate from measured values by several percent (eg [117,120,121]). An approach to empirically correct for these discrepancies was proposed in [125] and successfully tested for some CO lines. The idea is to multiply the rCMDS-calculated dipole ACF for line at pressure P by the correction factor exp( 2 c Pt). Here, is the
![[PDF] Resume Java : syntaxe de base avec exemples d’application | Cours java](data:image/gif;base64,R0lGODlhAQABAIAAAP///wAAACH5BAEAAAAALAAAAAABAAEAAAICRAEAOw==)