HAL Id: halshs-02996088
https://halshs.archives-ouvertes.fr/halshs-02996088
Submitted on 9 Nov 2020HAL is a multi-disciplinary open access archive for the deposit and dissemination of sci-entific research documents, whether they are pub-lished or not. The documents may come from teaching and research institutions in France or abroad, or from public or private research centers.
L’archive ouverte pluridisciplinaire HAL, est destinée au dépôt et à la diffusion de documents scientifiques de niveau recherche, publiés ou non, émanant des établissements d’enseignement et de recherche français ou étrangers, des laboratoires publics ou privés.
Mapping the globe. The patterns of mega-ships
César Ducruet, Justin Berli
To cite this version:
César Ducruet, Justin Berli. Mapping the globe. The patterns of mega-ships. Port Technology International, Maritime Information Services, 2018, 77, pp.94-96. �halshs-02996088�
Mapping the globe. The patterns of mega-ships
Port Technology International (2018), No. 77, pp. 94-96
César DUCRUET, Justin BERLI
Centre National de la Recherche Scientifique (CNRS)
How is the shipping network of the largest containerships distributed across the globe? Many issues have been raised about the so-called mega-ships in terms of port capacity and competitiveness, shipping alliances, and technological change, but the precise geography of their circulation had remained somewhat overlooked to date. This article thus provides a concrete description and explanation of the observed pattern in the recent period, notwithstanding a brief explanation of the data and methodology used for such a purpose.
Data and methodology
The most efficient way to map and analyse the global container shipping network is to extract information from the Lloyd’s List Intelligence database, produced by the world’s leading maritime intelligence and insurance in history1. Covering the complete months of June and December 2016, our database comprises 121 mega-ships defined by a capacity over 14,000 TEUs (i.e. 1.98% of the total number of containerships), with a total fleet capacity of 1,976,077 TEUs (i.e. 9.62% of the total containership capacity). Mapping the combined traffic of all containerships (including mega-ships) for 2016 consisted in assigning “real flows” to a world maritime grid at both nodes (ports) and links (segments)2. Lloyd’s information being vessel movements between ports without knowledge on their exact circulation pattern or spatial trajectory, such a method allowed for representing flows with accuracy following the principle of the shortest path. A port-to-port matrix was thus elaborated including not only direct movements between ports (i.e. A-B, B-C, C-D) but also indirect linkages (AC, BD) in order to consider the full voyage of the ships. As a preliminary result and among the 1,000 ports connected by containerships in 2016, only 67 have welcomed mega-ships, thus only 6.7% of world ports. This subgroup of the world container fleet is thus highly selective in its network design and port choice when designing its services and routes.
The global pattern of mega-ship traffic
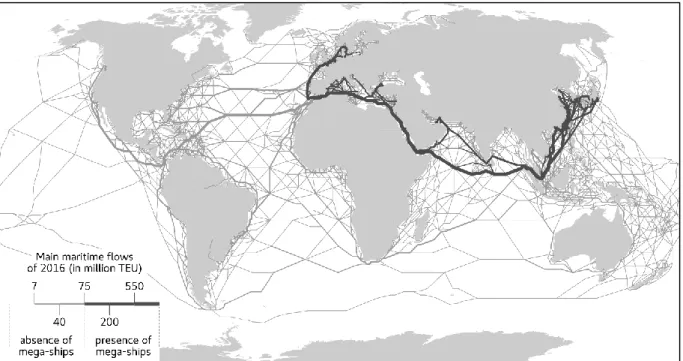
The cartography of the distribution of global containership traffic first confirms the importance of the round-the-world trunk line connecting the main economic centres of the world or “Triade” in the Northern hemisphere, with smaller routes being more north-south, south-south, or intra-regional (Figure 1). What is absolutely striking is the fact that mega-ship traffic (illustrated in dark colour) remains spatially concentrated along the Europe-Asia route, without any presence elsewhere. A number of factors can explain such a network structure and specialisation. First of all, the maritime silk road has long been a major highway since Antiquity and prolonged in colonial times as well as nowadays with the now famous One Belt, One Road vision and strategy of China. Second, the
1 For a review about the variety of all sorts of shipping data, see Ducruet (2017)
2 For more information on the creation of the grid with an application to the Mediterranean basin, see Ducruet
expansion of the Panama Canal was not sufficient to welcome such sea giants, so that their circulation pattern remains bound to this particular segment of the global, East-West trunk line. Despite recent announcements in the press about the launch of mega-ships on the Transpacific route (Knowler, 2015), the long-term effects of the 2009 global financial crisis had the major effect to concentrate the services of alliances and individual shipping lines on the more lucrative Europe-Asia segment.
Implications for ports
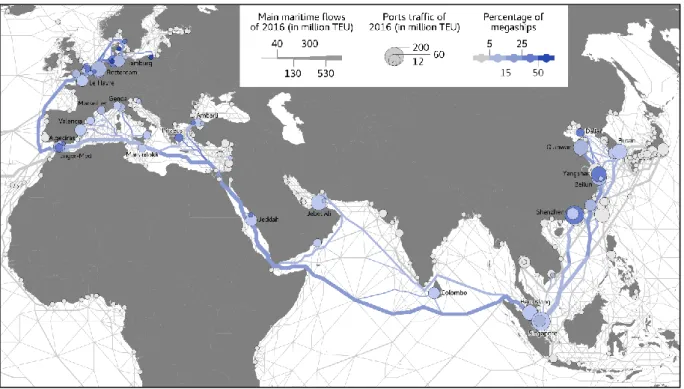
A zoom on this specific Europe-Asia route allows figuring the port hierarchy along this route as well as the share of mega-ship traffic (%TEUs) in the total containership traffic of ports (Figure 2). Such results reveal that port size is not always reflected by the absolute or relative importance of mega-ship traffic (see also Table 1). Statistically speaking, the linear (Pearson) correlation coefficient between total traffic and mega-ship traffic is only about 0.44, while the power-law line based on a log-log fit of the same variables reached only 0.38 (R²). The direct implication of these results is that other factors than size come to play, mainly related to the location and function of ports.
As a matter of fact, ports with a lower share of mega-ship traffic are often gateway ports which main function is to serve hinterlands. However, this same share is also low at ports known to be dominantly transhipment ports, mainly because of the frequency and intensity of smaller vessel movements between hub ports and feeder ports, which has the effect of reducing the relative importance of mega-ships. Ports being both gateways and transhipment hubs, such as Rotterdam, Antwerp, and Busan, thus have a lower share of mega-ship traffic. Of course, the quality of port infrastructure also plays a role, as seen with the higher percentage of mega-ship traffic in Yangshan, Shanghai’s offshore hub, but also in Piraeus, where the terminal handling company COSCO obtained a concession nearly a decade ago. Last but not least, a number of smaller ports exhibit a higher share of mega-ship traffic mainly in Europe, such as Gdansk, Aarhus, Bremerhaven, Felixstowe, but also in Asia with the case of Dalian. Such effects as mainly conjectural and supported by specific windows of opportunity, such as in Gdansk, the largest port of the Baltic Sea in in the mid-2010s, which stands out due to its recent inclusion in the services of the G6 alliance (OECD-ITF, 2016).
Acknowledgements
The research leading to these results has received funding from the European Research Council under the European Union's Seventh Framework Programme (FP/2007-2013) / ERC Grant Agreement n. [313847] "World Seastems". For more information: www.world-seastems.cnrs.fr
Useful references
Ducruet C. (Ed.) (2017) Advances in Shipping Data Analysis and Modeling. Tracking and Mapping
Maritime Flows in the Age of Big Data. Routledge Studies in Transport Analysis, Routledge: London &
New York, 472 p., https://www.routledge.com/Advances-in-Shipping-Data-Analysis-and-Modeling-Tracking-and-Mapping-Maritime/Ducruet/p/book/9781138280939
Ducruet C., Bunel M. (2017) GeoSeastems: an innovative tool to map global shipping flows. Application to the Mediterranean region. Portus Online, 33: http://portusonline.org/en/geoseastems-an-innovative-tool-to-map-global-shipping-flows-application-to-the-mediterranean-region/#
Knowler G. (2015) Mega-ship era hits the trans-Pacific trade. Journal of Commerce, December 14th. OECD-ITF (2016) The Impact of Mega-Ships. The Case of Gothenburg. Case-Specific Policy Analysis, online.
Source: own elaboration based on Lloyd’s List Intelligence data
Figure 2: Relative importance of mega-ship traffic along the Europe-Asia route Source: own elaboration based on Lloyd’s List Intelligence data
Rank By total mega-ship traffic (TEUs) By share of mega-ship traffic (%TEUs)
Port % Port %
1 Shenzhen 26.5 Gdansk 99.9
2 Yangshan 41.5 Aarhus 85.7
3 Singapore 10.5 Wilhelmshaven 67.4
4 Rotterdam 22.5 Felixstowe 47.5
5 Beilun 18.3 King Abdullah Port 46.0
6 Busan 11.2 Yangshan 41.5
7 Bremerhaven 39.6 Bremerhaven 39.6
8 Qianwan 17.9 Asyaport 35.1
9 Xiamen 22.0 Gothenburg 33.9
10 Felixstowe 47.5 Malaga 32.4
11 Port Klang 11.8 Ningbo 30.9
12 Hamburg 21.3 Zeebrugge 29.7
13 Antwerp 15.8 Tangier-Med 27.3
14 Tanjung Pelepas 19.2 Dalian 27.2
15 Tangier-Med 27.3 Shenzhen 26.5
17 Ningbo 30.9 Cai Mep 23.9
18 Piraeus 26.0 Dunkirk 23.2
19 Algeciras 16.9 Rotterdam 22.5
20 Dalian 27.2 Khor Fakkan 22.2
21 Colombo 13.6 Xiamen 22.0
22 Jebel Ali 7.7 Evyap 21.9
23 Hong Kong 3.1 Hamburg 21.3
24 King Abdullah Port 46.0 La Spezia 20.7
Table 1: Top 25 ports in the world handling mega-ships, 2016 Source: own elaboration based on Lloyd’s List Intelligence data