HAL Id: hal-01158517
https://hal.sorbonne-universite.fr/hal-01158517
Submitted on 1 Jun 2015
HAL is a multi-disciplinary open access
archive for the deposit and dissemination of
sci-entific research documents, whether they are
pub-lished or not. The documents may come from
teaching and research institutions in France or
abroad, or from public or private research centers.
L’archive ouverte pluridisciplinaire HAL, est
destinée au dépôt et à la diffusion de documents
scientifiques de niveau recherche, publiés ou non,
émanant des établissements d’enseignement et de
recherche français ou étrangers, des laboratoires
publics ou privés.
Concentrated assemblies of magnetic nanoparticles in
ionic liquids
Marianna Mamusa, Juliette Sirieix-Plénet, Régine Perzynski, Fabrice Cousin,
Emmanuelle Dubois, Véronique Peyre
To cite this version:
Marianna Mamusa, Juliette Sirieix-Plénet, Régine Perzynski, Fabrice Cousin, Emmanuelle Dubois, et
al.. Concentrated assemblies of magnetic nanoparticles in ionic liquids. Faraday Discussions, Royal
Society of Chemistry, 2015, 181, pp.193-209 �10.1039/C5FD00019J�. �hal-01158517�
Concentrated assemblies of magnetic nanoparticles in Ionic Liquids
†
Marianna Mamusa,
a,bJuliette Sirieix-Pl´enet,
a‡, R´egine Perzynski
a‡, Fabrice Cousin
c‡, Emmanuelle
Dubois
a‡and V´eronique Peyre
∗aReceived Xth XXXXXXXXXX 20XX, Accepted Xth XXXXXXXXX 20XX First published on the web Xth XXXXXXXXXX 200X
DOI: 10.1039/b000000x
Maghemite (γ-Fe2O3) nanoparticles (NPs) can be successfully dispersed in a protic ionic liquid, ethylammonium nitrate (EAN)
by transfer from aqueous dispersions into EAN. As the aqueous systems are well controlled, several parameters can be tuned. Their crucial role on the interparticle potential and on the structure of the dispersions is evidenced : (i) The size of the NPs tunes the interparticle attraction monitoring dispersions to be either monophasic or gas-liquid like phase separated; (ii) The nature of the initial counterion in water (here sodium, lithium or ethyl ammonium) and the amount of added water (< 20% vol) modulate the interparticle repulsion. Very concentrated dispersions with a volume fraction around 25% are obtained thanks to the gas-liquid like phase separations. Such conclusions are derived from a fine structural and dynamical study of the dispersions on a large range of spatial scales by coupling several techniques: chemical analyses, optical microscopy, dynamic light scattering, magneto-optic birefringence and Small Angle Scattering.
1
Introduction
Ionic liquids are a new class of solvents which properties open novel possibilities in various fields as materials1,2, nanopar-ticles synthesis3, catalytic material4, or dye-sensitized solar
cells5. In particular, a growing interest focuses on the
elabo-ration of stable dispersions of nanoparticles in Ionic Liquids (ILs)6–11. In such systems, understanding the mechanisms
that ensure the colloidal stability remains challenging because all the concepts that are classically used for colloidal disper-sion in water and/or in organic solvents have to be revisited due to the peculiar nature of ILs. Nevertheless, as for a clas-sical solvent, the structure of the interface between the solid nanoparticle’s surface and the liquid solvent carrier appears to be a key point in these complex systems. To date, the descrip-tion of the organizadescrip-tion of such interface close to nanoparti-cle’s surface has been seldom addressed. Indeed, only few works focus on nanoparticles dispersions in ILs, especially concentrated ones, but no general trends can be extracted.6–11. Moreover, the parameters controlling their nanostructure have not been yet precisely identified, albeit it is an essential pre-requisite for a fine tuning of the dispersions. In particular, the role of water remains poorly investigated although some water
† Electronic Supplementary Information (ESI) available: [details of any supplementary information available should be included here]. See DOI: 10.1039/b000000x/
aUniversit´e Pierre et Marie Curie - Paris 6 - PHENIX UMR CNRS 8234,
Paris , France Fax: 00 33 1 44 27 32 28; Tel: 00 33 1 44 27 36 76; E-mail: [email protected]
bConsorzio per lo Sviluppo dei Sistemi Grande Interfase (CSGI), via della
Lastruccia 3, 50019 Sesto Fiorentino (FI), Italy
cLab. L´eon Brillouin, UMR CNRS 12, CE Saclay, Gif sur Yvette, France.
remains in most of the ILs.
To address these questions, we propose here to scrutinize a colloidal model system, given that it is based on two compo-nents which have been extensively studied separately in liter-ature. Ethyl ammonium nitrate (EAN) is the ionic liquid and maghemite nanoparticles (NPs) are the colloids that are to be dispersed. Their dispersions in EAN are achieved by transfer from aqueous well-known ones in EAN. Our former studies on NPs dispersions in EAN12,13already established (i) the im-portant role played by the surface charge of the nanoparticles (sign and value) in the aqueous initial dispersion12; (ii) the in-fluence of the nature of the counterions in the aqueous initial dispersion on a large range of nanoparticles volume fractions Φ (1% < Φ < 8%)13. These results pointed out the role of the interface between the solid and the solvent on the interparticle interaction potential, with an attractive part linked to van der Waals and magnetic dipolar interaction to be balanced by re-pulsions to obtain stable dispersions. The orders of magnitude of the potential we valued demonstrated that it has a limited amplitude, therefore tiny modifications of it strongly modify the microstructure of the dispersions. Indeed, for example, we demonstrated that weak interparticle repulsion occurs when counterions of nanoparticles in the initial aqueous suspensions are sodium ions, leading to well dispersed suspensions, while weak interparticle attractions occur when such initial counte-rions are lithium, leading to small aggregates, all other physic-ochemical conditions being equal.
In the present study, the influence of the counterions in the initial aqueous dispersions is considered again, but we ex-tend our investigation to other parameters that influence the
interparticle potential. Firstly, the attractive part of the poten-tial is increased by enlarging the NPs size. Indeed, as these NPs are magnetic, the magnetic dipolar interaction, attractive on average, hugely increases with NPs diameter, as van der Waals interactions also do. Such modifications are expected to induce deep changes in the macroscopic properties as very different behaviours occur in colloidal systems depending on the detailed shape of the attractive part of the potential: irre-versible flocculation is induced by intense attractions at very short range, generally close to contact between NPs, while gas-liquid like phase separations appear for long ranged weak attractions14. Small stable aggregates may also be observed for long ranged attractions when irreversible aggregation is hindered by intense short-ranged repulsions, usually of steric origin15. Secondly, we examine the role of water through the
addition of a controlled amount of water within the stable col-loidal suspensions in EAN after their synthesis. Such aspects are indeed seldom studied despite the fact that a small amount of water is always present. Even when present at very low volume contents in IL, it can easily cover all solid/solvent interfaces of the nanoparticles if it localizes preferentially at the NPs surface or in its vicinity, inducing a strong modifica-tion of the interface, and therefore of the interacmodifica-tion potential. Some comments on the influence of water have been already reported in previous studies7,9,10,16,17, which give contrasted behaviors, as dispersions either flocculate or not when water is added. Taking benefit from these control parameters, we demonstrate that the tuning of the interparticle potential en-ables to obtain highly stable concentrated dispersions with a volume fraction around 25%.
Our approach is based on the characterization of the dis-persions at all the relevant scales of the system with several complementary techniques : beside macroscopic observation, the samples are probed on the micron scale by optical mi-croscopy, whereas the typical scale of the NPs is probed by coupling Small Angle Scattering (SAS) that gives the time-averaged static structure of the suspensions to diffusion tech-niques, namely Dynamic light scattering (DLS) and magneto-optic birefringence experiments, that give respectively trans-lational and rotational diffusion coefficients of the objects. Complementary chemical determinations are performed in or-der to obtain the value of the typical ionic concentrations close to the NP surface.
2
Materials and methods
Since the procedure, reactants and techniques have already been described in13, we only briefly recall here what is spe-cific to the present work.
2.1 Synthesis of NPs and EAN
Iron oxide (maghemite) nanoparticles were synthesized and size-sorted in water. The particles were routinely charac-terized using X-ray diffraction, Transmission Electron Mi-croscopy (TEM) and magnetization measurements. The size and polydispersity of the NPs were obtained from the fitting of the magnetization curves using a lognormal distribution. The radius R and polydispersity index σ obtained after size sorting were R = 5.6 nm and σ = 0.26. Using the second moment of the size distribution, the specific surface can be estimated to be 88 m2/g. After synthesis, the final aqueous pH is 2.4, the volume fraction Φ is 0.89 % and the counterion of the NP is nitrate.
EAN is a room temperature ionic liquid (m.p. = 14◦C), in which a pH scale going from zero to 10 can be defined18,19. The molecules of EAN form a network of hydrogen bonds, similar to what water molecules do20. The synthesis of EAN
was described previously13,21. Its water content, determined
using a coulometric Karl-Fisher (KF) titration (Schott Titro-line KF), was at most 0.3w%. This value was confirmed by a loss of weight of around 0.2w%, by Thermogravimetric anal-ysis (TGA, SDT Q600 thermal analyzer from TA Instruments) between 20 and 150◦C and before EAN degradation.
2.2 Transfer of the NPs to EAN
After their initial synthesis, the surface of the NPs were func-tionalized in water with citrate22. During such a process, the charge of the NPs is reversed, becoming negative, and the new counterion is that of the citrate salt, chosen for functionaliza-tion. We used here citrate salts with Na+, Li+or ethylammo-nium (EA+) counterions. In the last step of the process, EAN is added instead of water to the flocculated system for redis-persion. The solutions are eventually freeze-dried overnight to remove as much water as possible. Macroscopic redis-persion is observed immediately with sodium and ethyl am-monium counterions however only after several weeks with lithium counterions. At this stage, the dispersion concentra-tion is about Φ = 1%. The samples in EAN are concentrated by ultrafiltration, using 10kD Amicon Ultra centrifugational filter units and centrifugation at 5000g for 48 to 72h. This procedure yields both a concentrated dispersion in the filter and the dispersing medium at the bottom of the tube. The fi-nal water content could not be determined in the dispersion neither by KF, due to redox interferences, nor by IR, which is not sensitive enough. Since TGA leads to a loss of weight of 1 to 2 % at most, we infer that this was the maximum water content in the final EAN dispersions.
2.3 Techniques
Flame atomic absorption spectroscopy (FAAS) A Perkin-Elmer Analyst 100 Instrument was used for FAAS, to deter-mine the nanoparticles concentration (via the iron content), and the Na+and Li+ concentrations both in the dispersions and in the dispersing medium.
Small angle scattering (SAS)Small angle neutron scatter-ing (SANS) was carried out on the PACE spectrometer at the LLB facility (CEA Saclay, France), and Small angle X-ray scattering (SAXS) was performed on the Swing beamline at Soleil Synchrotron (St Aubin, France), using the same con-figurations and procedures as before13. The form factor was obtained in SAXS from several aqueous dilute dispersions of decreasing concentration, for which interparticle interactions are already very weak, in order to obtain the exact form factor from a Zimm-Plot approach. The extrapolation of the scat-tered intensities to Φ = 0 in the whole experimental probed q-range (0.003 ˚A−1≤ q ≤ 0.3 ˚A−1) leads to the form factor that is shown in Figure 1 of SI. It can be fitted with a lognor-mal distribution of dense spheres, using R = 5.5 nm and σ = 0.30, coherent with the magnetization results. The structure factors of EAN dispersions are then obtained experimentally using the ratio of the scattered intensities (SANS or SAXS) to this form factor.
Magneto-optic birefringence experimentsThe rotational re-laxation of the nanoparticles can be determined thanks to the magneto–induced birefringence signal. Indeed, each particle bears a magnetic dipole moment and has a uniaxial optical anisotropy23. While applying a magnetic field, the magnetic dipole orients along the field, producing a mechanical rotation of the whole nanocrystal and inducing a macroscopic bire-fringence. Using a weak magnetic field (H < 8 kA m−1) that can be switched off quickly and a red laser at 650 nm (a wavelength at which the absorption of light by the NPs is low), the relaxation of this birefringence after switching off the field can be measured24. For an ideal monodisperse
sam-ple, such a relaxation can be described by a monoexponential decay with a characteristic time τrot= 1/6Drot, where Drot is
the rotational diffusion coefficient. For polydisperse samples, a stretched exponential is necessary. The curves are fitted us-ing the function exp[−(t/τrot)β], and the average time < τrot>
is then calculated as < τrot>= τrot/β · Γ(1/β ), Γ referring to
the Gamma function. For a fluid system far from the glass transition:
< τrot>=
ηVH
kBT
(1) where VHis the hydrodynamic volume of each rotating
parti-cle, η the viscosity of the solvent, kB is the Boltzmann
con-stant, T the absolute temperature and β the stretching expo-nent.
Superconducting quantum interference device (SQUID)In
the case of a maghemite-based ferrofluid, at room temperature the orientation of the magnetic moment of the particles with a radius R under an external magnetic field H is described at low Φ’s by the first Langevin’s equation25. The magnetization of the material mscan be deduced from the magnetization at
saturation Ms measured at high field values, for a dispersion
of known volume fraction Φ : Ms= msΦ. We determine ms=
312 kA/m. Once msis known, the volume fraction of any other
dispersion based on the same NPs can be deduced from the de-termination of Ms. The size distribution can be described by a
lognormal law (radius R, polydispersity σ ) and obtained from the fit of the whole magnetization curve. Here magnetizations are measured with a CRYOGENIC device, model S600, at 300 K. The magnetic field (Hmax = 4.4 106A/m) is generated by
a NbTi superconducting coil. The precision on the measure-ments is around 1%.
Dynamic light scattering (DLS)A Vasco instrument (Cor-douan Technologies), operating at 658 nm with backscattering detection at 135◦was used to study the translational diffusion properties of the particles. This instrument is able to deter-mine the autocorrelation functions even in concentrated and dark/turbid media thanks to an original sample cell design. Here, for each sample, acquisition parameters such as laser power, sampling time and number of channels were adjusted in order to obtain the best autocorrelation curve. Each sample was analyzed at least 15 times for 60 seconds. As for magneto-optic birefringence, a stretched exponential is used in order to extract a mean translational time < τtr> from which the
dif-fusion coefficient Dtris extracted at low NPs volume fraction,
from the Stokes-Einstein equation: Dtr= 1 < τtr> Q2 = kBT 6πηRH (2) where RHis the hydrodynamic radius of the scattering
parti-cles, kBis the Boltzmann constant, T the absolute temperature,
and η the viscosity of the medium. The viscosities are taken from the literature (0.891 mPa s−1for water, 34.3 mPa s−1for EAN at 25◦C26, viscosities for mixtures in26). Refractive in-dexes for EAN-Water mixtures and pure EAN were measured on an Abbe refractometer at 25◦C.
3
Control of attractive interactions with NPs
size
Using the procedure of preparation described in section 2, which is similar to the one used in a previous study13, col-loidal dispersions are obtained with maghemite nanoparticles that have a much larger mean size than the ones described in13, the mean diameter being here 11 nm while it was previously 7 nm. However, contrarily to what was previously observed for the smaller NPs, a macroscopic gas-liquid like phase sep-aration occurs above a given volume fraction’s threshold with
these large NPs. This demixing in two liquid phases can then be used as an easy way to produce stable and highly concen-trated dispersions. The drastic difference when increasing the mean particle diameter from 7 nm up to 11 nm originates from the huge modification of the attractive interactions between the magnetic nanoparticles with their size. This point will be discussed later.
As the same macroscopic behaviors are qualitatively ob-served in EAN whatever the initial counterion of the particles in water (sodium, lithium, ethylammonium), we choose to fo-cus on the case of lithium counterions. On the macroscopic scale, the gas-liquid transition can be directly seen after sep-aration of the phases in a thin cell due to the very large dif-ference of volume fraction, thus of density, between the two phases, which also produces a large optical contrast due to absorption, as shown in Figure 1 left. However, with this method, it becomes difficult to detect the phase separation by naked eye when the proportion of concentrated phase is low. Therefore optical microscopy is systematically performed in order to check whether samples are monophasic or not. An example is shown in Figure 1 middle, enlighting the difficul-ties to probe concentrated suspensions: the concentrated phase is pressed here between two glasses lamellae, down to a thick-ness around 20-30 µm, and still strongly absorbs light, while its large viscosity makes its handling difficult.
Fig. 1 left: macroscopic view of the phase separation in a cell with thickness 0.5 mm. The dilute phase appears as red, whereas the concentrated phase appears as a black crescent at the bottom. middle: optical microscopy of a diphasic sample, the concentrated phase appears in black, cell thickness 20-30 µm; right: isolated concentrated phase under a magnetic field (' 0.3 T) perpendicular to the liquid interface. Scales are indicated on the pictures.
Let us compare in details one sample below the destabi-lization concentration threshold (Li-EAN) and the two phases formed above this threshold, namely the dilute ’gas’ phase (Li-EAN-D) and the concentrated ’liquid’ phase (Li-EAN-C). The initial sample in water before transfer in EAN is Li-W. The chemical titrations of iron and lithium lead to the results presented in Table 1. The determinations of volume frac-tions indicate that the destabilization threshold in EAN lies around 1 %. The concentrated phase can be isolated and its volume fraction is very large (23%). It presents the classic Rosensweig’s peak instability of ferrofluids under a magnetic
field perpendicular to the liquid/gas interface as shown in Fig-ure 1 right.
To shed some light on the repartition of lithium in these colloidal dispersions in EAN as in water, the lithium concen-tration has been determined in all the samples of Table I. In-deed, the difference between the total lithium concentration [Li]tot (directly obtained by flame spectroscopy) ) and the free
lithium concentration in the solvent [Li]f ree (more difficult
indirect determination) gives the quantity of lithium that re-mains close to the nanoparticles. In water, [Li]f reeis deduced
from conductivity measurements of the colloidal dispersion, which is dominated by the contribution of free lithium cit-rate. Given the pH of the dispersion in water22, [Li+]f ree=3
[citrate3−]
f ree. In EAN, free lithium is determined by flame
spectroscopy in the solvent recovered after ultrafiltration of the samples, within the hypothesis that this free lithium concentra-tion is not modified by ultrafiltraconcentra-tion. The number of lithium ions which remain close to the particles is then converted to lithium per surface taking into account the size distribution of the nanoparticles.
Table 1 Li-based samples: volume fraction Φ, total lithium concentration [Li]tot, free lithium concentration [Li]f ree, number of
lithium per surface on the nanoparticles Li+/nm2(see text for
details).
Sample Φ (%) [Li]tot(mol/L) [Li]f ree(mol/L) Li+/nm2
Li-W 0.87 0.043 0.028 2.3 Li-EAN 0.46 0.033 0.027 1.6 Li-EAN-D 1.06 0.041 0.027 1.7 Li-EAN-C 23 0.24 0.027 1.6
In water, lithium ions that remain close to the particles are the counterions which counterbalance the particle’s charge, therefore the number of lithium ions which remain close to the particles provides directly the structural charge of the nanopar-ticles. The value 2.3 Li/nm2is coherent with previous deter-minations in water in similar systems with sodium counteri-ons22. The situation is rather different in EAN as lithium is no longer the only possible cation which can counterbalance sur-face charges. Indeed, the total concentration of lithium cations is much smaller than the concentration of the ethylammonium cations from the ionic liquid (11 mol/L). Despite this huge dif-ference, surprisingly 1.6 Li/nm2remain close to the
nanopar-ticle’s surface in EAN, a value which is only 30% lower than in the initial sample in water. Such a diminution of the lithium surface concentrations can result from an exchange with ethy-lammonium cations and/or from a modification of the surface charge by adsorption/desorption of the citrate anions.
The phase separation occurring here raises the question of the partition of the particles between the two phases according to their size. Indeed, given that the attractions between NPs increase largely with size, the threshold of the gas-liquid is
reached sooner for large nanoparticles than for small nanopar-ticles, if repulsions are of the same order, which leads to an enrichment on large NPs in the concentrated phase on poly-disperse samples. The size-sorting initially performed in water to prepare the samples13takes advantage of this phenomenon, stronger when the size distribution is larger27. The size dis-tribution can be determined from the magnetization curves if magnetic dipolar interactions are negligible25(see Figure 2 in SI). Here the same size distribution is obtained for the three samples Li-W, Li-EAN, Li-EAN-D, showing no detectable size-sorting. The initial size-sorting performed in water was thus sufficient enough to prevent any further size-sorting when transferred in EAN. This enables us to use the same form fac-tor for all samples in the Small Angle Scattering experiments presented hereafter for example. Further information can be extracted from the magnetization curve of the concentrated phase Li-EAN-C: at large magnetic fields, magnetization sat-urates and the volume fraction Φ = 23% is determined; at low magnetic fields, initial susceptibility χ is determined. Here χ =M/H=4.3, a very high value fully consistent with the whole set of previous measurements and theories28. It is characteris-tic of strong magnecharacteris-tic dipolar interactions.
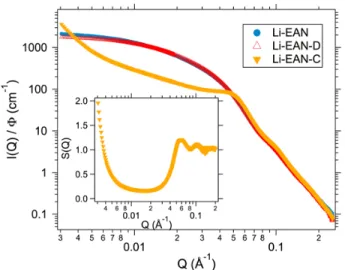
Fig. 2 SAXS intensity for the three samples with initial lithium counterions, Li-EAN, Li-EAN-D, Li-EAN-C. Inset: structure factor of the NPs in sample Li-EAN-C.
The structure on the nanoscale is studied both by SAXS and magneto-optic birefringence experiments. The SAXS intensi-ties plotted in Figure 2 show very similar curves for Li-EAN and Li-EAN-D that have a low volume fraction. They almost superimpose with the form factor (not shown on the Figure, see Figure 3 in SI), therefore their interparticle interactions are weak and particles are well dispersed. Note that the same result is obtained for all the separated samples that we ana-lyzed, the volume fractions of the dilute phase being always
Table 2 Sizes determined from different techniques for dilutes samples. Hydrodynamic radius Rbir
H extracted from the rotational
time (magneto-optic birefringence measurements), radius of gyration RGextracted from SAXS measurements, and RDLSH
extracted from DLS measurements (see text for details). All values are in nanometers. Φ* is the threshold volume fraction of phase separation. Sample Φ (%) RbirH RG RDLSH Φ* (%) Li-EAN 0.46 16± 2 16± 3 23 ± 3 ∼ 1 Li-EAN-D 1.06 19 ± 2 13 ± 3 17± 2 / Na-EAN 2.3 16± 2 13 ± 3 16± 2 ∼ 4 EA-EAN 0.17 17± 2 13 ± 3 19± 2 ∼ 4
Fig. 3 Normalized intensity versus time extracted from magneto-optic birefringence experiments on the three lithium samples in EAN presented in Table 1.
of the order of 1% and the volume fraction of the concentrated phase around 25%. The concentrated phase presents a corre-lation peak, whose position Q∗= 0.06 ˚A−1can be determined from the structure factor (inset of Figure 2). The associated distance 10.5 nm = 2π/Q∗is close to the particle’s mean di-ameter, meaning that the most probable distance is the contact between NPs. Also S(Q) reaches moderate values at the small-est Q’s, demonstrating that the density fluctuations within the sample remain weak. An increase of S(Q) when going toward low Q’s can come either from a system for which interactions between NPs are attractive on average or from the formation of aggregates. However, in the case of formation of aggregates, a strong divergence of the intensity with a power law char-acteristic of the fractal dimension of the aggregates would be observed, contrarily to what is obtained. The structure factor measured, showing both weak density fluctuations and limited bonding between objects (likely reversible), is then character-istic of NPs interacting through weakly attractive potentials, as for example sticky hard spheres, in accordance with the
servation of a macroscopic gas-liquid phase transition. The second microscopic technique confirms these results. The hydrodynamic radii determined from the characteristic rotational times obtained by analyzing the relaxation of the magneto-optic birefringence are similar for the dilute samples Li-EAN and Li-EAN-D (see Figure 3 and Table 2). As ex-pected13, they are close to the radius of gyration RGdeduced
from SAXS measurements, given the error bars (see Table 2). On the contrary, a longer relaxation time is observed for the concentrated sample Li-EAN-C (see Figure 3). This slow-ing down can be interpreted as resultslow-ing either from hydro-dynamic domains or from the increase of the viscosity at high volume fraction, as already seen in monophasic concentrated systems in water29,30.
4
Tuning interaction potential with the nature
of the NPs counterions.
Fig. 4 Dynamic Light Scattering (DLS) : field correlation function G1as a function of time for dilute samples in EAN. Na-EAN: Φ=3.2
%; Li-EAN: Φ=0.46%; EA-EAN: Φ=0.17 %. Lines are the fits (see text for details).
Although the three initial counterions in water (sodium, lithium and ethyl ammonium) lead to the same qualitative macroscopic behavior, a detailed analysis points out a sig-nificant influence of the counterion on the gas-liquid transi-tion threshold Φ∗and on the microstructure of the samples. The volume fractions above which a phase separation occurs are shifted: Φ∗Li< Φ∗Na∼ Φ∗
EA (see Table 2). This raises the
question of the amount of cations at the nanoparticle’s surface, that may vary from a counterion to another. To answer it, the chemical determinations of sodium ions have been performed, similar to the ones presented in previous part for lithium ions, even if the analysis is more difficult with sodium as this el-ement is found everywhere as traces (filters, bottles....). The same conclusions are obtained : there are sodium cations close
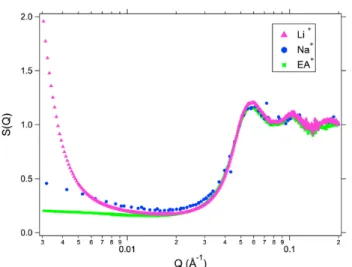
Fig. 5 Structure factors determined for the concentrated phases obtained after phase separation of the three samples with different initial counterions in water. Na+: SANS, Li+and EA+: SAXS.
to the nanoparticle’s surface, with a density per surface of the same order as for lithium cations presented in Table 1 (1 to 2 sodium per nm2), showing that both lithium and sodium cations (counterions in water) remain mostly close to the sur-face of the nanoparticles when these are transferred from wa-ter to EAN despite the much larger ethylammonium concen-tration. In the case of EA+counterions in the initial sample,
no information can be obtained on the interface in EAN.
Turning now to the microstructure, both DLS and magneto-optic birefringence have been performed at volume fractions lower than the destabilization threshold. Both techniques show a weak influence of the initial counterion on the mi-crostructure (See DLS in Figure 4, birefringence is not shown, and the deduced hydrodynamical radii are in Table 2).
Above the threshold of phase separation, birefringence and SAXS measurements on the dilute phases (see Figures 4 and 5 of SI) show well dispersed particles with weak interpar-ticle interaction. The SAXS measurements on the concen-trated phases, whose volume fraction always lies around 25%, are plotted in Figure 5. A peak corresponding to the con-tact distance between particles is observed whatever the ini-tial counterion in water. However the SAXS scattering curves highly differ at low Q’s in Figure 5 with SEA< SNa< SLi at
Q= 3 10−3 A˚−1, an order which is compatible with the gas-liquid transition thresholds Φ∗of table 2. These results evi-dence the influence of the initial counterion on the interparti-cle potential in EAN.
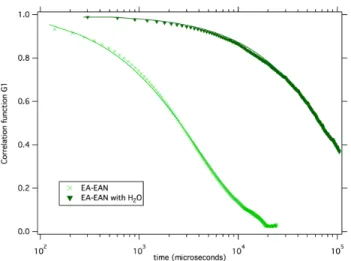
Fig. 6 Dynamic Light Scattering (DLS) : field correlation function G1as a function of time for dilute samples in EAN. EA-EAN:
Φ=0.17 % and the same sample with ∼ 5% of added water.
5
Tuning the interparticle potential with the
water content
We probe in this part the influence of the water content in the solvent, since water is known to strongly modify the prop-erties of ionic liquids based systems. Moreover, despite its seemingly low concentration, the water present in our systems can already cover the whole solid/liquid interface with a water monolayer. Indeed, for the particles used here, considering a NP concentration Φ = 1% and an average thickness of 0.3 nm for a water monolayer, it can be easily calculated that a water volume fraction of 0.13% could cover the entire solid/liquid interface. Water can thus highly affect the solid/liquid inter-face depending on its localization. Such H2O concentration
matches very closely the amount of water already present in the EAN into which the nanoparticles are transferred. It is therefore highly probable that the same H2O content is also
present in the ferrofluids obtained in EAN after freeze-drying, that we call in the following the ”dry” state.
Starting from this dry state, water is added in the different ”dried” dispersions in the dilute regime, either with a pipette or by placing the sample in a humid atmosphere in order to progressively add the water (added amounts are 5%, 10%, 20% in volume). Both routes lead to the same results. The behaviors are very ion-dependent :
- For dispersions with Li+ and EA+ counterions, macro-scopic flocculation is observed for all amounts of water added. Large aggregates with hydrodynamic radii around 500 nm ap-pear, which are evidenced by the presence of long correlation times in DLS experiments as soon as few percents of water are added (see Figure 6). These processes of aggregation are irre-versible as aggregates do not redisperse if water is removed.
- Dispersions with Na+ counterions appear stable and monophasic up to 10% of added water, DLS showing no sig-nificant evolution of its temporal relaxation from the initial ”dry” sample. However for 20% of added water, a macro-scopic gas-liquid separation is observed, as confirmed by op-tical microscopy. The threshold for such gas-liquid transition can be decreased down to lower content of added water by applying a magnetic field, that increase overall attractions be-tween NPs, since the gas-liquid phase separation occurs what-ever the quantity of added water under magnetic field.
The water content thus appears as a physicochemical pa-rameter that has a huge impact on the interparticle potential, with a complex interplay with the nature of the counterion initially present in water, as it may lead either to irreversible aggregation for some counterions or to stable reversible gas-liquid transition for others. It can then be used as a power-ful parameter to tune the interactions in the system, with re-spect to its influence and its ease of implementation, but must be taken with great care if irreversible aggregation has to be avoided.
6
Discussion
The results presented above demonstrate that drastic modifi-cations of the microstructures are induced through the three following parameters explored: (i) the size of the particles, (ii) the nature of the initial counterion in water, which at least partially remains close to the solid/liquid interface, (iii) the amount of water in the ionic liquid. The two first ones can gently tune the interparticle potential from repulsive to attrac-tive to modify the structure from well-dispersed nanoparticles to diphasic systems thanks to a gas-liquid like phase transi-tion. The amount of water also tune the interparticle poten-tial to attractive but has a stronger influence at it may lead to dispersions of aggregated (and even flocculated) NPs, except when the initial counterion is Na+for which gas-liquid tran-sitions are still obtained up to 10 vol% of added water. This already demonstrates that many parameters influence the in-terparticle potential, with a complex interplay between them. These parameters are not always controlled in the systems de-scribed in literature, which could explain the diversity of re-sults reported. It also indicates that a precise control of the composition is necessary in order to be able to tune the mi-crostructure of the dispersions in EAN, and more generally in any Ionic Liquid. Such a control enables to obtain gas-liquid transition instead of irreversible aggregation and highly stable concentrated dispersions can be prepared.
6.1 Interparticle potential between nanoparticles There are different kinds of contributions to the interparticle potential.
First, as in every colloidal suspension of magnetic nanopar-ticles, dipolar magnetic interaction in zero magnetic field adds, on average, a soft and long-ranged attractive tail to the van der Waals attraction. Both kinds of interactions are size-dependent. Increasing the mean diameter from 7 nm in our previous work13 up to 11 nm in the current work leads to van der Waals attractions twice larger and to magnetic dipo-lar interaction at least 20 times dipo-larger at a typical interparticle distance of 1 nm from surface to surface (both being there ∼ 1 − 2 kT ). At larger interparticle distances, magnetic dipo-lar interaction then dominates van der Waals with an attraction range at least of the order of 3-4 nm.
The ability to obtain stable dispersions definitely proves that an interparticle repulsion counterbalancing the attraction ex-ists in our systems. However, the origin of this repulsion is not obvious and will be discussed later. We remind just here that it is not a steric one due to polymer or surfactant, and that it originates only in the ionic liquid and the cationic coun-terions initially present in water. In our previous study with 7 nm particles13, we have shown that for Na-dispersions, re-pulsion and attraction were of the same order of magnitude. Indeed, the overall potential that enabled to fit the structure factor was a weakly repulsive Yukawa potential with an am-plitude of 0.32kT with a range of 3.5 nm. It is obviously diffi-cult to predict the evolution of the repulsion with the particles size in EAN and we shall assume that the present increase of the NPs size does not sensibly modify its order of magnitude (see discussion about repulsions later on).
The observation here of gas-liquid like transitions gives strong information on the shape of the overall interparticle po-tential. Indeed, gas-liquid phase separations are predicted and observed in literature with potentials with a weak secondary minimum of the order of a few kT associated to an attraction whose range is larger than one third of the NPs diameter14. It corresponds here to a range larger than 3-4 nm fully com-parable to that of dipolar magnetic interaction. Indeed, rather slight modifications of the contributions to the potential can thus either lead to - larger depth of the secondary minimum (and/or shorter range of the attraction) bringing flocculation or - to a reduced depth of the secondary minimum with pre-vailing monophasic dispersions.
The nature of the initial counterion in water necessarily in-fluences the interparticle repulsion, as the threshold of gas-liquid phase separation is shifted while changing the counte-rion at constant nanoparticle size (thus at same attraction part of the potential). The modification of the interparticle repul-sion remains however moderate given that stable suspenrepul-sions or coexisting gas-liquid phases are always obtained, meaning that the depth of the overall attractive potential is in all cases at most a few kT .
On the contrary, the addition of water may strongly decrease the contribution of repulsion to the overall interparticle
poten-tial as it leads to flocculation in many cases. In the case of Na+counterions, tuning the quantity of added water allows to tune the concentration threshold of phase separation and thus to finely tune the interparticle potential.
6.2 Origin of repulsions in the system
As the behaviors obtained with sodium, lithium and ethyl am-monium counterions differ and as sodium and lithium are seen to be close to the solid/ionic liquid interface, at least part of the repulsion comes from the interface. We emphasize that an in-fluence of the solvent far from the particles is unlikely as the amount of additional ions is very low compared to the con-centration of the EAN ions. A structuration as ”layers” on the solid/liquid interface can thus be involved as seen in reflectiv-ity31,32, AFM/STM33–35or numerical simulations36–39, how-ever such studies were carried out on pure ionic liquids (no added ions). The interaction range determined above would correspond to a modification of the ionic liquid on 6-7 layers around the particles. Although long ranged, such layerings have been observed on flat surfaces in literature.
The nature of the initial counterion in water could thus in-fluence the organization of the solid/ionic liquid interface in relation to their size and/or to their hydration. Some remaining residual water could also be present, which is very difficult to directly detect given the very small water amounts. However, if these cations increase or decrease the interfacial layering, they directly modify the interparticle repulsion and thus the total potential. The recent study on nitrate salts in EAN40
ev-idences a slight structure-breaking effect of LiNO3on EAN,
which is consistent here with the reduced repulsion obtained in the case of lithium initial counterions, compared with ethyl ammonium initial counterions.
The influence of the added water strongly depends on the nature of the initial counterion in water, however it always leads here to a decrease of the interparticle repulsion. This evolution cannot result from a removal of the initial cation from the solid/liquid interface. If this was the case, no dif-ference between the three cations would occur. Let us now translate the added water amounts into molecules ratios. The amounts of 5 vol%, 10 vol% and 20 vol% of added water cor-respond respectively to 21%, 36% and 55% water molecules in the solvent. Although large, these proportions are far from the classic situation of a molecular solvent as water with added salt (1 mol/L of EAN in water corresponds to 98 % of water molecules). In these mixtures, structure modifications can be induced by the water molecules. Indeed water is known to modify the interactions between imidazolium cation in pure ionic liquids41 for example. Also the water/EAN mixture (55% volume water) has a structure rather different from pure EAN42. In colloidal dispersions, a macroscopic flocculation due to water addition has been reported several times9,16,17,43,
however not systematically in all the systems10. The work
re-ported in9furthers the role of water, using AFM between a large silica sphere (4.8 µm) and a wafer. The force profile measured is repulsive in pure EAN and less repulsive while adding water. This is fully consistent with our structure mea-surements which mean that the water probably decreases the layering close to the solid surface thus decreasing the repul-sive part of the interparticle potential.
6.3 Overview on the phase diagram
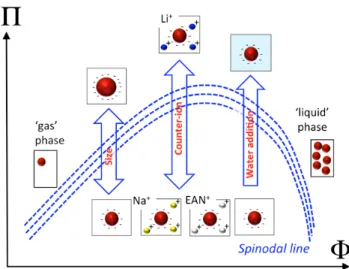
Fig. 7 Scheme of the phase diagram for the colloidal dispersions in EAN studied here summarizing the different control parameters of the interparticle potential and their influence.
Finally the possible tuning of the interparticle potential can be summarized on Figure 7. In the phase diagram osmotic pressure Π - volume fraction Φ, a binodal line separates the monophasic area from the gas-liquid area. Increasing the NP’s size will move the Π(Φ) binodal curve in the diagram. This moving up can be also induced by changing the nature of the counter-ion or by adding water, which modifies the organiza-tion of the solid/liquid interface. If this modificaorganiza-tion is too large, the repulsion is no longer sufficient to keep dispersed particles and floculation occurs.
7
Conclusion
The present work focused on colloidal dispersions in EAN ob-tained by transfer from water to EAN of magnetic maghemite nanoparticles, initially stabilized in water thanks to electro-static interactions. Several control parameters in the initial aqueous dispersion enables the fine tuning of the resulting dispersions in EAN. The first parameter is the chosen parti-cle’s size which enables here to get dispersions up to a
vol-ume fraction of 25% in EAN thanks to a gas-liquid like phase separation, due to the strong magnetic dipolar interaction. The second parameter is the nature of the initial counterions in water, which stay close to the solid/ionic liquid interface and modify the threshold of the gas-liquid phase separation. This is an indirect proof that the repulsion is strongly influ-enced by the interface, probably through its spatial organiza-tion on typically 6-7 layers of ionic species. The third pa-rameter is the amount of added water, which also modifies the interparticle repulsion, modification strongly modulated by the initial cation. The results enlighten the weakness of the resulting interparticle potential, and the drastic influence of all the physico-chemical parameters involved in the sys-tem, especially at the solid/ionic liquid interface. In particu-lar a specificity of ions in EAN is shown, simiparticu-lar to the spe-cific effects in water (Hofmeister series). Significant progress could be made with studies of the composition and organiza-tion of the nanoparticle/liquid interface with experiments such as ASAXS (anomalous SAXS) to extract the distribution of initial counterions around the nanoparticles.
8
Acknowledgments
We thank Aude Michel and Delphine Talbot for technical assistance in the particle synthesis and ion determinations, Sawako Nakamae for the magnetization measurement with the Squid, Florian Meneau for technical assistance on the line Swing (Synchrotron Soleil France), Jean Chevalet for birefrin-gence measurements. We acknowledge funding from the ANR TEFLIC, as well as the region Ile de France (Incoline Project). Marianna Mamusa received a PhD grant by the Emergence-UPMC 2010 research program.
References
1 T. Torimoto, T. Tsuda, K. Okazaki and S. Kuwabata, Advanced Materials, 2010, 22, 1196–1221.
2 M.-A. Neouze, M. Kronstein and F. Tielens, Chem. Commun., 2014, 50, 10929.
3 Z. Li, Z. Jia, Y. Luan and T. Mu, Current Opinion in Solid State and Materials Science, 2008, 12, 1–8.
4 Q. Zhang, S. Zhang and Y. Deng, Green Chemistry, 2011, 13, 2619–2637. 5 H. Yang, C. Yu, Q. Song, Y. Xia, F. Li, Z. Chen, X. Li, T. Yi and C. Huang,
Chemistry of Materials, 2006, 18, 5173–5177.
6 K. Ueno, A. Inaba, M. Kondoh and M. Watanabe, Langmuir, 2008, 24, 5253–5259.
7 N. Jain, X. Zhang, B. S. Hawkett and G. G. Warr, ACS Applied Materials & Interfaces, 2011, 3, 662–667.
8 L. Rodr´ıguez-Arco, M. T. L´opez-L´opez, F. Gonz´alez-Caballero and J. D. Dur´an, Journal of Colloid and Interface Science, 2011, 357, 252–254. 9 J. A. Smith, O. Werzer, G. B. Webber, G. G. Warr and R. Atkin, The
Journal of Physical Chemistry Letters, 2010, 1, 64–68.
10 F. C. C. Oliveira, L. M. Rossi, R. F. Jardim and J. C. Rubim, The Journal of Physical Chemistry C, 2009, 113, 8566–8572.
11 M.-A. Neouze, Journal of Materials Chemistry, 2010, 20, 9593–9607.
12 M. Mamusa, J. Siriex-Pl´enet, F. Cousin, E. Dubois and V. Peyre, Soft Matter, 2013, 10, 1097–1101.
13 M. Mamusa, J. Siriex-Pl´enet, F. Cousin, R. Perzynski, E. Dubois and V. Peyre, J. Phys.: Condens. Matter, 2014, 26, 284113.
14 N. Verhaegh and H. Lekkerkerker, in Phase transitions in colloidal sus-pensions, ed. F. Mallamace and H. Stanley, IOS Press, 1997, vol. 134, pp. 347–381.
15 V. Peyre, O. Spalla, L. Belloni and M. Nabavi, J. of Coll. and Int. Sci., 1997, 187, 184–200.
16 E. Vanecht, K. Binnemans, S. Patskovsky, M. Meunier, J. W. Seo, L. Stap-pers and J. Fransaer, Phys. Chem. Chem. Phys., 2012, 14, 5662–5671. 17 G. Clavel, J. Larionova, Y. Guari and C. Gu´erin, Chemistry - A European
Journal, 2006, 12, 3798–3804.
18 N. Benlhima, D. Lemordant and P. Letellier, Journal de Chimie Physique et de Physico-Chimie Biologique, 1989, 86, 1919–1939.
19 R. Kanzaki, K. Uchida, S. Hara, Y. Umebayashi, S.-I. Ishiguro and S. No-mura, Chemistry Letters, 2007, 36, 684–685.
20 K. Fumino, A. Wulf and R. Ludwig, Angewandte Chemie International Edition, 2009, 48, 3184–3186.
21 D. F. Evans, A. Yamauchi, R. Roman and E. Z. Casassa, Journal of Col-loid and Interface Science, 1982, 88, 89–96.
22 E. Dubois, V. Cabuil, F. Bou´e and R. Perzynski, J. Chem. Phys., 1999, 111, 7147–7160.
23 E. Hasmonay, E. Dubois, J. Bacri, R. Perzynski, Y. Raikher and V. Stepanov, Eur. Phys. J. B, 1998, 5, 859–867.
24 J.-C. Bacri, R. Perzynski, D. Salin and J. Servais, Journal de Physique, 1987, 48, 1385–1391.
25 Magnetic Fluids and Applications Handbook, ed. B. Berkovski, Begell House Inc. Publ. New York, 1996.
26 G. Perron, A. Hardy, J.-C. Justice and J. E. Desnoyers., Journal of Solu-tion Chemistry, 1993, 22, 1159–1178.
27 R. Massart, E. Dubois, V. Cabuil and E. Hasmonay, J. Magn. Magn. Mat., 1995, 149, 1–5.
28 G. M´eriguet, E. Wandersman, E. Dubois, A. Cebers, J. de An-drade Gomes, G. Demouchy, J. Depeyrot, A. Robert and R. Perzynski, Magnetohydrodynamic, 2012, 48, 415–426.
29 G. M´eriguet, E. Dubois, V. Dupuis and R. Perzynski, J. Phys. Cond. Mat-ter, 2006, 18, 10119–10132.
30 E. Wandersman, V. Dupuis, E. Dubois and R. Perzynski, Phys. Rev. E, 2009, 80, 041504.
31 M. Mezger, H. Schr¨oder, H. Reichert, S. Schramm, J. S. Okasinski, S. Sch¨oder, V. Honkim¨aki, M. Deutsch, B. M. Ocko, J. Ralston, M. Ro-hwerder, M. Stratmann and H. Dosch, Science, 2008, 322, 424–428. 32 M. Mezger, S. Schramm, H. Schr¨oder, H. Reichert, M. Deutsch, E. J. D.
Souza, J. S. Okasinski, B. M. Ocko, V. Honkim¨aki and H. Dosch, J. Chem. Phys., 2009, 131, 094701.
33 R. Horn, D. Evans and B. Ninham, J. Phys. Chem., 1988, 92, 3531. 34 R. Hayes, G. G. Warr and R. Atkina, Phys. Chem. Chem. Phys., 2010, 12,
1709–1723.
35 Y. Yokota, T. Harada and K. ichi Fukui, Chem. Commun., 2010, 46, 8627– 8629.
36 J. Vatamanu, O. Borodin and G. D. Smith, J. Am. Chem. Soc., 2010, 132, 14825–14833.
37 G. Feng, R. Qiao, J. Huang, S. Dai, B. G. Sumpterb and V. Meunierc, Phys. Chem. Chem. Phys., 2011, 13, 1152–1161.
38 R. Hayes, S. Imberti, G. G. Warr and R. Atkina, Phys. Chem. Chem. Phys., 2011, 13, 3237–3247.
39 Q. Dou, M. L. Sha, H. Y. Fu and G. Z. Wu, J. Phys. Cond. Matt, 2011, 23, 175001.
40 R. Hayes, S. A. Bernard, S. Imberti, G. G. Warr and R. Atkin, J. Phys. Chem. C, 2014, 118, 2121521225.
41 A. Mele, C. D. Tran and S. H. D. P. Lacerda, Angew. Chem. Int. Ed., 2003,
42, 4364–4366.
42 R. Hayes, S. Imberti, G. G. Warr and R. Atkin, Angew. Chem., 2012, 124, 7586–7589.
43 J. C. Rubim, F. A. Trinidade, M. A. Gelesky, R. F. Aroca and J. Dupont, Journal of Physical Chemistry C, 2008, 112, 19670–19675.
![Table 1 Li-based samples: volume fraction Φ, total lithium concentration [Li] tot , free lithium concentration [Li] f ree , number of lithium per surface on the nanoparticles Li + /nm 2 (see text for details).](https://thumb-eu.123doks.com/thumbv2/123doknet/13184936.391504/5.918.58.424.574.690/samples-fraction-lithium-concentration-lithium-concentration-lithium-nanoparticles.webp)