HAL Id: halshs-02922543
https://halshs.archives-ouvertes.fr/halshs-02922543
Submitted on 26 Aug 2020HAL is a multi-disciplinary open access archive for the deposit and dissemination of sci-entific research documents, whether they are pub-lished or not. The documents may come from teaching and research institutions in France or abroad, or from public or private research centers.
L’archive ouverte pluridisciplinaire HAL, est destinée au dépôt et à la diffusion de documents scientifiques de niveau recherche, publiés ou non, émanant des établissements d’enseignement et de recherche français ou étrangers, des laboratoires publics ou privés.
The geography of maritime networks: A critical review
César Ducruet
To cite this version:
César Ducruet. The geography of maritime networks: A critical review. Journal of Transport Geog-raphy, Elsevier, 2020, 88, pp.102824. �10.1016/j.jtrangeo.2020.102824�. �halshs-02922543�
The geography of maritime networks: A critical
review
César Ducruet
French National Center for Scientific Research (CNRS), UMR 8504 Géographie-Cités, Paris, France cdu@parisgeo.cnrs.fr
Pre-final version of the article published in Journal of Transport Geography, volume 88 (2020)
Abstract
Despite early cartographical and graph-theoretical analyses of maritime flows in the 1940s and 1960s, it is only from the 2000s onwards that maritime network analysis had grown apace, backed by newly available shipping data, increased computational power, and renewed conceptual frameworks to study networks in general. The evolution of maritime network analysis, in geography and other sciences, is marked by a wide diversity of methods and themes, which we classify into three main parts. We first present studies looking at maritime flows in an abstract space, focusing on operational, statistical, or managerial aspects where navigation, graph structure, and firms' strategies are the key concerns. Second, we review researches where maritime flows and networks are markers and vectors of wider geo-economic structures and dynamics, such as regional inequalities and areas of dominance. Lastly, maritime networks have also been considered as integral parts of territories and wider chained systems, such as urban networks, regional networks, and coupled networks. We conclude that network analysis and maritime transport still share many uncovered areas and discuss potential research pathways for future works.
Keywords: Complex networks; Flows; Graph theory; Maritime transport; Network science ; Ports ; Transport networks
1. Introduction: the relational perspective in maritime studies
“Water, water, everywhere, and not any drop to drink” (Samuel Taylor Coleridge)
Maritime transport in general can be considered as one of the most ancient vectors of human interaction in history. It is often recalled that maritime transport carries more than 90% of international trade volumes, as continents, being separated by water, no other means may endorse such a function. The UNESCO estimated at 60% the share of world population living at less than 60 km from the coasts. Yet, maritime transport still occupies today a rather secondary rank in geography and other sciences, in the way the world is understood. Maritime transport remains a specialization of several disciplines, such as maritime geography, maritime history, and maritime economics.
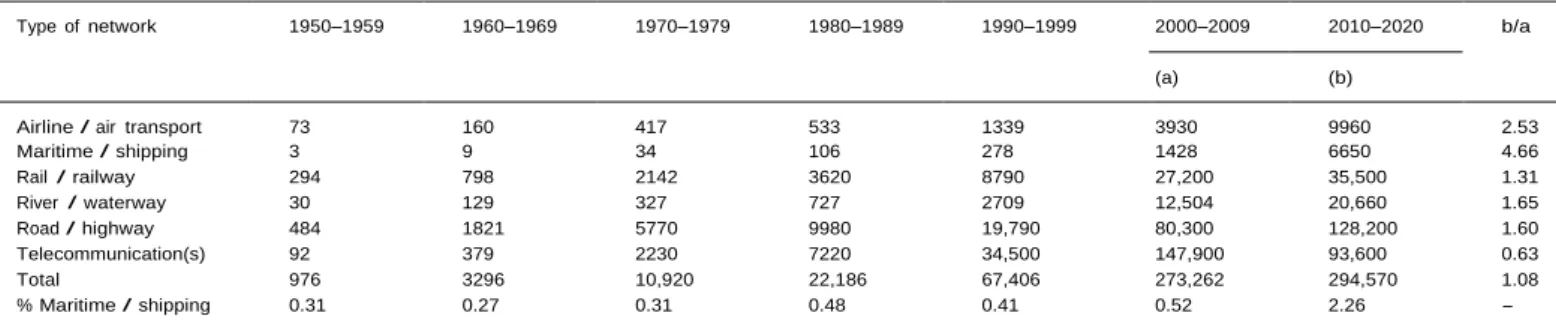
The total number of network-related publications by transport mode provides a concrete and striking evidence of such a trend, between 1950 and 2020 (Table 1).1 Maritime network analysis has remained in the
shadow of other transport networks, from 0.31% to 2.26% of total publications. The importance of land-based communication systems (road, railway, and river) and of telecommunications is overwhelming and constant over time, followed by airline network. Despite the near absence of maritime network studies in the early decades and its lowest weight currently, this category recorded the highest growth rate between the last two decades. This panoramic view based on simple numbers leads us to ask three main questions to be tackled in this article. Why has maritime network analysis remained such a small subfield of transport studies? What are the major themes and issues addressed, especially in relation with space? Can the drivers of its recent surge be identified? We discuss here the first question, while the rest of the paper reviews the evolution of maritime network analysis, classified into subthemes. In conclusion, we question how maritime network analysis contributed to network analysis and maritime studies in general, as well as possible further research pathways.
Table 1. Number of publications on transport networks, 1950–2020.
Source: own elaboration based on Google Scholar (accessed: July 2020).
Type of network 1950–1959 1960–1969 1970–1979 1980–1989 1990–1999 2000–2009 2010–2020 b/a
(a) (b)
Airline / air transport 73 160 417 533 1339 3930 9960 2.53
Maritime / shipping 3 9 34 106 278 1428 6650 4.66 Rail / railway 294 798 2142 3620 8790 27,200 35,500 1.31 River / waterway 30 129 327 727 2709 12,504 20,660 1.65 Road / highway 484 1821 5770 9980 19,790 80,300 128,200 1.60 Telecommunication(s) 92 379 2230 7220 34,500 147,900 93,600 0.63 Total 976 3296 10,920 22,186 67,406 273,262 294,570 1.08 % Maritime / shipping 0.31 0.27 0.31 0.48 0.41 0.52 2.26 –
Various reasons converge to explain the low significance of maritime network analysis seen in Table 1, which can be classified as follows. One first reason is about the nature and function of the ocean. The ocean space is traditionally seen as being “empty of men” (Frémont, 1996) and as an “empty territory” (Corbin, 2010). The absence of a tangible infrastructure, contrary to road and railway networks, as well as its scale beyond regional and national planning systems, tended to blur its understanding as a coherent entity (White and Senior, 1983; Rodrigue, 2020). In history and area studies, seas and oceans are most often seen as obstacles and divisions rather than interfaces (Bentley, 1999; Lewis and Wigen, 1999). Another factor is modal substitution, as air transport absorbed the vast majority of transcontinental passenger flows as well as a significant share of international trade value. This state of affairs may relate to the “cargo” dimension of maritime transport, while other modes are closer to the “passenger” dimension, i.e. more concerned with people's mobility. Although a debate still lingers on about the resilience of port-city relationships to contemporary changes in shipping and port operations (Hall and Jacobs, 2012), the port-city separation has often been seen as an ineluctable process, resulting in waterfront redevelopment, lower port economic impacts, and fading maritime culture (Hoyle, 1989).
A second reason relates more with the evolution of academic research itself. An analysis of about 400 port-related articles published in geography journals between 1950 and 2012 concluded to a fading interest in ports from human geographers and from port geographers in human geography (Ng and Ducruet, 2014). Initially strong links between transport geography and urban, economic geographic gradually lost ground (Hall et al., 2006; Keeling, 2007; Shaw and Sidaway, 2011). Throughout network analysis, transport networks constituted the basic material for geographers to study cities through the lenses of graph theory back in the 1960s. Yet, such networks were dominantly planar, technical networks made of physical infrastructure, such as roads and railways, until such analyses were extended to airlines and multinational firms' networks in the 1990s. As underlined by Lemarchand (2000), “the literature on networks generally ignores ports”, although the vocabulary of maritime geography recalled in many ways the network dimension, ports belonging to a “constellation” (Perpillou, 1959), maritime routes being “arteries” (Vigarié, 1968), and shipping being organized in lines, buckles, paths, hubs, and cycles. This dimension had been particularly made evident by Fleming and Hayuth (1994) in their work on centrality and intermediacy, a
transport hub being more or less well embedded within the services of actors and accessible to/from markets. Despite the importance of understanding the changing structure of maritime networks and the position of ports in such networks (De Langen et al., 2002), indicators of connectivity long existed for airports but not for ports (De Langen et al., 2007). Another possible factor is the lack of maritime data so that a precise cartography and network analysis of maritime transport could not have been possible. As rightly argued by Robinson and Chu (1978), “the integration of any port into a shipping network is not easily defined, largely because of the lack of accurate data on the serial movements of ships”. Nevertheless, the behavioral turn motivated transport geographers to shift their attention from quantitative to more qualitative research, leaving behind graph theory and other statistical tools.
Third, the diversity of definitions may be another reason behind the relative scarcity of maritime network analyses, at least until the 2010s. The maritime network may refer to ancient circulations (anthropology), merchant trading routes (maritime history), maritime tactical networks (naval strategy), alliance networks between shipping lines (maritime economics), port networks of ocean carriers (maritime geography), vessel trajectories (maritime engineering), or routes and maritime flows created by the aggregation of vessel movements, the most common definition. Some authors even proposed to consider the maritime network as a road network made by the juxtaposition of vessels (Baird, 2010). Parent concepts are also used to describe maritime networks, such as maritime system and maritime foreland. The maritime system refers to what Bird (1984) considered as an “ultimate stage” of maritime transportation whereby any port may in theory connect any other ports. It was also approached by Rodrigue et al. (1994) as a conceptual background linking containerization diffusion, transport networks, spatial cycles, and world economic development.
Lastly, port geographers have mainly focused on hinterlands. The port system concept is one major pillar of port geography (Ng et al., 2014), originating from the work of Taaffe et al. (1963) about the evolution of transport corridors and related port hierarchies in West Africa. Rimmer (1967) rightfully argued that port system studies were too much preoccupied by land transport issues, neglecting the role of maritime linkages between ports (see also the mercantile model of Vance, 1970). Yet, “the spatial structure of the links between ports and their forelands was not addressed in Rimmer's study” (Helmick, 1994). The parent concept of “maritime range” (or port range) gave birth to very influential works on North Europe (Vigarié, 1964) and the Northeast US megalopolis (Gottmann, 1961) but still focusing mainly on hinterlands, the principal focus of transport geographers. Ng and Ducruet (2014) counted that out of their 400 reviewed articles, only 7 mentioned foreland, against 29 for hinterland. Among the articles mentioning “network”, 5 focused on maritime networks, other ones being more about river networks and hinterlands. Since the initial work of Weigend (1956) on the matter, the French geographer Vigarié (1979) proposed the concept of “port triptych”, putting in relation the port itself, its hinterland, and its foreland. Hinterland connectivity is commonly perceived as the driving factor in port competition, given the higher cost of land transport and the inland shift of port functions in the last decades or so (Van Klink, 1998; Notteboom and Rodrigue, 2005). Despite the increasing importance of the concepts related with “chain”, such as value, supply, logistics, and commodity chains, literature on such topics remained more theoretical or qualitative than empirical or quantitative, the maritime leg being only one segment of a wider entity (Robinson, 2002).
The remainders of this article are organized as follows. We first present the evolution of the maritime network concept through three successive steps: mapping traffic densities, measuring graph topologies, and understanding firms' strategies. Such works have in common to neglect the spatial dimension of maritime networks. The second section reviews studies that considered maritime flows and networks as markers and vectors of spatial structures and dynamics, looking at the emergence of hubs and of densely connected clusters of ports. Lastly, the third section presents studies having considered maritime networks as integral parts of wider territorial structures, in relation to urban development, regional socio-economic development, and multiple networks. We conclude that network analysis and maritime transport still share many uncovered areas and discuss potential research pathways for future works.
2. From maritime flows to maritime networks
In this section, we investigate the evolution of the maritime network concept. The reviewed studies have in common to leave behind the territorial embedding, being more interested in the morphology of maritime flows (Section 2.1), the topology of the graph made of nodes and links (Section 2.2), or the strategies of shipping firms (Section 2.3).
2.1. The morphology of maritime routes
Recently in geophysics, was deplored a lack of knowledge about the precise distribution of vessels around the globe, the density of vessels and its temporal evolution (Tournadre, 2014). However, the cartography of maritime flows existed long ago, before their analysis as a network. In their review of “geographies of maritime transport”, Wilmsmeier and Monios (2020) found that books on maritime geography date back as far as 1815 with the works of Tuckey, followed by the important contribution of Hardy in 1941 and especially Couper (1972) with the description of trade routes and networks at the time. Until the 19th century, maritime information mainly consisted in representing the shape of coastlines, the rest being the knowledge of port locations and times at sea. From the 19th century to the 1940s emerged maps of regular lines serving the world oceans. To our knowledge, the first map ever made using actual shipping data is the one of Siegfried (1940), a French political geographer, representing the distribution of British Navy ship positions on the globe in 1937, allowing to relate the density of flows with the pattern of international trade. Some years later, the US geographer Ullman (1949) proposed to “take the pulse of world trade and movement” by mapping the United States' foreign maritime trade. Another French geographer, Bertin (1973), provided two maps of maritime wheat flows in Modern Europe, comparing graph and flowmap: “It does not suffice to trace the itineraries taken in reality to represent a system of relations. A map of maritime routes, even weighted, does not show the commercial orientation of urban centers. It shows the density of ships at sea. Maritime relations among cities only appear in their diversity, weight and geographic orientation when each relation, although maritime, is represented by a straight line”. Another way to look at maritime flows had been the focus on maritime forelands, whereby overseas flows to/from a given port (or a set of ports) is examined in terms of their geographic distribution. Such studies have been particularly rich between the 1950s and the 1970s, followed by rapid decline (see Appendix 1). Overseas market shares had been another way to compare ports and understand their comparative advantages as well as their specialization, using another dimension than the sole port throughput. However, geographers invested in such studies did not apply network analysis per se to their case study.
Subsequent visualizations in the 1970s used a world square grid to represent the density of vessel movements (McKenzie, 1975; Solomon et al., 1978), but putting the number of moves inside each square instead of a grayscale, making the mappings rather difficult to read. Until the 2000s and even later, general handbooks on maritime transport often represented global maritime routes in a broad manner with a varying line thickness between continents (Alexandersson and Gunnar, 1963). The most common approach has been to measure and visualize ship densities using grayscale, based on either radar or satellite data, converging to discuss the environmental impacts of shipping (see Halpern et al., 2008; Leonardi and Browne, 2010; Eyring et al., 2010; Vettor and Guedes, 2015). Other issues were explored at the more local level (Le Guyader et al., 2014; Etienne et al., 2015; Alessandrini et al.
2017), such as navigation risk, efficiency, planning, security, through the definition of vessel trajectories and the detection of outliers. Such approaches thus remained in the domain of operations research as a support to decision, in terms of environmental impacts of shipping for instance, backed by newly available data such as Automated Identification Systems (AIS). The extraction of millions of ship records or “big data of the past” allowed the analysis of climate change over centuries on the globe (Garcia-Herrera et al.,
2017) and the reconstitution of modern shipping routes (Wiegmans et al., 2020).
2.2. From graph theory to complex networks
The geography of transport networks, as said above, long focused on planar networks at the regional or national scale (Kansky, 1963; Haggett and Chorley, 1969). In their analysis of a scientific corpus, Danisch and Guillaume (2014) found that the term “global shipping network” stood apart from the semantic community “graph theory”, suggesting that maritime studies often referred to networks without adopting mathematical methods. Maritime networks are non-planar graphs, as links may cross each other without creating a node (Rodrigue, 2020). Topology relates with the overall structure of the graph made of nodes (vertices) and links (edges), a rather abstract space compared with the more common flowmap. The first application of graph theory to maritime transport comes from Robinson (1968) in his work on Vancouver's connections with other British Columbia ports, profoundly anchored in the spatial analysis movement (quantitative geography). His analysis was motivated by the search for the spatial organization of port functions within a network made of “imaginary routes”. This only case of a graph-theoretical analysis of maritime flows in the age of quantitative geography is by no means representative of the obsession of geographers with planar graphs at the time (Ducruet and Beauguitte, 2014). In the buoyant era of commodity flow analysis and spatial interaction modeling, only Simmons (1970) explicitly mentioned shipping, in his combined analysis of no less than twelve inter-provincial matrices Canada. Much later, two works applied the single linkage analysis algorithm to reveal the “nodal ports” that played a crucial role in Europe-US containerized trade (Marti, 1981; Marti and Krausse, 1983), also in the tradition of quantitative geography. Following two case studies on Eastern Canada (McCalla, 1986) and the Pacific (Dick and Rimmer, 1993), the PhD dissertation of Helmick (1994) on transatlantic container flows particularly insisted on the fact that the notion of hub-and-spokes “has yet to be systematically evaluated in the context of maritime space”. His analysis of the liner shipping network connectivity proved unsuccessful to catch the effects of route rationalization. Another PhD dissertation was again proposed, this time on the global scale and based on daily containership movement data (Joly, 1999). This work proposed new ways to look at port hierarchies, based on degree centrality (i.e. number of adjacently connected nodes per port), and to map inter-port or intercontinental flows to reveal the structure of the general pattern. It also measured the global network structure by means of the Alpha, Beta, and Gamma indices. Still in geography, another noticeable contribution is the work of McCalla (2004) on the Caribbean basin, referring to Robinson's (1998) model on hierarchical networks. It is, perhaps, the only explicit quantitative application of this model to date. The model (Fig. 1) is essentially based on the idea that ports are vertically connected, with a few large ports dominating many small ports. However, McCalla (2004) concluded that based on liner schedule data, “defining hierarchical structure is elusive”, due to the fact that perhaps, the study region lacks coherence in terms of economic integration.
The emergence of the complex network research field in the late 1990s led to a surge of interest for networks of all kinds, including maritime networks. While scale-free networks contain few large-degree nodes and many low-degree nodes (Barabasi and Albert, 1999) – as in the model of Robinson (1998) – small-world networks, in addition, include areas of dense interaction or “communities” (Watts and Strogatz, 1998). This new framework was particularly adapted to analyze large networks, in a context of newly available maritime data and increased computational power. The reinforcing hierarchy of scalefree networks, known as the rich-club effect (concentration of major links at the top of the hierarchy controlled by hubs) and the preferential attachment effect (connection of newly added nodes to already established hubs), however, had long been discussed qualitatively in maritime geography, albeit not systematically measured and demonstrated using dedicated network-analytical tools. Interestingly and to our knowledge, the first discussion on maritime hubs in scale-free maritime networks was proposed by an economist (Foschi, 2002). This paper particularly insisted on the spatial nature of the (Mediterranean) maritime
network, in terms of costs to create and maintain nodes and links, making it difficult to reach the extreme centralization suggested by the model. The first empirical application was proposed on the Mediterranean container shipping network (Cisic et al., 2007), but referring to Social Network Analysis (SNA) instead of complex networks. Although complex network analysis (CNA) borrowed numerous measures from existing frameworks such as graph theory (mathematics) and SNA (Kanrak et al., 2019), such as density, degree centrality, and betweenness centrality, it also provided new models and methods that were more robust.
Fig. 1. The maritime network model of Robinson.
Source: Robinson (1998).
The interest of physicists in maritime networks started with the work by Xu et al. (2007) on the Chinese case, paving the way towards a multiplication of related empirical works. The latter work was the first to discuss the effects of space-L and space-P topologies on network structure (Fig. 2). It concluded to an important influence of space, the structure of the maritime network being “somewhere between airline networks and railway networks” (see also Tian et al., 2007). The meaning of space for physicists is the influence of physical constraints (e.g. Euclidean distance) on node/link distribution and network evolution (Barthelemy, 2010). Network properties were actively researched at the global scale in the case of container shipping (Deng et al., 2009; Hu and Zhu, 2009) as well as solid bulkers and oil tankers (Kaluza et al., 2010; Cui, 2014), most of the time concluding to the existence of power-law characteristics in the distribution of degree centrality, a necessary condition for the network to be scale-free. The analysis of global maritime networks using such methods revealed important hidden information, such as the hierarchy of port centrality (Zhao et al., 2014), at different connectivity levels (Yu et al., 2017) and based on links rather than nodes (Zhang et al., 2018).
In parallel, engineers, economists, and geographers gradually adopted such a framework, mainly confirming the already observed scale-free and small-world macro-structure (Ducruet and Notteboom, 2012; Hu and Zong, 2013; Kang et al., 2014; Liu et al., 2018; Pan et al., 2019). Some of them discussed the effect of node aggregation at different scales (Tsiotas and Polyzos, 2018; Wang et al., 2019a), while others studied the global maritime network with the world region as the unit of analysis (Tran and Haasis, 2014; Li et al., 2015; Xu et al., 2015). A large body of literature focused on ranking ports by centrality indicators, introducing more or less novelty (Wang and Cullinane, 2008; Lam and Yap, 2011; Montes et al., 2012; Cullinane and Wang, 2012; Doshi et al., 2012; Gonzalez-Laxe et al., 2012; Freire Seoane et al., 2013; Wang and Cullinane, 2014; Kang et al., 2014; Bartholdi et al., 2016). Certain works, albeit not always referring to “complex networks” explicitly, pushed the analysis of port centrality one step further, by examining the interrelation between centrality and actual port throughput (Kim and Lu, 2015; Wang and Cullinane, 2016; Kang and Woo, 2017), combining network analysis with multiple regression and data envelopment analysis. Certain mathematicians and engineers did not refer to either SNA or CNA in their analysis of port connectivity (Jiang et al., 2015; Cheung et al., 2020) but rather, to the literature on port choice, network optimization, and hub location problems.
Fig. 2. Two main maritime topologies.
Source: Hu and Zhu (2009).
2.3. Firms' networks
Behavioral scientists supported the idea that maritime networks are reflections of firms' strategies and industry changes. This called for a disaggregated analysis at the firm level, contrary to graph theory that merged with each other all the different companies within a single system. Rather than maritime networks, geographers in fact studied port networks, i.e. the spatial distribution of ports belonging to the portfolio of a given shipping company. The geographers Pearson and Fossey (1983) provided a pioneer analysis from such a study angle. The main argument of Frémont and Soppé (2004) was that each major shipping line is geographically differentiated, this differentiation being the main element of its market power in a context of fierce competition. Such a posture stood against the traditional idea that shipping lines compete mainly through hinterland capture (cf. vertical integration). Geographic specialization was measured by means of assembling liner schedule data, allowing, in turn, to measure the weight and share of each company in the activity of each port of call. Additional works were made more specifically on Maersk (Frémont, 2007a) and the CMA-CGM (Frémont, 2015). Gadhia et al. (2011) confirmed the findings of Frémont (2007b) in a sense that the internationalization level of shipping companies is their main competitive advantage, as most of them – except the largest – rely on a home-based port network. These works confirmed previous work on South America (Guy, 2003) where global shipping lines set up their networks to serve growing local, North-South markets rather than to expand already existing East-West trunk lines. Other parent works focused on Asian companies like Evergreen and COSCON (Comtois and Wang, 2003; Rimmer and Comtois, 2005), offering a cartography of their services along the Europe-Asia route or in connection with China.
At two dates and in a comparative perspective between the Caribbean and the Mediterranean, McCalla et al. (2004) proposed an analysis of the networks before and after the formation of large shipping alliances, discussing the effects of route rationalization on the port hierarchy and the concentration of services. Alliance dynamics as well as mergers and acquisitions (horizontal integration) motivated several other works to analyze such effects in the Caribbean (McCalla et al., 2005; Veenstra et al., 2005), like the emergence of transshipment hub ports. The concentration of shipping lines at specific hubs was also analyzed. Frémont and Soppé (2005) demonstrated that shipping line concentration in Europe occured despite the stability of port throughput concentration. Ducruet et al. (2009) showed that North Korea's external shipping connections are differentiated according to the nationality of fleets and to the location of hubs. Wang et al. (2015) compared the port networks of British and Japanese fleets across Chinese ports in
the 1920s, while Metge and Ducruet (2017) compared the port networks of major shipping lines connectecting African ports, concluding to an uneven overlap.
Network effects between different industries were also analyzed (Parola and Veenstra, 2008; Soppé et al., 2009) as well as competition or cooperation networks in the shipping industry (Bergantino and Veenstra, 2002; Caschili et al., 2014), with reference to network theory and social network analysis. Firms' networks in the maritime world were also approached from a world city network perspective (Verhetsel and Sel, 2009; Jacobs et al., 2011), highlighting the position or centrality of maritime cities depending on the location of the headquarters and branches of insurers, brokers, bankers, lawyers, and shipowners. Certain dissimilarities with the global port hierarchy could have been underlined, London and New York being important maritime cities for services but not anymore the largest ports. Certain places such as North Germany were explored at the local level, using SNA to analyze innovation dynamics within “maritime clusters” (Bentlage et al., 2014)
3. Spatial structures and dynamics of maritime networks
In this section, we investigate how maritime networks can be markers and vectors of wider phenomena, beyond their sole topological and economical dimension (cf. previous Section 2). Here we understand maritime networks as imprints of territorial patterns. Which spatial structures and dynamics can maritime networks reveal? Are those structures and dynamics specific to the maritime sector? First, the focus will be on the interplay between hubs and spatial inequalities (Section 3.1), followed by a discussion on the emergence of communities (Section 3.2) and a look at the long-term evolution of maritime network topology (Section 3.3).
3.1. Hubs and vulnerability at different scales
In the vast literature about hubs, the main focus is on the hub itself, leaving behind the secondary nodes on which they depend. Transport geography makes no exception, but gives its own interpretation as transportation hubs should be well-equipped, accessible, well located along trunk lines, and close to main markets (Fleming and Hayuth, 1994; Fleming, 2000; Rodrigue and Notteboom, 2010). Operations research look at route optimization and efficiency to enhance network design (for a recent review see Tran and Haasis, 2015). The most common definition of the hub is the dominant share of port activities in sea-sea transshipment operations, mainly in container shipping, with two different configurations. The hub-and-spokes configuration is the transfer of containers from mother vessels, calling only at large ports, to feeder vessels, connecting secondary ports with the hub, and vice-versa. The interlining configuration consists in transferring containers between mother vessels at a hub situated at the crossing between main lines. Two types of studies were proposed to analyze vulnerability in maritime networks: hub-centered and spoke-centered. Hub-centered approaches deal with network vulnerability at the global level in the advent of hub failure and its spatial distribution (see Earnest et al., 2012 for an early discussion of trade disruption and container shipping). The spoke-centered one is more interested in understanding, through case studies of particular regions, which nodes are vulnerable and upon which hubs.
As stated by Lhomme (2015), understanding the vulnerability and resilience of maritime networks is relevant in terms of re-routing traffic or re-planning schedules, although “there is no accurate model to capture maritime network behavior”. Using graph theory and CNA, the author concludes that the maritime network is more resilient to cascading failures than planar networks – taking the example of the electric power grid. Although scale-free networks should be more vulnerable to targeted attacks, the spatial nature of maritime networks, their density along coastlines, and their polycentricity confers a higher level of robustness. In addition, and as revealed by Wang et al. (2016), “many important pivotal ports develop in concomitance with a nearby pivotal port [through] a backup mechanism in the network. Once a pivotal port fails for intentional attacks, the nearby pivotal port will immediately undertake the transportation business”. Lhomme
(2015) also found that European ports are the most affected by such failures among all world ports. A similar result was obtained by Ducruet (2016) when looking at the impact of removing canal-dependent flows on the betweenness centrality of world ports, Europe appearing as locked-in without Suez and Panama. Wu et al. (2019) found that global shipping times would increase by 25% without Suez, especially between the main economic poles of the Northern hemisphere, while more than 50% East Asian and European container shipping depend on the Malacca Strait and the Suez Canal. Rousset and Ducruet (2020) demonstrated strong affinities between New York, Kobe, and New Orleans, and the significant correlation between distance to shock epicenter and neighbor ports' ulterior traffic change. They also compared the connectivity of the three ego-networks before and after the shocks, characterized by an increasing density.2 The focus on link disruption was proposed by (Viljoen and Joubert, 2016), concluding
to a high robustness of the global container shipping network although removing links with high betweenness proved more successful, especially in terms of reducing “transshipment and dynamic rerouting potential amongst the busiest port regions”. It is important to underline that network modeling in operations research evolved in parallel but without adopting the same tools, often without using real flow data (for a recent review see Achurra-Gonzalez et al., 2019).
When it comes to spoke-centered analyses, some were conducted at the domestic level in the case of island countries such as Finland (Makkonen et al., 2013) and Greece (Tsiotas and Polyzos, 2015) to discuss accessibility issues. Others like Tovar et al. (2015) on the Canary Islands and Fraser et al. (2016) on Southern Africa looked at peripherality in relation to the wider, global network. Uneven traffic distribution and the competitive advantage of hub ports were at center stage in studies of the new “maritime silk road” (Wang et al., 2018; Mou et al., 2018; Jiang et al., 2019) but also within the Mediterranean (Arvis et al., 2019), the Yellow Sea (Guo et al., 2017), and the Bohai Rim (Lu et al., 2018). Understanding the weaknesses of spokes – and the strength of hubs – in maritime networks gained from the concept of “hub dependence”, i.e. the extent to which a node depends on another node in the network. The concept was first used in the case of North Korea (Ducruet, 2008), which maritime traffic had increasingly been centralized upon the South Korean hub of Incheon. This hub dependence process meant that geographic proximity surpassed political tensions on the peninsula. North Korean ports rapidly became unable to handle modern ships after the collapse of the USSR, which resulted in internal crisis and limited external trade. South Korea embarked onto an ambitious strategy to become Northeast Asia's logistics hub through the massive development of free economic zones around its ports. A statistical translation of hub dependence was proposed based on the Northeast Asian liner shipping network (Ducruet et al., 2010a), as for a given port node, it equals the share of its largest flow link in its total traffic (or strength). It was shown that this share was inversely proportional to total traffic, as hubs distribute a large traffic over multiple connections and spokes depend on a few connections to handle small traffic. Yet, certain large ports like Shenzhen stood apart by their higher hub dependence than predicted, due to its strong dependence upon the Hong Kong hub. In addition, the hypothesis that growing port traffic should be reflected in growing port centrality was not verified. A single linkage analysis demonstrated that Chinese ports remained peripheral despite their huge traffic growth. Major hubs like Busan and Hong Kong kept centralizing regional flows, with South Korean ports superseding Hong Kong for the reasons cited above. This also confirmed that large Chinese ports remain functionally gateways rather than hubs, except for domestic transshipment. In North Africa, during the same period, Algerian and Tunisian ports largely depended on the external hub of Malta (Marsaxlokk) to connect overseas, before shifting a great share of their flows towards Tangier-Med in Morocco (Mohamed-Chérif and Ducruet, 2016). Like for the Korean peninsula, growing cross-border connectivity is more explained by logistical factors than trade factors. Other studies were conducted in
2 Network density refers to the proportion of links in the maximum possible number of links. Low density is found in sparsely connected networks. The shocks provoked an increasing density due to the failure of the main port under study.
different contexts, looking for instance at the impact of the USSR collapse on its internal and external maritime connectivity (Zreik et al., 2017). The blockmodeling approach showed the sudden vulnerability of the Soviet ego-network during 1991–1993 and its dependence upon nearby, external foreign ports.
3.2. Community structures in maritime networks
The search for tightly connected groups of ports in maritime networks wishes to reveal two important facets, namely barrier effects and the geographic extent of port dominance. Kaluza et al. (2010) provided the first analysis of community structures per type of vessel on a world scale, confirming that densely connected groups of ports tend to be geographically circumscribed, partly due to physical factors such as coastlines (see also Sun et al., 2012 for a similar result using the same methodology). Single linkage analysis confirmed that most nodal regions are marked by geographic proximity since each ub dominates its surrounding region (Wang and Wang, 2011), with the exception of a giant group centered on Hong Kong and extending towards East Africa in 1996, later expanding across the entire African continent (Ducruet and Notteboom, 2012). Some scholar preferred a bottom-up approach, using the Alphaliner database, concluding that certain ports like Tilbury and Felixstowe should be included in the “integrated geo-economic entity” of the North European range from Le Havre to Hamburg (Plasschaert et al., 2011).
Another way to detect substructures had been to disassemble the network using the bisecting k-means algorithm, in the case of the Atlantic liner shipping network (Ducruet et al., 2010b). Such a method was also meant to reveal non-hierarchical tendencies. Results showed that the majority of the obtained subgroups had a strong geographic background based on proximity, but also revealed the importance of maintained historical links between German and Brazilian ports, French ports and West African ports, Iberian Peninsula ports with Latin American counterparts. The Le Havre – Hamburg range clearly appeared as a functional structure on its own. Another method, topological decomposition, consisted in removing ports of low or high degree centrality by iteration until obtaining the desired number of subgroups (Ducruet and Zaidi, 2012). It revealed that in general, smaller ports are grouped within the same geographic region. Interestingly however, small European ports were the only ones to be grouped with other small ports at long distances. Such an evidence confirmed the previous work, by which European economies keep long-distance ties, as seen with Portugal/Angola/Brazil, France/West Africa, Spain/Latin America, etc. European ports were the only cases of smaller ports connecting at long distance other small ports, the rest of the world remaining locally circumscribed.
A complementary approach was soon proposed to examine the role of traffic diversity in the emergence of communities (Ducruet, 2013). This stood in contrast with most of the existing studies that focused only on containers. A global maritime network was constructed on the basis of six types of flows, namely containers, solid bulks, liquid bulks, passengers and vehicles, and general cargo. Ports and inter-port links were classified from the most specialized to the most diversified. A single linkage analysis clearly demonstrated that nodal regions were internally dominated by most diversified nodes, while the most peripheral ports in such regions were the most specialized. This confirmed the fact that more diversified ports are more central on average and bigger by their traffic. In complement to this finding, it was shown that most of the time, nodal regions were highly specialized in one dominant traffic type. An East Asian region centered on Hong Kong and Singapore had containers as the main traffic, while another Mediterranean region centered on Naples principally carried passengers and vehicles. The stability of traffic diversity over the period 1977-2008 was understood by Ducruet (2017) as a pathand place-dependent process.
Lastly community structures have been researched using the stochastic block model (SBM) methodology, allowing to observe the hierarchical relationships between groups of ports rather than the groups themselves, to extract the hidden clusters (Bouveyron et al.,
2015). Main results again confirmed the strong influence of geographic proximity on the layout of clusters. In contrast, it was found that the least dominant ports in the network have no particular geographic
pattern. Four clusters stood at the center of the global network, namely North Europe, East Asia, the Mediterranean, and the US East Coast. Originally designed to study power relationships in the world system, such a method could shed new light on the hierarchical structure of the maritime network.
3.3. The temporal analysis of maritime networks
As said above, most of the studies of maritime networks remained static in scope, eluding the dynamics at stake in the evolution of the global network structure and the centrality of ports. It was recently realized that one unique data source at the port level could be used to serve a longitudinal analysis of maritime networks, the Lloyd's Shipping Index (Ducruet et al., 2015). Such a source had been published since the late 18th century to document the daily movements of British merchant vessels around the globe, and from 1880 it was extended to other fleets. Surprisingly, only two papers referred to this source up to nowadays, in
1955 and 1968, without using it for analytical purposes, although no other source may be used to construct a worldwide, dynamic inter-port matrix. The tedious extraction of one printed publication every five years or so between 1880 and 2008 could serve as a base upon which a better understanding of the evolution of the global maritime network was made possible.
Among the main results, it was showed that the density of the network as well as the average clustering coefficient (proportion of connected triangles in the possible number of triangles) drastically dropped since World War II. This indicated a structural change by which the network gradually became more sparsely connected. Such an evidence tended to balance the role of containerization in the evolution of the network, such a “revolution” having spread to the world only in the late 1960s and 1970s through successive waves rather than abruptly (Guerrero and Rodrigue, 2014). A more likely reason was the growing global trade in general and the early concentration of maritime flows at deep-sea ports capable of welcoming larger and increasingly specialized vessels including bulk carriers (Bird, 1963). Containerization was thus more a continuation than a cause of further network rationalization. The ranking of ports by betweenness centrality (number of occurrence of a node on all possible shortest paths) confirmed the shift from London to New York, and Rotterdam to Singapore over time, in high correlation with the sole number of vessel calls. This provided the possibility to visualize the evolution of individual ports, with the influence of major shocks such as the world wars, creating the opportunity to classify ports in terms of overall decline or growth.
Other time-related analyses of maritime networks were proposed, such as the analysis of network topology and port centrality on a daily, weekly, and monthly basis to observe seasonal effects and cycles (Guinand and Pigné, 2015). The time window analysis particularly underlined the higher importance of structural change, namely the fact that the global container shipping network is constantly evolving overtime. The global shipping network was also analyzed on a yearly basis since the late 1970s to nowadays, with results confirming the impact of technological change on network structure (Ducruet et al., 2020a). Similar indices than above, such as network density and average shortest path length, were used to depict the increasing centralization of flows around large hubs as well as the increasing efficiency of navigation, especially since the mid-1990s. This confirmed the formation of large alliances and the adoption of economies of scale, removing redundant ports and routes from their networks (see Cullinane and Khanna, 2000). The increasing size of ships provoked a drastic selection of ports capable of welcoming such sea giants, which in turn concentrated their movements along main trunk lines with least deviation distance (Zohil and Prijon, 1999).
4. The territorial embedding of maritime networks
In complement to previous studies, this section postulates that maritime networks should be considered as integral components of the territories they connect. This approach belongs to a wider school of thought
which goal is to give a better status to cargo flows in the study of cities and regions (Derudder and Witlox, 2010; Hall and Hesse, 2012; Birtchnell et al., 2015), which tended to be left aside. It is in some way a revival of the port triptych concept by which foreland, port, and hinterland are mutually linked, except that it takes into account a whole system of ports instead of one given place. Numerous models and case studies on port cities and port regions concluded to a dereliction of the socio-economic linkages between ports and their outlying territory. One major stake was thus to evaluate the degree to which maritime networks can still be considered “territorial”, given the aforementioned changes in the way they were reorganized by their actors in the last decades. The method has been to weight the network by territorial indicators to go beyond the sole graph topology. We investigate maritime networks as urban networks (Section 4.1), as interregional systems (Section 4.2), and as elements of coupled networks (Section 4.3).
4.1. Maritime networks as urban networks
The analysis of maritime networks as urban networks was proposed to take some distance from the dominant approach centered on the micro-scale of the waterfront or port-city interface, where the dereliction is the most apparent (Hoyle, 1989). Despite repeated references to the Hanseatic League, the Italian and later the Asian city-states in the literature (Gipouloux, 2009), the earliest systematic study to date is the one of Ducruet et al. (2018), proposing a longitudinal analysis of “maritime networks as systems of cities” between 1890 and 2010. This is rather surprising, given the longstanding interest of geographers in gateway cities (Burghardt, 1970; Bird, 1977) and the existence of the maritime data source, again the Lloyd's Shipping Index.
Strikingly and on average, the most populated cities kept on concentrating flows and to be the most central along the study period (1890–2010). They also continuously connected at farther distance than smaller cities, and remained more diversified (agglomeration economies) in terms of cargo types. In addition, general cargo and containers, the most valued traffic, were the most correlated with city size, confirming that maritime networks are far from being randomly distributed across the global urban hierarchy. This was not to say that port-city relationships remained unchanged over time and across space. The linear correlation between maritime centrality and urban population regularly dropped since the 1950s to nowadays at the port city level. But at the extended level of city-regions, the correlation went through an opposite trend. This apparent contradiction was understood as a proof of the growing physical separation between ports and cities locally but a maintained economic proximity regionally. Such trends did not occur the same depending on the geographic configuration of transport systems. Upstream port cities witnessed a rapidly declining correlation between maritime centrality and urban population, contrary to downstream port cities. Although a few exceptions keep resisting to this rule nowadays, such as Antwerp and Hamburg (Notteboom, 2016), upstream port cities became unable to welcome larger vessels at a time of growing trades and ship sizes, resulting in the creation of deep-water ports and terminals at the mouth of estuaries or elsewhere along the coasts.
On the more recent period and for container shipping, Ducruet et al. (2020b) demonstrated the applicability of the gravity model to maritime interactions among cities of the world. The urban population of the origin and destination city-regions proved to be a traffic generator between 1977 and 2016, and maritime distance between them a friction. The fact that larger cities connect more with each other but less at distance thus allowed to conclude that the maritime network, despite all the contemporary technological and managerial changes (and their spatial consequences), still remained an urban network. Such an evidence created bridges with wider discussions in international trade studies, where the negative effect of physical distance remains puzzling. In terms of planning issues, those works both supported the necessity to further understand port-city relationships as parts of a macro-system of flows.
Like for cities, regional studies often ignore material flows (Huggins et al., 2014). Yet, numerous works investigated the port-region relationship in quantitative ways based on port tonnage, with very diverse outcomes, from the absence of relationship (De Langen, 2007) to the negative (Grobar, 2008) or positive (Bottasso et al., 2013) impacts of ports on their outlying region. Such analyses had in common to be made within a single country and to ignore maritime linkages between regions. A wider sample of port regions was thus established, with a significant correlation between total port traffic and total population at the national (0.75) and regional (0.40) levels (Ducruet and Itoh, 2015). Compared with cities, the advantage of the regional unit was to allow collecting more indicators than the sole population. A principal components analysis revealed that regions with higher population density and GDP per capita, and higher specialization in the tertiary sector were also specialized in non-bulk maritime traffic, namely the most valued one. On the other hand, regions specialized in the primary sector tended to handle more solid bulks (i.e. grain, coal). Such a distinction again confirmed that maritime flows were not randomly distributed and, at the wider level of regions (including the port city but often extending more inland and including more ports), demonstrated that such flows reflect the socio-economic profile of the immediate hinterlands.
The inclusion of network indicators was one step further into the analysis of port-region linkages. Degree centrality, the most common indicator to depict nodes, appeared to strongly correlate with container traffic, the share of regional traffic in national total, and density, regional GDP, population density, and share of regional population in national total. Maritime network connectivity thus highly concentrates in the most populated and productive regions, which act as key nodes in the graph. This is in line with the fact that most container ports, despite the port-city separation at the micro-level, still locate near main markets and function in a very hierarchical manner within the services of evermore concentrated shipping lines. In addition, using interregional links as units of analysis had been an attempt to check the assortativity and homophily of the interregional maritime network (Ducruet et al., 2017). A network is said assortative when node pairs share similar characteristics like degree, or disassortative for the opposite, when nodes of high degree tend to connect more, on average, other nodes of lower degree. Homophily is used in social network analysis in a similar vein than assortativity but in more qualitative ways, such as for people of the same school or age being more tightly connected than with others. It was found that links with wider gaps of regional population (disassortative) tended to be more specialized in containers and, at the same time, more voluminous and diversified. In addition, interregional homophily based on socio-economic profiles was significantly related with traffic volume, traffic diversity, link betweenness, and general cargo and container specialization. This meant that regions sharing similar economic structures were more tightly connected with each other and through more valued traffics.
Maritime networks were also analyzed at the country level, in direct relation with international trade flows (Guerrero et al., 2015b; Huang et al., 2016; Calatayud et al., 2017; Catalayud et al., 2017; Fugazza and Hoffmann, 2017; Kosowska-Stamirowska, 2020). For instance, Guerrero et al. (2015b) showed that international trade flows of containerizable (section 4.2) commodities were better explained by gravity equations when using vessel movement frequency rather than kilometers as the distance metric. The main issue of the works mixing maritime networks and international trade is the fact that the first are included in the second, thereby making it difficult to disentangle the two and extract their interrelationships or mutual causal effects. More research is thus needed to check, for instance, the specific role of logistical factors on the distribution and evolution of trade, as it was demonstrated elsewhere that containerization, for instance, clearly boosted global trade (Bernhofen et al., 2016) but without looking at the network dimension. Economists are perhaps the only ones to have pushed research in such a direction relatively early, analyzing jointly shipping networks and trade flows. In their review of the existing literature, in economics, Fugazza and Hoffmann (2017) underline that “various aspects of maritime connectivity” were incorporated into research on maritime transport costs, such as the effect of liner shipping network conditions. Most results demonstrated that additional transshipment increased costs while direct shipping connections decreases freight rates, an effect equivalent to lower shipping distances.
(see Wilmsmeier and Hoffmann, 2008 for an early application).
In particular, the Liner Shipping Bilateral Connectivity Index (LSBCI) proposed by Hoffmann et al. (2014), an extension of the UNCTAD's already existing LSCI, provided evidence about certain trends, such as the concentration of top LSBCI linkages at the intraregional level and among a few countries only. Fugazza and Hoffmann (2017) propose an extension of the LSBCI including five more components (i.e. number of transshipments, number of common direct connections, geometric mean of the number of direct connections, level of competition, and size of the largest ship), based on a sample of 138 countries and 9453 country pairs between 2006 and 2013. Authors find a positive relationship between the revised LSBCI and the level of exports (in goods which are highly containerizable). Yet, the authors acknowledge that “maritime connectivity does influence trade flows (…) However, trade flows could also influence maritime connectivity and its components”, while they support the extension of their gravity model to other transport modes to better study trade facilitation, as “part of the trade considered here may have been moved by air cargo than by sea cargo”.
4.3. Maritime networks in multiple networks
Maritime studies have long recognized that ports are crucial nodes between sea and land, giving more and more importance to intermodal and supply chain issues. In network science, a subfield focusing on coupled networks (also coined multigraphs or multiplex graphs) gradually emerged, looking at how networks (or layers) of different nature interact with each other at nodes or at the level of the entire system. Only a few studies, however, adopted a coupled network approach to study maritime networks, often without explicitly mentioning network science itself. Scholars from Stanford University created a Geographical Information System (GIS) capable of visualizing and calculating sealand routes in the Roman Empire (Scheidel, 2013). Another GIS, based on an impressive number of raster images, provided a world cartography of current urban accessibility, taking into account vessel densities – but ignoring airline networks (Nelson, 2008). Another study constructed a Spatial Computable General Equilibrium (SCGE) model based on worldwide maritime and land routes, 437 ports, and 800 liner services as well as trading flows between countries (Tavasszy et al., 2011). Their objective was to predict container shipping demand and the effects of certain policies, such as slow steaming or the opening of the Northern Sea Route, on ports and existing maritime linkages. Another work by Shen et al. (2020) provided 2D and 3D visualizations of maritime flows thanks to a nearly all-encompassing GIS combining various country-level data sources on import and export freight.
Other studies looked at the interdependencies between airline networks and maritime networks, having in common not to address operational issues but approaching the problem for theoretical and methodological purposes (Parshani et al., 2010) or from a global city perspective (Ducruet et al., 2011). One main argument was that despite their operational and geographic differences, airline and liner shipping networks were complementary due to their global coverage and their similar structure in terms of schedules, hubs, large carriers, and alliances. Parshani et al. (2010) proposed two new indicators to measure the “similarity of networks”, namely the inter degree-degree correlation (IDDC) and the inter-clustering coefficient. The IDDC consisted in calculating the correlation coefficient between cities' maritime degree and airline degree, and such a measure had many followers since then in network science. The main objective of Ducruet et al. (2011) was to determine whether cities dominate through traffic diversity or specialization, based on urban theories and the literature on systems of cities. The fact that 60% of global airline traffic concentrated in the class of the largest ports, while 85% of global port traffic concentrated in the class of the largest airports meant that large seaports are more likely to be large airports and not the other way round. However, the majority of main hubs in the coupled network remain specialized in either airline or maritime, especially in Europe and North America, while elsewhere such hubs were more diversified. Nodal regions around hubs thus tended to be of the same nature than hubs, i.e. maritime or air hubs dominating maritime or air nodes, and diversified hubs dominating both, preferably in Asia, Africa,
and Latin America.
The integration of maritime networks and road networks permitted to analyze jointly the accessibility of ports and cities within the same transport system. In the case of European ports, Guerrero et al. (2015a) compared the inland population potential with the foreland connectivity. It was found that a large share of general cargo (45%) and container (33%) supply on the maritime side could be explained by road accessibility to population. As ports and their belonged (NUTS-3) regions were differentiated by the geographic diversity of their overseas connections, the authors also showed that East Asian forelands are more deeply related with road accessibility and population potential than other forelands. Combining other GIS methods with graph theory and complex methods, it was found in Australia (Berli et al., 2018) and Europe (Berli et al., 2020) that sea-land centrality was more significantly correlated with the urban population of port cities than single (road or maritime) centrality. In Europe, while the spatial distribution of sea-land centrality remained very stable between the 1970s and the 2000s, the correlation with the urban population of continental (nonport) cities regularly dropped. Non-port cities in Europe are the least dependent on maritime centrality, compared with their river and maritime counterparts, given their “central place” situation.
5. Conclusion and future research
This review covered a wide range of studies on maritime flows and networks, from the first maps and graph visualizations to the most recent advances in statistical analysis. Several conclusions can be made about how the “backbone of the world economy”, maritime transport, has been analyzed from a network perspective in the literature. A vast majority of studies looked at how maritime networks are built (topology), can be improved (optimization) or disrupted (vulnerability), using various methods and data sources to describe the overall network structure and centrality of port nodes. Such works often neglected the spatial dimension of maritime transport, although maritime networks belong to the category of spatial networks (Barthelemy, 2010). As such, space and time had been rarely integrated in the quantitative analysis of maritime networks, as scholars often focused on the sole topology in an abstract space and in a binary fashion (presence or absence of links). The main purpose of such quantitative works had been to analyze maritime networks with reference to generic models of network structure (cf. scale-free and small-world networks) and hub allocation (cf. network design), principally in the realm of container shipping. The dominant interest for container shipping networks comes from their likely overlap with scale-free networks, but other shipping segments thus remain neglected, such as general cargo, bulks, ro-ro, and passengers. Maritime data had been more easily available on container shipping as it is a much concentrated industry (large firms and alliances) and works in schedules that are publicly displayed on companies' websites.
The link between maritime networks and geographical space was reviewed in two successive steps, maritime networks as imprints of spatial structures or as parts of them. The first approach remains bound to relatively few works. Much more can be done about the effect of political barriers, for instance, on the distribution of maritime networks. Those may follow or transgress various barriers due to their volatility (Bird, 1984) but, as rightfully addressed by Vigarié (1995), ports and maritime transport are not only vectors or trade and economic exchanges; they also carry the movement of ideas, people, cultures, and politics, through often divergent interests among connected partners linked by various geostrategic goals. In the case of hub ports, little has been said about the possible geopolitical dimension of their emergence and strength, besides the more economical and operational factors pushing countries and shipping lines to invest in those optimal transshipment platforms. More qualitative factors are thus needed to provide a better understanding of the structure of maritime networks.
Maritime network analysis, backed by such a progress in data availability and methods, has the potential to tackle longstanding questions such as the spatial structure of the world economy and the processes of regional integration, to name but a few. Becoming a purely quantitative experiment, however, carries the risk for maritime network analysis to remain a "dark corner" of transport studies (Keeling, 2007), away from the
wider reflections on production networks and commodity chains. A very concrete field of study seems to be the tracking of individual shipments to better understand the role of the sea in cargo mobilities and territorial development. This poses serious data availability and confidentiality issues. Certain weaknesses can be highlighted, which apply to network analysis in social sciences and elsewhere. For instance, a plethora of new port rankings based on centrality has been proposed, often without referring to the existing ones and/or to the more classical rankings based on port throughput. This would have permitted, for instance, to go further into the study of port functions, such as to better distinguish, among them, hubs and gateways – or other functions such as bridges. Another limitation is to have neglected the visualization possibilities of certain software dedicated to graphs. Most figures proposed in reviewed publications remain hard-to-read even for network specialists as well as for geographers interested in networks. Node size and edge width and their respective colors often do not respect the traditional layout of geographical maps adopted in geographical journals. Lastly, the cartography of the maritime network on a real geographic map has rarely been discussed apart from a few cases and from density maps. Reducing the network's size by means of certain algorithms such as single linkage analysis may allow in some cases to reach such an objective and gain in graphical quality.
Digital humanities and newly available historical shipping data offered new possibilities to study past maritime networks, such as Venice's Incanto (Fournier, 2015), French modern forelands (Marzagalli, 2015), with a continued interest for reconstituting antiquity maritime networks (Rivers et al., 2015; Arnaud, 2017). The shift from colonial to global had been of particular interest in the case of Africa (Castillo and Ducruet, 2020) and the Indian subcontinent (Tsubota et al., 2017), but the exclusion of domestic, coastwise traffic could not fully permit the analysis of border change. Political factors influencing maritime connectivity thus need a thinner quantitative resolution, as in the case of Taiwan/China cross-border shipping (Wang et al., 2019b). Progress was made however to catch the effects of technological change on maritime network structure and port connectivity in the past decades, especially with regards to containerization, but also earlier such as from sail to steam (Bunel et al., 2017). Research on maritime networks as integral parts of territorial structures will remain relatively difficult until more precise data shall become available on the true origins and destinations of maritime flows. Looking at the maritime network as an entity on its own, even linking coastal cities and regions, carries the risk of attributing too much importance to maritime hubs that are poorly connected inland, such as Singapore, and to ignore, in fact, the maritime dimension of inland cities, such as Mexico City and Moscow, among others. A fully-fledged network connecting all cities of the world by all means may be the next step of maritime network studies (Rimmer, 2015; Robinson, 2015), allowing to re-evaluate the role of the sea in the way transport systems are planned and managed, from the macro to the micro levels. This will need closer, joint efforts within the academic and wider professional community, to go beyond disciplinary and thematic barriers that still, in some way, hamper a unified view on maritime networks.
Acknowledgements
The research leading to these results has received funding from the European Research Council under the European Union's Seventh Framework Programme (FP/2007-2013) / ERC Grant Agreement n. [313847] "World Seastems".
References
Achurra-Gonzalez, P.E., Angeloudis, P., Goldbeck, N., Graham, D.J., Zavitsas, K., Stettler, M.E.J., 2019. Evaluation of port disruption impacts in the global liner shipping network. J. Ship. Trade 4 (3). https://doi.org/10.1186/s41072-019-0043-8.