HAL Id: hal-03102651
https://hal.archives-ouvertes.fr/hal-03102651
Submitted on 11 Jan 2021
HAL is a multi-disciplinary open access
archive for the deposit and dissemination of
sci-entific research documents, whether they are
pub-lished or not. The documents may come from
teaching and research institutions in France or
abroad, or from public or private research centers.
L’archive ouverte pluridisciplinaire HAL, est
destinée au dépôt et à la diffusion de documents
scientifiques de niveau recherche, publiés ou non,
émanant des établissements d’enseignement et de
recherche français ou étrangers, des laboratoires
publics ou privés.
A 420,000 year deuterium excess record from East
Antarctica: Information on past changes in the origin of
precipitation at Vostok
F. Vimeux, V. Masson, G. Delaygue, J. Jouzel, J.R. Petit, M. Stievenard
To cite this version:
F. Vimeux, V. Masson, G. Delaygue, J. Jouzel, J.R. Petit, et al.. A 420,000 year deuterium excess
record from East Antarctica: Information on past changes in the origin of precipitation at
Vos-tok. Journal of Geophysical Research: Atmospheres, American Geophysical Union, 2001, 106 (D23),
pp.31863-31873. �10.1029/2001JD900076�. �hal-03102651�
JOURNAL OF GEOPHYSICAL RESEARCH, VOL. 106, NO. D23, PAGES 31,863-31,873, DECEMBER 16, 2001
A 420,000 year deuterium excess record from East Antarctica'
Information on past changes in the origin of precipitation at
Vostok
F. Vimeux,
• V. Masson,
• G. Delaygue,
•'2
J. Jouzel,
• J. R. Petit,
3 and
M. Stievenard
•
Abstract. Here we present and analyze the complete Vostok ice cores deuterium excessrecord
which spans
the last four climatic cycles,
back to - 420,000 years
B.P. To extract
paleoclimate
information
from this record,
we use isotopic
modeling
showing
that changes
in
deuterium
excess
(d=fD-86•80)
of Vostok
precipitation
reflect
changes
in the
average
temperature
of oceanic
moisture
sources.
Over the last 250,000 years
the deuterium
excess
is
strongly
anticorrelated
with changes
in Earth's
obliquity.
This reflects
changes
in the relative
contribution
of low and high latitudes
to the Vostok
precipitation,
resulting
from changes
in
the latitudinal
annual
mean
insolation
gradient
governed
by the obliquity.
However,
this
modulation
by obliquity
is not observed
prior to 250,000 years B.P. We attribute
this
difference
to the ice flow, the deeper
ice under
Vostok station
having accumulated
in a
location
upstream
Vostok,
receiving
precipitation
from different
oceanic
origins.
Despite
this
difference
between
the earlier and the later portions
of the record,
the deuterium
excess
changes
during all the glacial inceptions
are similar in amplitude
and timing relative to the
deuterium
decrease.
The glacial inceptions
are characterized
by high deuterium
excess,
indicating
the significant
role of the tropics
in supplying
moisture
to the already
cold poles.
1. Introduction
The Vostok icecores studies have provided a wealth of information about climatic and other environmental changes over the past 420,000 years [Petit et al., 1999], including changes in the atmospheric concentration of CO2 and CH4, atmospheric chemistry, condensation temperature (derived f¾om the isotopic composition of precipitation). Here we focus specifically on changes in southern ocean surface conditions using combined measurement of both water stable
isotopes
(fid and 6180). The deuterium
excess
(d) in
precipitation has been defined by Dansgaard [1964] from the Meteoric Water Line [Craig, 1961] as follows:
The models also show that this source-region information is partly preserved along the poleward air mass trajectory despite the additional kinetic fractionations associated with droplet reevaporation and snow formation [douze! and Merlivat, 1984]. For example, a multiple linear regression analysis performed with a Rayleigh-type model reflects the
dependency of Vostok deuterium excess (d, in %0) on spatial
changes in moisture source temperature (ATsouroe, in Celsius
degree, øC) and moisture source relative humidity (h, in %),
as tbllows:
Ad = 1.2 A Tsouroe - 0.15 Ah. (2)
d= 6D- 8 6180.
(1)
Both simple [Mer/ivat and douze/, 1979; dohnsen eta/., 1989] and comprehensive isotopic models [Armengaud et al., 1998; Delaygue, 2000] exhibit a clear positive correlation
between the temperature of the evaporating ocean surface and the deuterium excess of vapor in the overlying air. This correlation results from the dependency of the kinetic fractionation processes during evaporation on oceanic and meteorological moisture source characteristics (mainly the sea surface temperature (SST) and, to a lesser degree, the relative humidity of the air just above the sea surface h).
1Laboratoire des Sciences du Climat et de l'Environnement
(LSCE), Gif-sur-Yvette, France.
2Centre Europeen de Recherche et d'Enseignement en Geosciences
de l'Environnement, Aix-en-Provence, France.
3Laboratoire de Glaciologie et Geophysique de l'Environnement
(LGGE), Saint Martin d'H•res, France.
Copyright 2001 by the American Geophysical Union.
Paper number 2001 JD900076.
0148-0227/01/2001JD900076509.00
The dependency of the deuterium excess at Vostok on the
SST simulated by the GISS atmospheric general circulation
model
(1%o/øC)
is in close
agreement
with our Rayleigh-type
model result. To interpret past fluctuations of deuterium
excess
in terms
of SST alone
(no independent
measure
of past
changes
in relative
humidity
is available),
we have
explored
the relationship
between present-day
SST and relative
humidity simulated by three different general circulations
models
(GISS,
LMD and
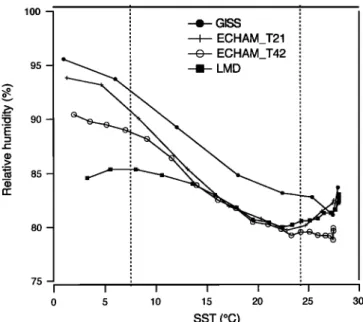
ECHAM) [Vimeux
et al., 2001]. For
all of these,
spatial
covariation
of SST and
relative
humidity
over
the Southern
Hemisphere
ocean
surface
is linear
(Figure
1) with a common
slope
of-0.4%/øC
for SST in the range
7øC
to 24øC
(o = + 0.04%/øC).
Note that this SST range
clearly
includes the major oceanic contributions to Vostok
precipitation,
which are estimated
to be, on average,
-11øC
[Delaygue
et al., 2000]. Simulations
of last
glacial
maximum
climate
(not
shown
here)
show
that
this
SST-relative
humidity
relationship is preserved even in past climate extremes. Indeed, the relative humidity changes between modern and
last glacial maximum climates are estimated to be minor
[Bush
et al., 1999].
Therefore
our approach
here
is to interpret
Vostok deuterium excess variations as depending
on
31,864 VIMEUX ET AL.' DEUTERIUM EXCESS IN VOSTOK ICE CORES 100 - 95- 90- 85- 80- 75 m . -e- GlSS I ECHAM_T21 O ECHAM_T42 • LMD I I I I '1 0 5 10 15 20 25 30 SST (øC)
Figure 1. Variation of the relative humidity as a function of the moisture source temperature simulated with three atmospheric general circulation models: GISS, LMD, and
ECHAM (two different resolutions have been used for the
latter (G. Hoffmann, personnal communication, 2000).
fluctuations of the oceanic moisture source surface temperature only, by combining equation (2) with the established correlation of the relative humidity and SST to yield a combined coefficient Ad/ATsource of 1.3%o/øC.
We present and discuss the entire deuterium excess profile spanning the last 420,000 years, greatly extending the
150,000 year record obtained by Vimeux et al. [1999]. We
will not discuss here the deuterium excess variations in the deepest part of the ice core (below 3310 m), which have been used to identify the existence of refrozen Vostok lake water below 3539 m [douzel et al., 1999].
Over each climate cycle the deuterium excess generally decreases from high values at the glacial inceptions to low values in the latter half of the glacial periods. The corresponding range of deuterium excess values increases with time from 6%0 (between 12%o and 18%0) during the first two cycles and 10%o during the two most recent cycles (between 10%0 and 20%0). The standard deviation varies from 1.4 to 1.9 %o between the oldest and the youngest climate cycles.
Examination of the phase relationship between fid and deuterium excess reinforces the striking difference between glacial and interglacial periods, first identified by Vimeux et al. [1999] (Figure 3). d and fid values are negatively linearly correlated in warm periods (characterized by high fid values), whereas no correlations can be identified during glacial periods (despite the full range of deuterium excess values being present). The two major types of climatic transitions are also clearly distinct: Deglaciations have low deuterium excess values, whereas glacial inceptions have high deuterium excess values.
Spectral analysis of the full profile identifies significant periodicities at 18,000 years, 40,000 years and 100,000 years (see legend of Figure 4 for details). However, because of the uncertainties of the age scale, we have also conducted the spectral analysis using an alternative time scale obtained by orbital tuning [Parrenin et al., this issue]. This significantly affects the power spectrum (amplitude and location) only for
periodicities lower than -30,000 years as it has already been shown for analysis of deuterium alone [Petit et al., 1999].
The spectral properties of the deuterium excess fluctuations
differ between the last 250,000 years and the oldest part of the record. Indeed, the last 250,000 years are largely modulated
by a single significant periodicity at 40,000 years (obliquity period) (Figure 4). Applying a Gaussian filter to extract
variations of the deuterium excess in the obliquity band
(Figure 5) clearly shows the strong anticorrelation with obliquity in the past 250,000 years and the weakening of the
40,000 year modulation before this time.
2. Results
In the first part of this section we describe the data, characterize the relationship between deuterium excess and bD, and examine the spectral properties of the deuterium excess profile. We identify a clear difference in deuterium excess variability before and after 250,000 years B.P.
In the second part of this section we examine the extent to which changes in ocean isotopic composition and site temperature may have affected the deuterium excess content (variations and/or amplitude). These effects are quantified
with both Rayleigh type model and the GISS general
circulation model simulations. Results from the two modeling approaches agree closely.
2.1. Data
The dated Vostok icecores deuterium excess profile is
shown
in Figure
2 along
with
bD and
•*O isotopic
variations
down to 3350 m. Below 3310 m, Vostok climate records are
disturbed due to the ice flow [Petit et al., 1999], and we therefore limit our discussion to the upper 3310 m of the ice core which extends to 423,000 years B.P. according to the
glaciological timescale GT4 [Petit et al., 1999].
2.2. Influence of the Ocean Isotopic Composition
Variation on the Deuterium Excess Profile
The oceanic isotopic composition has varied over time due to changes of ice sheet volume: measurements performed on benthic foraminifera in ocean sediment cores indicate an increase of the oceanic alSO for the Last Glacial Maximum
compared to the Holocene optimum [Bassinot et al., 1994].
Assuming that the ocean deuterium excess is zero, the deuterium excess of the evaporated water vapor will depend on the oceanic alSO. Here we calculate the variation of deuterium excess Ad,, in the initial vapor due to a change of
oceanic
A•SOocea
n based
on the global
evaporation
model
of
Merlivat and Jouzel [ 1979]:
ocean
•- 1--
koh
} a•- 1- kDh
} ' (3)
with a o and aD the equilibrium fractionation factors [Majoube, 1971 ], ko and ko the kinetic fractionation factors
during evaporation from the ocean [Merlivat et douzel, 1979],
h the relative
humidity
and AbDocean
= 8 A•8Oocean.
Without
VIMEUX ET AL.: DEUTERIUM EXCESS IN VOSTOK ICE CORES 31,865 -420 - _ -440 _ -460 -480 - 20-- 18--
14
12 10 3310 rn 3350 rn I 7.1 9.211.3
I
Disturbed zone , i i --58 p -80 - -82 423 kyrI
I I I I • 0 1 O0 200 300 400 no dated Age (kyr)Figure
2. Times
series
of 6D, 6•80 and deuterium
excess.
These
records
combine
data
available
down
to
2083m [ Fimeux e! al., 1999] and new measurements performed along two deep cores: 4G from 2083m to 2755m and 5G down to 3350m with lm depth resolution. Data are presented at lm depth resolution excepting the last climatic cycle, which is presented at a 5m depth resolution. The temporal resolutions are always smaller than 500 years. Deuterium excess experimental accuracy is +0.7%0 (+0.5%0 for 6D and
+0.05%0
tbr 6•80) excepting
from 1413m
to 2083m
at +1.3%o.
Down
to 3310m
we used
the glaciological
timescale GT4 [Petit et al., 1999], the accuracy of which is estimated to be always better than +15 kyr (kiloyears) all over the profile. GT4 provides an age of 423 kyr at the depth of 3310m [Petit et al., 1999].
could be achieved with pore waters), we have assumed a zero deuterium excess. Rough estimates, based on the dilution of ice sheets, lead to an oceanic deuterium excess enrichment
weaker than 0.5%0, consistent with our uncertainty and the weak Vostok glacial-interglacial deuterium excess fluctuation. According to equation (3), at 20øC with a humidity of
80%,
a change
of- 1.2%o
of the oceanic
6180
corresponds
to a
change in the initial vapor deuterium excess of +0.6%0. This imprint on the evaporated moisture is amplified along the air mass fractionation trajectory to Antarctica [De/aygue, 2000]. We calculate, based on a Rayleigh model, the variation of the
deuterium excess Adp in the precipitation along the air mass
trajectory
due
to a change
of oceanic
A618Oocea
n as
Adp:
dp-
dpo:
-SA618Oocea
n
(618Op0
- 6Dp0)' (4)
This indicates that the progressive change in the deuterium excess in precipitation is strongly controlled by the isotopicfractionations
of D and
•O during
air mass
transport
and
that
the magnitude of the signal increases with the total fractionation. The sensitivity of deuterium excess to a change
of the oceanic isotopic composition on the deuterium excess
is thus related to the distance to the source (see Figure 6).
For Vostok a Rayleigh-type model indicates that a global variation of oceanic 6•80 of -1.2%o induces a deuterium excess change of- +3.3%0 in precipitation. The same change estimated from the GISS atmospheric general circulation model is + 3.5%0 for Vostok area (Figure 6), which agrees closely with the simpler model result.
The choice of +1.2%o for the glacial-interglacial variation of the isotopic content of the ocean is somewhat arbitrary with
respect
to the various
available
oceanic
6•O estimates,
ranging from 1.0%o to 1.6 %0 [Schrag eta/., 1996; Dwyer et
a/., 1995]. Such differences may arise from spatial and temporal isotopic variations existing between each ocean
basin and each glacial-interglacial transition [Dwyer et al.,
1995; Lea et al., 2000; Shackleton, 2000]. However, this 1.2%o variation stands well within the range of mean estimates and corresponds to the global anomaly used in isotopic general circulation model :,;mulations which compare favorably to the Rayleigh model ,'csults.
To remove effects of the oceanic isotopic composition, we
31,866 VIMEUX ET AL.: DEUTERIUM EXCESS IN VOSTOK ICE CORES 19- 18- 17- 16- 14- 13- 12- 11-
Glacial'non linear system
ß
•.. ..e' ., • '...
:.•; -..ß
-++• +..+..+.+..+.
ß•+ ....
...,'
.•'*"'*•:•"'
.... + .... First cycle (with stade 1) .... © .... Second cycle (with stade 5e) .... •, .... Third cycle (with stade 7.5)
Fourth cycle (with stade 9.3)
Interglacial'linear system '''' I''' ' I'''' I' ,,, I , , , , I , , , , I , , , , I , , , ,
-480 -460 -440 -420
6D (%0)
Figure
3. Deuterium
excess
versus
8D after
smoothing
with a 4,500
year
filter.
Four
interglacial
periods
are
indicated with marine stages' 1, 5e, 7.5, and 9.3.
better represents source meteorological variations, such as
3.3 •8
0
+ -- aa . (5)
1.2 ocean
Here we have assumed the deuterium excess versus ocean isotopic content relationship to be linear, which is probably accurate to first order. Given the imperfect nature of the isotopics models, a more complex relationship is not justifiable. Moreover, simulations with the GISS general
circulation model using present-day climate show a linear
relationship between deuterium excess and oceanic oxygen 18
changes.
Using
the four cycle record
of oceanic
8180
variations
adapted from Bassinot et al. [1994], we compute a corrected deuterium excess profile shown in Figure 7.
The seawater isotopic correction does not modify the long- term variations but significantly imprints the amplitudes. The largest deuterium excess corrections (+2-3%0) occur during
glacial-interglacial
transitions,
when
seawater
6]80 variations
are largest. The most prominent effect of this correction is a reduction of the linear trend through each climatic cycle; in fact, this trend disappears from each of the climate cycles except the most recent one.
2.3. Influence of the Site Temperature on the Deuterium
Excess Profile
A component of the deuterium excess depends on the site
temperature
through
the variation
of the slope
6D/6180
with
the local temperature, reflecting the dependency of the ratio of the equilibrium fractionation coefficients to temperature. The slope decreases as temperature decreases, causing a deuterium
excess increase with colder temperature, independently of any moisture source fluctuations.
We expect the site temperature correction to be small,
given
that
bD/8180
slope
for the full Vostok
profile
is 7.94 (+
0.02). This supports the use of the definition of the deuterium excess as a good representation of the variation of the moisture source only. Moreover, the specific moisture source signature in the deuterium excess is clearly supported by a principal component analysis performed on the two isotopes which provides, as a second component, a combination similar to the deuterium excess profile, with a ratio of 8.03 between the two components defining the new computed signal.
Although we expect this site-temperature effect to be small, we attempt to correct for it to make our reconstructions as accurate as possible. A multiple linear regression is performed with a Rayleigh type model to calculate the sensitivity of Vostok deuterium excess to both source and site temperatures. The dependency of the deuterium excess to site temperature is found to be -0.5%o/øC, approximately 3 times weaker than the source temperature impact (+1.3%o/øC, see section 1). As in the previous section, we define a corrected deuterium excess from the local temperature variations, assuming that the latter are small enough to make a linear relationship valid (an assumption that is not true over the
complete range of Antarctic temperatures, Petit et al. [ 1991]:
0.5
Adcorr = Ad + AbD with AbD = 7.1AT,•,t • . (6)
7.1
The spatial isotope-temperature slope 7.1, which is also determined by Rayleigh-type model [Vimeux et al., 2001 ], is
VIMEUX ET AL.: DEUTERIUM EXCESS IN VOSTOK ICE CORES 31,867 1.0 - 0.8 - 0.6 - 0.4 - 0.2 - I I I I I 40.0 kyr 0.00 0.01 0.02 0.03 0.04 0.05 - 1.00 - 0.98 - 0.96 - 0.94 - 0.92 - 0.90 0.06 Frequency (cycle.kyr -•) 1.2 - 1.0 - E 0.6- 0.4 - 0,2 -
ii
I
I o.oo O.Ol I I I I 38.6 kyr 0.02 - 1.00 i x / i I o.o3 o.o4 - 0.98 - 0.96 18 kyr - 0.94//
0.92
. •// xx
i I0.90
0.05 0.06 Frequency (cycle.kyr -•)1'21 I 100'0
klyr
3d.O
kyr
I I
1.00
1.0 •
18.1
kyr
0.98
0.8 i 0.6--[ , s sl IS ', L I-- / , , ,I I' '1 [ ,', '" < /., ,,I I' •1 I; , , o.94 0.4 -1 / , ,,I I' /'.; I I, , ._1, ,I I• ,' s, I Is•, • • 0.920.2
3,
,I I
0.0 i i i 0.90 0.00 0.01 0.02 0.03 0.04 0.05 0.06 C Frequency (cycle.kyr -•)Figure 4. Harmonic analysis of the deuterium excess (a) between 0 and 250,000 years; (b) between 250,000 and 420,000 years; and (c) over the last 420,000 years. Raw data are interpolated at 0.5 kyr intervals. The analysis used the multitaper method (MTM); the bandwidth parameter is 4, and the number of tapers is 6. The statistical test (solid line) validates the amplitude (dashed line) and the location of each peak. Calculations have been performed with the Analyseries software [Paillard et aL, 1996].
at the high end of the range of the observed slopes varying between 5 and 7%o/øC [Lorius and Merlivat, 1977; Dahe et
aL, 1994; douze! et al., 1994]. The assumption that the spatial slope is similar to the temporal slope is demonstrably wrong
in Greenland [Cuffey et al., 1995]. However, at Vostok, the use of the spatial isotope/temperature slope as a surrogate for
the temporal slope is supported by recent independent
methods, suggesting an uncertainty weaker than 20% [Caillon
et al., this issue; Parrenin et al., this issue].
As expected, the corrected record (Figure 7) only shows a weak impact of the site temperature: the largest observed shift occurs during the glacial-interglacial periods and is
approximately - -1%o.
Note that the sign of this correction is opposite to that for
the oceanic correction. Thus the corrected deuterium excess
profile for both ocean isotopic composition and site temperature does not differ from the initial measured profile by more than - +1-2%o, the largest corrections occurring during the glacial maxima (Figure 7). The overall decreasing trend within each climatic cycle is preserved after the
corrections but is somewhat reduced in magnitude.
An important conclusion from this analysis is that much of the deuterium excess variation measured on Vostok ice cannot be explained by changes in ocean isotopic composition or site
temperature and therefore results from moisture source
temperature variations, which are now discussed.
3. Discussion
To discuss the possible mechanisms controlling the
dominant moisture source temperature variations reconstructed with the deuterium excess record, it is necessary to consider the older and younger parts of the record separately. The younger part shows a large influence of
obliquity variations while the older part, more complex, is
uncorrelated with the obliquity (Figure 5). Also of interest are the periods of highest deuterium excess values and their relation to low-latitude SST changes.
3.1. The Most Recent 250,000 Years
Here we mainly focus on the 40,000 years period modulation of the deuterium excess. As for the most recent climatic cycle [Vimeux et al., 1999], the deuterium excess throughout the last 250,000 years is dominantly modulated by the obliquity periodicity and the variations of the deuterium excess are still strongly anticorrelated with the obliquity changes (Figure 5), basically controlling the variations of the mean annual insolation.
During times of low obliquity, the annual mean insolation at high latitudes is low, whereas the annual mean insolation at low latitudes (north of- 45øS) is high. As a result, the latitudinal insolation gradient between 20øS and 60øS, for example, is maximized at these times. Two climatic impacts of such an orbital configuration (low obliquity) may explain the corresponding low Vostok deuterium excess values. First, the maximum low-latitude insolation can strengthen evaporation of low latitude. Second, the maximum insolation gradient can increase latitudinal atmospheric moisture transport, enhancing the contribution of remote oceanic moisture sources and reducing the contribution of local,
cooler, oceanic moisture sources.
We thus interpret the anticorrelation between the obliquity and the deuterium excess in terms of the relative contribution of low and high latitudes to the precipitation at Vostok. This interpretation ignores the potentially complex influence of the insolation gradient on oceanic circulation. As with the atmospheric transport, it is probable that the latitudinal ocean heat transport is enhanced when the obliquity is low.
31,868 VIMEUX ET AL.' DEUTERIUM EXCESS IN VOSTOK ICE CORES I[[[ll[l[[[[][[l[l[[[[[[[ll[[[[[[•[l[[[l[[i -480 0.8 -o 0.4 .e o.o u_ -0.4 -0.8 24.0 23.5 23.0 22.5 2O 18 16 • 14 "• 12 10 162 o 160 o 158 156 154 0 100 200 300 400 Age (kyr)
Figure 5, Deuterium and deuterium excess along with (a) the Gaussian-filtered deuterium excess in the
obliquity
band
(0.025+0.005
kyr-•),
(b) the difference
between
the mean
annual
insolation
at 20øS
and
60øS,
and (c) the obliquity variations.
90 [ [ I 60 ,' 3O -3O -6O 0.5 3 -90 •.5 [ -180 -120 -60 0 60 120 180 Longitude
Figure 6. Variations of the annual deuterium excess in precipitation (in %0) due to a global oceanic oxygen 18 depletion of 1.2 %o (9.6%o for the deuterium), as simulated by the GISS general circulation model for a
VIMEUX ET AL ß DEUTERIUM EXCESS IN VOSTOK ICE CORES 31,869
0.0 -I
0.4 0.8 1.2 • ß ß -440 -460 -480 4 4 0 0 -4 -44 ' Adcorr/temperature
. .;.•.j, -
...
4
0 ... • ... •- •-•½' ... • • ... •-• ' .- [• -• - . t•, ?•t ,-•?.• 04 Adcorr/global
... •' ... •' ' ' .,.
l&l, ":• '['
'•."T i ...,.,
"•' "• ' .
• .... •' ' -f 'i ...•' • ... , 1
;;;•;; 0 0 -4 -4 0 50 100 150 200 250 300 350 400 Age (kyr)Figure
7. (a) seawater
•O adapted
from
Bassinot
eta/. [1994];
(b) Vostok
bD profile;
(c) deuterium
excess
(dotted
curve)
and
deuterium
excess
corrected
to account
for the oceanic
variations
of •O (solid
curve);
(d)
deuterium excess (dotted curve) and deuterium excess corrected to account for the local temperature (solid curve); (e) deuterium excess (dotted curve) and deuterium excess corrected to account for both ocean isotopic composition and site temperature (solid curve). Deuterium excess records are deviations from their modern values and have been sampled at 200 year temporal resolution.
However, an increase of high-latitude precipitation driven by stronger low-latitude moisture supply could opppose this effect if deep water formation is reduced by surface water freshening. A reduction of deep water formation would in turn reduce the equator-pole transfer and cool the high latitudes [Bryan, 1986; Manabe and Stouffer, 1995]. This system is further complicated by the NADW (North Atlantic Deep Water) flux into the southern ocean which has a significant impact on the sea surface salinity and thus on the deep circulation [Wang et al., 1999].
To conclude, the suggestion of Fimeux et al. [ 1999] that Vostok deuterium excess variations are driven by relative contributions of moisture from the low- and high-latitudes oceans appears valid for the last 250,000 years. We expect the same mechanism to operate in the Northern Hemisphere due to the symmetry of the obliquity forcing. Finally, the linear decrease of the obliquity-controlled deuterium excess maxima through a climatic cycle is not explained by the obliquity variations. In section 3.2, we therefore address the high deuterium excess values during interglacials and glacial inceptions and compare the deuterium excess during these periods with available low-latitude SST records.
3.2. Interglacial Periods and Glacial Inceptions
Our complete Vostok data set allows us to examine all of
the interglacial periods and glacial onsets in the past 420,000
years. A remarkable constant relationship between deuterium and deuterium excess can be observed during these periods
(Figure 8).
The deuterium excess starts to increase during the warmest period of the interglacial periods and attains a maximum over the cold stage that immediatly follows. This maximum is only slightly affected (less than -1%0) by the large decrease of the site temperature (see section 2.3). The amplitude of the
deuterium excess variation associated with the glacial onsets
increases over time from - 2%0 during the 11.3-11.2 transition to - 8%0 during the 5e-5d transition (long-term deuterium excess changes; see section 3.3). In all cases the glacial inceptions occur when the obliquity is low, and the relative contribution of the tropics to Vostok precipitation is
maximized. Moreover, the low concentrations of marine
sodium and dust in Vostok ice [Petit et al., 1999] during glacial inceptions suggest that the local circumpolar-Antarctic atmospheric circulation is weak, which may reduce the contribution of high-latitude ocean sources and further enhance the contribution from the low-latitude oceans.
The most recent glacial onset (5e-5d) has the highest deuterium excess levels in the entire Vostok record. Fimeux et al. [1999] have shown that in addition to the role of the insolation gradient, SSTs at low latitudes are maintained at interglacial values, whereas the high latitude ocean cools. This combination explains the particularly high deuterium
31,870 VIMEUX ET AL.: DEUTERIUM EXCESS IN VOSTOK ICE CORES -42O
-430
..•
,..,..•:,
_..=1.,
-440 --45O
-
j•
-460 --470 -
'i
, ' I ' I ' 0 10 20 30 Age (kyr)L18
-16 14 12 10-420
•i
i
-430
-440 -450 -460 '[.-470
(.,j!..,..,J
•,,!
-480
r..it,i'UL.i""""
I I I I I 100 110 120 130 140 150 Age (kyr) 18 16 14 12 10 -420 -430 -440 -450-460
:
-470
•'
,,
,.
ii
i
-48O I 22O 18 •'•T• • •-- 10 I I I I 230 240 250 260 270 Age (kyr) -420 ii i• -430 -440 - -450 -460 -470 - -48o _ i i i i 300 310 320 330 340 Age (kyr) 18 16 14 12 10 -42O - -430 - ..-. -440 o - C3 -450 - -460 - -470 - -480 --18
16
,., :" '14 d '.. ,"' 12 I 42O 380 390 400 410 10 Age (kyr)Figure
8. Vostok
glacial
inceptions
deuterium
(clotted
curve)
and
deuterium
excess
(solid
curve).
During the penultimate glacial cycle, the deuterium excess maxima are very high, both at the glacial onset (7.5-7.4 transition) and within the glacial (7.1-6.6), suggesting warm low-latitude SST during both the glacial inception and the full glacial climate. Indeed, SST reconstructions indicate that low-latitude SST are remarkably high and stable during the first two thirds of this climatic cycle [E. Bard, personal communication, 1999; Schneider et al., 1996]. The SST decrease only slightly at stage 6.2, while the deuterium excess
maximum is approximately 1%o lower than at the two
previous maxima.
Prior to 250,000 years B.P., as the anticorrelation with
obliquity is reduced, it is not possible to discuss the relative amplitude of the different deuterium excess peaks.
Nonetheless, as with the more recent cycles, the highest deuterium excess values occur during glacial inceptions and the deuterium excess decreases through the glacial. For all
VIMEUX ET AL.: DEUTERIUM EXCESS IN VOSTOK ICE CORES 31,871
probably reflect the long-term change of low-latitude SST [Schneider et al., 1996; Salvignac 1998] as progressive cooling occurs after the rapid glacial onset at high latitudes.
Thus the deuterium excess suggests that at glacial inceptions the low-latitude SST remain at their interglacial level for some time after the high latitudes cool abruptly. This is probably important for maintaining evaporation and supplying moisture to grow continental ice caps in the Northern Hemisphere.
3.3. Prior to 250, 000 Years B.P.
Before-250,000 years B.P. the correlation with the
latitudinal insolation gradient is absent, although the obliquity periodicity is still detectable by the spectral analysis (Figure 4). The uncertainty of the timescale is 10,000 to 15,000 years in the interval between 250,000 years and 420,000 years B.P., and this could partly explain the absence of correlation. Here we discuss other possible explanations for such change in deuterium excess variations, which occurs without any recognizable changes of deuterium behavior.
3.3.1. Climatic interpretation. A large change in the moisture source meteorological conditions could sufficiently alter the deuterium excess fluctuations and probably also the response of the ocean to variations of the latitudinal insolation gradient. However, no significant changes at 250,000 years are revealed by SST reconstructions from different ocean basins B.P. [Schneider et al., 1995, 1996; Salvignac et al., 1998; E. Bard, personal communication, 1999]. Thus it is unlikely that the deuterium excess variability change reflects a global oceanic change.
3.3.2. Diffusion interpretation. DiffUsion of isotopes in the firn could alter the deuterium excess record. This possibility has not been fully explored. However, the study carried out by Denux [1996] on Vostok deuterium has shown that 1000 year isotopic cycles are preserved through the entire 420,000 year record. Diffusion cannot therefore be responsible for weakening the 40,000 year variation.
3.3.3. G!aciological interpretation. The ice below Vostok station originates from surface deposition sites along the flow line up-glacier of Vostok, toward Ridge B (-300 km distant [Ritz, 1992]). Thus isotopes measured on the deepest part of the core reflect the composition of precipitation that has fallen fhrther inland, perhaps in regions being supplied by different oceanic sources than those for Vostok itself. In GT4 timescale an age of 250,000 years corresponds to a depth of 2820 m, for which ice flow models attribute a geographic origin approximately 230 km from Vostok. Surface snow :sotopic compositions differ east and west from Vostok, as indicated by different isotope-temperature covariations IDahe et al., 1994]. Moreover, the isotopic compositions of recent snow at Dome B and Vostok cannot fit on the same distillation line [douzel et al., 1996]. These two information suggest that air mass transport to Dome B and to Vostok occurs along different trajectories, possibly originating from different moisture source regions. Currently, there is now no surface deuterium excess data in this region, but future traverses may provide this information. Finally, the accumulation rate is 50% larger at Dome B than at Vostok, confirming that these locations are meteorologically distinct. Other parameters measured in Vostok ice support the idea that deep ice at Vostok was deposited in a different accumulation regime. First, the covariation of marine sodium flux with deuterium is different before and after 250,000 years (M.
Legrand, personal communication, 1999) and such a difference is most easily explained by a difference in the accumulation rate. Second, the glaciological and orbital approaches to date the Vostok core do not agree prior to 250,000 years. According to Parrenin et al. [this issue], the only way to reconcile both timescales is to assume a step-like accumulation change between Vostok and Ridge B at the
spatial location corresponding to 250,000 year old ice beneath
Vostok. The absence of deuterium changes is consistent with this interpretation, provided that climatic trends at Vostok and
Ridge
B are similar.
løBe profile, potentially
containing
information on past accumulation, will provide a further constraint on this interpretation.
The last possibility (that spatial changes in meteorology
cause a depth gradient in Vostok ice) seems the most plausible explanation for the change in deuterium excess at approximately 250,000 years B.P. This may explain the decreasing amplitude of the deuterium excess extrema over the entire profile: deep Vostok ice may have initially fallen at
a more central Antarctic location, where the contributions of
the different ocean basins are more homogeneous and the Indian Ocean moisture contribution less dominant (major contributor according to GISS simulation) [Delaygue et 2000].
Implicitly, this raises the question of how each oceanic basin responds to a common obliquity-driven latitudinal insolation change. It is possible that in the Indian Ocean there is a more linear response to insolation, in contrast with the Atlantic which has a large interhemispheric oceanic heat transport. To further explore this question, it would be necessary to compare Vostok deuterium excess history with
deuterium excess records obtained at other locations (in the
Atlantic sector, at Dome Fudji, and in the Indian-Pacific
sector, at EPICA-Dome C).
4. Conclusion
In this article we have considerably extended the 150,000 year record analyzed by l/imeux et al. [-1999] and have confirmed tbr the last 250,000 years the interpretation of the
deuterium excess in terms of the relative contribution of low
and high latitudes to Vostok precipitation.
Further, we have presented an original interpretation of the deuterium excess that accounts for several parameters
affecting the deuterium excess variations: (1) we account for
changes in relative humidity by establishing its covariation
with SST and (2) based on modeling studies, we evaluate the influence of both ocean isotopic composition and site
temperature on deuterium excess. The combined correction
indicates a 1ø-2øC smaller moisture source temperature
variation during terminations than would be estimated from the uncorrected data.
The lack of correlation with obliquity prior to 250,000 years B.P. is likely due to the ice flow implying a remote origin for the deep ice drilled at Vostok station. This
interpretation is supported by the few available isotopic
surface snow isotopic data, suggesting different oceanic
influences for precipitation recorded in the deepest part of the
Vostok core. Obtaining new surface isotopic data in this
region will help constrain the spatial change in moisture
origin upfiow of Vostok. Our interpretation is further supported by analyses of other Vostok parameters (marine
31,872 VIMEUX ET AL.: DEUTERIUM EXCESS IN VOSTOK ICE CORES
sodium, timescale construction), suggesting a change in the accumulation regime upstream Vostok possibly related to a different ocean origin of the air masses.
A primary result of our deuterium excess analyses for each of the last four glacial inceptions is that warm tropics may have been an important source of moisture to new and growing ice caps during those periods. Recent modeling of the coupled ocean-atmosphere system at 115,000 years in the Northern Hemisphere suggests a similar scenario for the North than as for the South during glacial inception: low latitudes, still warm, supplying moisture to high latitudes which become progressively colder as the termohaline circulation weakens due to the freshwater supply [Khodri et al., 2001 ].
Spatial [?imeux et al., 2001] and temporal deuterium
excess variations are now better characterized in East Antarctica, even if our interpretation need to be qualified in the future to incorporate insights from new deuterium excess records in this region (EPICA Dome C), in the Atlantic sector (Dome F, EPICA Dronning Maud Land) and at coastal
locations (Taylor Dome, Law Dome), or from new
reconstructions of SST.
Acknowledgments. We warmly thank Kurt M. Cuffey for providing valuable comments. The present manuscript has been
clearly improved with comments of the three reviewers. We also
thank all the participants in the drilling project on the field. Vostok is
supported in France by the Programme National d'Etude du Climat (PNEDC).
References
Armengaud, A., R.D. Koster, J. Jouzel, and P. Ciais, Deuterium
excess in Greenland snow: Analysis with simple and complex models, J. Geophys. Res., 103, 8947-8953, 1998.
Bassinot, F., L. Labeyrie, E. Vincent, X. Quidelleur, N.J. Shackleton, and Y. Lancelot, The astronomical theory of climate and the age of the Brunhes-Matuyama magnetic reversal, Earth Planet. Sci.
Lett., 126, 91-108, 1994.
Bryan, F., High-latitude salinity effects and interhemispheric
thermohaline circulations, Nature, 323, 301-304, 1986.
Bush, A.B.G., and S.G.H. Philander, The Climate of the Last Glacial
Maximum: Results from a coupled atmosphere-ocean general circulation model, J. Geophys. Res., 104, 24,509-24,525, 1999. Caillon, N., J.P. Severinghaus, J.M. Bamola, J. Chappellaz, J. Jouzel,
and F. Parrenin, Estimation of temperature change and of gas age- ice age difference, 108 kyr B.P., at Vostok, Antarctica, •.
Geophys. Res., this issue.
Craig, H., Isotopic variations in meteoric waters, Science, 133, 1702-1703, 1961.
Cuffey, K.M., G.D. Clow, R.B. Alley, M. Stuiver, E.D. Waddington and R.W. Saltus, Large Arctic temperature change at the Wisconsin-Holocene glacial transition, Science, 270, 455-458,
1995.
Dahe, Q., J.R. Petit, J. Jouzel, and M. Stievenard, Distribution of
stable isotopes in surface snow along the route of the 1990 International Trans-Antarctica Expedition, •. Glaciol., 40,
107-118, 1994.
Dansgaard, W., Stables isotopes in precipitation, Tellus, 16, 436-447, 1964.
Delaygue, G., Relations entre surface oc6anique et composition isotopique des pr6cipitations antarctiques: Simulation pour
diff•rents climats, Ph.D. thesis, Univ. Aix-Marseille, Marseille, France, 2000.
Delaygue, G., V. Masson, J. Jouzel, R.D. Koster, and R.J. Healy, The
origin of antarctic precipitation: A modelling approach, Tellus,
Ser. B, 52, 19-36, 2000.
Denux, F., Diffusion du signal isotopique dans le n•ve et dans la
glace. Implication pour l'6chantillonnage, Ph.D. thesis, Univ.
Joseph Fourier, Grenoble, France, 1996.
Dwyer, G.S., T.M. Cronin, P.A. Baker, M.E. Raymo, J.S. Buzas, and T. Corr•ge, North Atlantic deepwater temperature change during late Pliocene and late Quaternary climatic cycles, Science, 270,
1347-1351, 1995.
Johnsen, S.J., W. Dansgaard, and J.W.C. White, The origin of Artic precipitation under present and glacial conditions, Tellus, Ser. B,
41,452•468, 1989.
Jouzel, J., and L. Merlivat, Deuterium and oxygen 18 in precipitation: modeling of the isotopic effects during snow formation, •. Geophys. Res., 89, 11,749-11,757, 1984.
Jouzel, J., R.D. Koster, R.J. Suozzo, and G.L. Russell, Stable water
isotope behaviour during the last glacial maximum: A general circulation model analysis, d. Geophys. Res., 99, 25,791-25,801, 1994.
Jouzel, J., et al., Climatic interpretation of the recently extended Vostok ice records, Clim. Dyn., 12, 513-521, 1996.
Jouzel, J., J.R. Petit, R. Souchez, N.I. Barkov, V.Ya. Lipenkov, D. Raynaud, M. Stievenard, N.I. Vassiliev, V. Verbeke, and F. Vimeux, More than 200 meters of lake ice above subglacial Lake
Vostok, Antarctica, Science, 286, 2138-2141, 1999.
Khodri, M., Y. Leclainche, G. Ramstein, P. Braconnot, and O. Marti, Simulating the amplification of orbital forcing by ocean feedbacks in the last glaciation, Nature, 410, 570-574, 2001.
Lea, D.W., D.K. Pak, and H.J. Spero, Climate impact of late Quaternary equatorial Pacific sea surface temperature variations,
Science, 289,1719-1724, 2000.
Lorius, C., and L. Merlivat, Distribution of mean surface stable
isotope values in east Antarctica: observed changes with depth in a coastal area, in Isotopes and Impurties in Snow and Ice, 1.4HS
PUN., 118, 127-137, 1977.
Majoube, M., Fractionnement en oxyg6ne 18 et en deut6rium entre l'eau et sa vapeur, d. Chim. Phys., 10, 1423-1436, 1971.
Manabe, S., and R.J. Stouffer, Simulation of abrupt climate change
induced by freshwater input to the North Atlantic Ocean, Nature, 378, 165-167, 1995.
Merlivat, L., and J. Jouzel, Global climatic interpretation of the deut6rium-oxygen 18 relationship for precipitation, d. Geophys.
Res., 84, 5029-5033, 1979.
Paillard, D., L. Labeyrie, and P. Yiou, Macintosh program performs
time-series analysis, Eos Trans..4GU, 77, 379, 1996.
Parrenin, F., J. Jouzel, C. Waelbroeck, C. Ritz, and J.-M. Barnola,
Dating the Vostok ice core by an inverse method, J. Geophys.
Res., this issue.
Petit, J.R., et al., 420,000 years of climate and atmospheric history
revealed by the Vostok deep Antarctic ice core, Nature, 399, 429-436, 1999.
Ritz, C., Un mod61e thermo-m6canique d'6volution pour le bassin
glaciaire antarctique Vostok-Glacier Byrd: sensibilit6 aux valeurs
des param6tres mal connus, Ph.D. thesis, Univ. Joseph Fourier,
Grenoble, France, 1992.
Salvignac, M.E., Variabilit6 hydrologique et climatique dans l'Oc6an
Austral (secteur indien) au cours du Quatemaire terminal, Essai de corr6iations inter-h6misph6riques, Ph.D. thesis, Univ. de
Bordeaux 1, Bordeaux, France, 1998.
Schneider, R.R., P.J. Maller, and G. Ruhland, Late quaternary
surface circulation in the east equatorial South Atlantic: Evidence
from alkenone sea surface temperatures, Paleoceanography, 10,
197-219, 1995.
Schneider, R.R., P.J. Maller, G. Ruhland, G. Meinecke, H. Schmidt,
and G. Wefer, Late Quaternary surface temperatures and
productivity in the east-equatorial South Atlantic: Response to
changes in trade/monsoon wind forcing and surface water advection, in The South Atlantic: Present and Past circulation, edited by G. Wefer, W.H. Berger, G. Siedler, D.J. Webb, New- York, pp. 527-551, Springer-Verlag, 1996.
Schrag, D.P., G. Haupt, and D.W. Murray, Pore fluidsconstraints on the temperature and oxygen isotopic composition of the glacial
ocean, Science, 272, 1930-1932, 1996.
Shackleton, N.J., The 100,000-year ice-age cycle identified and
found to lag temperature, carbon dioxide, and orbital eccentricity,
Science 289, 1897-1902, 2000.
Vimeux, F., Variations de l'exc6s en deut6rium en Antarctique au
cours des 400 000 derni6res ann6es: Implications climatiques,
VIMEUX ET AL.: DEUTERIUM EXCESS IN VOSTOK ICE CORES 31,873
Vimeux, F., V. Masson, J. Jouzel, M. Stievenard, and J.R. Petit, Glacial-interglacial changes in ocean surface conditions in the Southern Hemisphere, Nature, 398, 410-413, 1999.
Vimeux, F., V. Masson, J. Jouzel, J.R. Petit, E.J. Steig, M.
Stievenard, R. Vaikmae, and J.W.C. White, Holocene
hydrological cycle changes in Southern Hemisphere documented in East Antarctic deuterium excess records, Clim. Dyn., 17,
503-513,2001.
Wang, X., P. Stone, and J. Marotzke, Global thermohaline
circulation, part I, Sensitivity to atmospheric moisture transport, J.
Clim., 12, 71-82, 1999.
J. Jouzel, V. Masson, M. Stievenard, and F. Vimeux, Laboratoire
des Sciences du Climat et de l'Environnement (LSCE), UMR CEA- CNRS 1572, Orme des Merisiers, CE Saclay, 91191 Gif-sur-Yvette Cedex, France. (vimeux•lsce.saclay.cea. fr)
J.R. Petit, Laboratoire de Glaciologie et gdophysique de l'Environnement (LGGE), CNRS, B.P. 96, Domaine Universitaire,
38402 Saint Martin d'Heres Cedex, France.
G. Delaygue, Centre Europden de Recherche et d'Enseignement en Gdosciencesde l'Environnement (CEREGE), UMR 6635, Europole de l'Arbois, B.P. 80, 13545 Aix-en-?rovence Cedex,


![Figure 7. (a) seawater •O adapted from Bassinot eta/. [1994]; (b) Vostok bD profile; (c) deuterium excess (dotted curve) and deuterium excess corrected to account for the oceanic variations of •O (solid curve); (d) deuterium excess](https://thumb-eu.123doks.com/thumbv2/123doknet/13008652.380470/8.918.108.824.95.578/figure-seawater-bassinot-deuterium-deuterium-corrected-variations-deuterium.webp)

