HAL Id: hal-00291575
https://hal.archives-ouvertes.fr/hal-00291575
Submitted on 27 Jun 2008
HAL is a multi-disciplinary open access archive for the deposit and dissemination of sci-entific research documents, whether they are pub-lished or not. The documents may come from teaching and research institutions in France or abroad, or from public or private research centers.
L’archive ouverte pluridisciplinaire HAL, est destinée au dépôt et à la diffusion de documents scientifiques de niveau recherche, publiés ou non, émanant des établissements d’enseignement et de recherche français ou étrangers, des laboratoires publics ou privés.
Optimization of Poly-Di-Methyl-Siloxane (PDMS)
substrates for studying cellular adhesion and motility
D. Fuard, T. Tzvetkova-Chevolleau, S. Decossas, Philippe Tracqui, P.
Schiavone
To cite this version:
D. Fuard, T. Tzvetkova-Chevolleau, S. Decossas, Philippe Tracqui, P. Schiavone. Optimization of Poly-Di-Methyl-Siloxane (PDMS) substrates for studying cellular adhesion and motility. Microelectronic Engineering, Elsevier, 2008, 85 (5-6), pp.1289-1293. �10.1016/j.mee.2008.02.004�. �hal-00291575�
Optimization of Poly-Di-Methyl-Siloxane (PDMS) substrates for studying cellular adhesion and motility
D. Fuard a, T. Tzvetkova-Chevolleau a,b, S. Decossas a, P. Tracqui b, P. Schiavone a,c
a Laboratoire des Technologies de la Microélectronique, 17 rue des Martyrs, 38054 Grenoble, France
b Dynacell group/TIMC-IMAG, Faculté de Médecine de Grenoble, 38700 La Tronche, France
c GMCAO/TIMC-IMAG, Faculté de Médecine de Grenoble, 38700 La Tronche, France
ABSTRACT
The cellular adhesion and motility have direct implications in the tumoral-metastatic cells development or in the tissue engineering mechanisms for instance. Our work aims at knowing the impact of substrate mechanical properties on those adhesion and motility mechanisms by modifying bulk rigidity, surface energy and composition of a bio-compatible Poly-Di-Methyl-Siloxane (PDMS) substrate. We show how a wide range of PDMS rigidity can be obtained and how Ar/O2-based plasmas turn PDMS surface to hydrophilic. A correlation between surface energy, bulk rigidity, cells adhesion and growth is finally shown.
INTRODUCTION
The first intuition on how cells surrounding environment (extra-cellular matrix or ECM) influences the cellular adhesion and motility is to investigate the effect of chemical or biological changes. Recently, several studies focus on how substrate mechanical changes influence cellular adhesion and motility. 1,2,3,4,5 This provides new insights on explaining the impact of substrate mechanical properties in many fundamental biological processes like embryo-genesis1, tissues recovery6,7, phagocytosis7,8,9,10, or metastases development4,11 for instance.
As Poly-Di-Methyl-Siloxane (PDMS) is a widely-used biocompatible substrate for cell behaviour studies5,12, the aim was here to get more information on the PDMS rigidity as well as to confirm the need of hydrophilic substrates for cellular adhesion and motility studies. This preliminary work represents a cross disciplinary approach between researchers coming from biology and others coming from the material sciences and microelectronics area. Thus the effects of cross-linker concentration and baking time on PDMS rigidity, the effect of plasma treatment on PDMS surface hydrophobicity and the relationship between PDMS hydrophobicity, cell adhesion, cell surface, number of membrane protrusions and cell polarisation are presented at the same time in this paper. The impact of rigidity and topography pattern designs on cell motility will be presented in a future article.
EXPERIMENTAL
The PDMS used in the present work is a liquid bi-component silicone pre-polymer, Sylgard 184 manufactured by Dow Corning (Midland, MI). The PDMS rigidity can be controlled by the cross-linker agent concentration in the PDMS solution, the temperature and the time of baking. As the time and the temperature of baking are closely linked, we choose to bake the PDMS samples at a constant temperature of 100°C (normal pressure conditions).
The tensile testing machine used for the stress measurements is a stretching tool from EMKA Technologies (Paris, France). The PMDS stripes are clamped to a force gauge and to a movable mass which can be moved along the vertical axis with a manual hand crank. The PDMS samples are slowly stretched without significant loading speeds. The force gauge is connected to a computer for real time force displaying on the computer interface. Unfortunately, this force
gauge does not allow to measure forces of less than 30kPa with a sufficient reliability. Marks have been drawn on every PDMS sample and a picture of the stretched sample is taken for every force using a digital camera. We get the strain values as a function of the applied force by the direct measurement of the length variations between the marks on the digital pictures. The sample cross-section, for every stretched length, is drawn from the measurement of the PDMS sample width (from the front view picture of the sample) and thickness (deduced from the side view). Then the PDMS Young’s modulusE is extracted from the mono-axial strain-stress equation σzz = ⋅E ε where σzz is the axial true stress applied on the material and ε is axial
strain of the material. We have z zz
z
dF S
σ = , where dFz is the axial resultant force applied to the
material and Sz is the material cross-section;
0 0
l l
δ
ε = , where l0 is the initial length of the sample and δl0 is the stretch for the current axial resultant force. Thus the material Young’s modulus is
obtained by 0 0 z z l dF E S δl
= ⋅ . The uncertainty on E is less than 20%.
The plasma treatment of the PDMS surfaces were conducted in a LAM 9400 SE plasma etcher, using 100sccm oxygen or argon, at 5mTorr pressure, for 2 min, without substrate polarisation. The PDMS surface energy was calculated using the Fowke’s method.13 The atomic concentration on the PDMS surface is given by XPS analysis. Experimental details of the XPS system can be found in reference [14].
Murin 3T3 fibroblasts are used here. Cells are cultured in Dulbecco’s Modified Eagle’s Medium (DMEM) (Sigma Aldrich) with 4500 mg/l L glucose, supplemented with 10% foetal calf serum, 200mM L-glutamine, 0.25% penicillin/streptomycin solution. All cell culture reagents, media and sera were obtained from Invitrogen (Invitrogen Ltd, UK). The cells are maintained at 37°C in a humidified atmosphere with a constant 5% CO2 rate. The PDMS substrates are coated with 3.5µg/cm² fibronectin (Sigma-Aldrich), a natural component of the cell ECM, and inoculated with 6500 cells per cm². We maintain the hydrophilic properties of the substrates after plasma treatment by keeping them in H2O2 of about 18h before starting of the experiment. The amount of cells that adhere on the substrate is measured 1h after cell seeding, using morphologic criterion. Cells with a ratio of the short/ long axes lower than 0.75 are considered as polarised or adherent to the PDMS surfaces. Over 120 cells per sample are considered. Cells morphologic parameters such as cell area, polarisation and average number of membrane protrusions are measured 17h after cells seeding. The final cell polarisation is quantified from the ratio between the short and long cell axes.
All results are reported as mean ± standard deviations of the mean. Analysis of the variances was performed using two-way ANOVA for independent samples developed by Vassar Colleges, USA, ©Richard Lowry 2001- 2007 (http://faculty.vassar.edu/lowry/anova2u.html). Statistical significance was set at P < 0.05.
RESULTS
a PDMS Young’s modulus measurements:
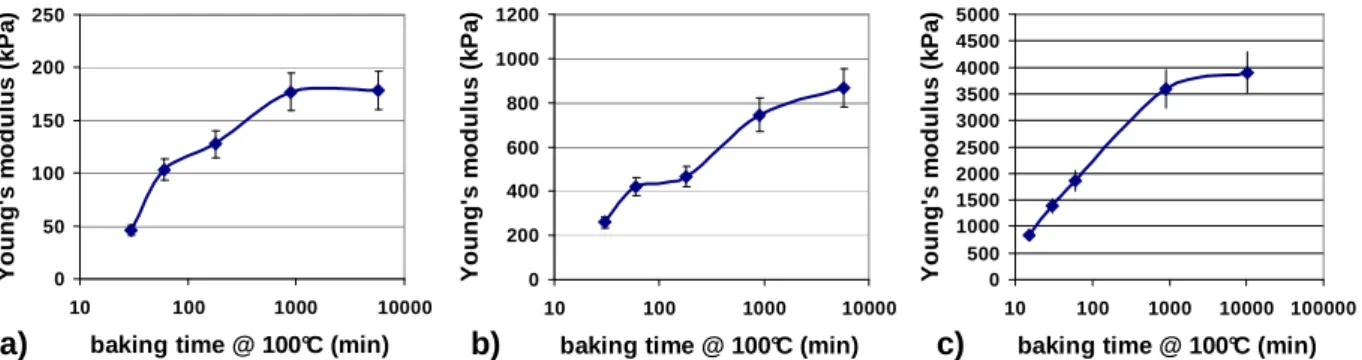
Figure 1 gathers the results of PDMS Young’s modulus measurements using the stretching tool experiment. We get this Young’s modulus by the mean slope of the PDMS stress/strain curves. 3%, 5% and 10% cross-linker concentrations in the PDMS solution respectively allow to obtain PDMS rigidities of 50kPa to 200kPa, 200kPa to 800kPa and 800kPa to 4MPa for baking time at 100°C ranging from 15min to 3 days. A higher baking temperature allows a shorter baking time,
but we chose to fix the baking temperature at 100°C in this study to depict the Young’s modulus variations as a function of the baking time.
b elastic deformations and ‘memory effect’ of the PDMS:
The figure 2a shows that the first extension of virgin PDMS exhibits more stress than the second and the subsequent PDMS extensions, which exhibit similar stress-strain behaviour if no more maximum stress is applied. This phenomenon is known as the Mullins effect,15 which is more obvious for strain up to 2 or 3.16 Unfortunately, our present experimental setup is not able to measure forces of less than 30kPa and a strain over 1 lead to the sample damage and breaking. Thus, the figure 2a only shows a part of the usual PDMS tensile stress/strain behaviour. We have to improve our experimental setup for a better comparison with others results on PMDS 17. For PDMS extensions of 0.7 in strain, the length gain (compared to virgin PDMS samples lengths) is of 5% and 2% for 3% and 5% cross-linker concentrations respectively. This deformation is negligible for 10% cross-linker concentration in the PDMS solution.
c PDMS Young’s modulus stability as a function of time:
The PDMS Young’s modulus stability has been checked 5 months after samples preparation. The PDMS samples were kept in air under normal conditions of temperature (20°C) and pressure. The figure 2b shows that PDMS samples thermo-cured for less than 5h exhibit a Young’s modulus rise of about 50% for every cross-linker concentration in the PDMS, unlike the PDMS samples thermo-cured for more than 10h where no significant rigidity rise is noticed.
d Plasma treatments:
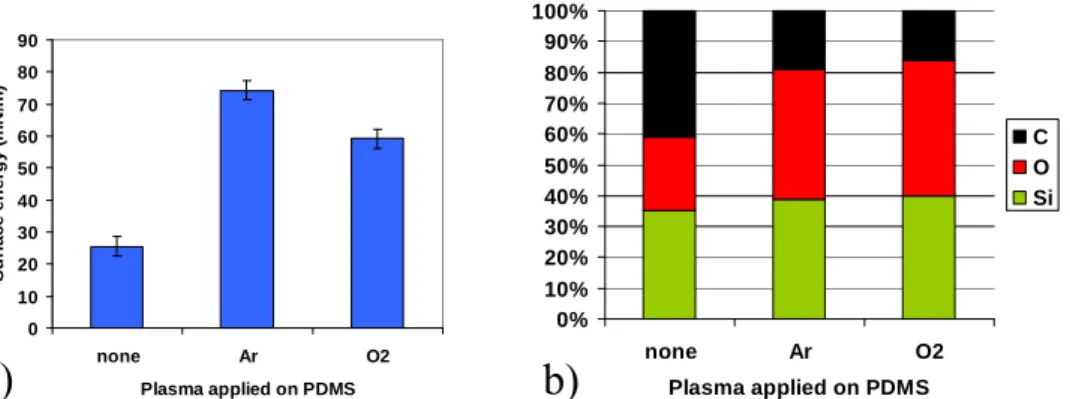
PDMS intrinsically presents a hydrophobic surface, mainly because of the presence of methyl groups which are highly hydrophobic.18 Figure 3 shows that the surface energy measurement of our untreated PDMS is between 20 and 30mN/m and its surface chemical composition, measured by XPS, is close to the PDMS formula (O-Si(CH3)2)n. Among several plasma chemistries (Ar, O2, HBr, Cl2), Ar and O2 exhibits the best rate of methyl group elimination. Figure 3a shows that Ar and O2 plasma treatments turn PDMS surface into hydrophilic, with surface energies ranging from 60 to 80mN/m. XPS studies, depicted on figure 3b, shows that these plasma treatments remove the hydrophobic methyl groups and change the PDMS surface into a more SiO2-like material.
e Cell adhesion and morphology as a function of plasma treatment:
Figure 4a shows that getting a hydrophilic substrate highly favours the cell adhesion, with a cell adhesion rate rising from 1-2% for untreated PDMS to about 30% for plasma treated PDMS. Figure 4b, 4c and 4d respectively show that this better cell adhesion is correlated with significantly more polarised cells and a doubling of the cell surface as well as the number of cellular protrusions, which lead to more mobile cells.
CONCLUSION
This work shows that modifying the cross-linker concentration and the baking time allows the tuning of PDMS rigidity from 50kPa to 4MPa. PDMS exhibits a Mullins effect behaviour under stress which has to be taken into account for cell adhesion forces evaluation. A correlation between Ar or O2 plasma treatment, higher PDMS surface energy (hydrophilic), higher cell adhesion, higher cell surface, larger cell polarization and more cell membrane protrusions has been found. Thus our first results highlight that adequate tuning of the PDMS surfaces physical chemistry can control the fibroblast adhesion and morphology (surface, polarisation and protrusions). This is in direct relation to the tissue modelling and reorganisation
This preliminary work will be followed by the study of PDMS (Sylgard 184) elastic behaviour and by cell behaviour assessment on various PDMS substrate rigidities and pattern designs.
0 50 100 150 200 250 10 100 1000 10000
baking time @ 100°C (min)
Y o u n g 's m o d u lu s ( k P a ) 0 200 400 600 800 1000 1200 10 100 1000 10000
baking time @ 100°C (min)
Y o u n g 's m o d u lu s ( k P a ) 0 500 1000 1500 2000 2500 3000 3500 4000 4500 5000 10 100 1000 10000 100000
baking time @ 100°C (min)
Y o u n g 's m o d u lu s ( k P a ) a) b) c) 0 50 100 150 200 250 10 100 1000 10000
baking time @ 100°C (min)
Y o u n g 's m o d u lu s ( k P a ) 0 200 400 600 800 1000 1200 10 100 1000 10000
baking time @ 100°C (min)
Y o u n g 's m o d u lu s ( k P a ) 0 500 1000 1500 2000 2500 3000 3500 4000 4500 5000 10 100 1000 10000 100000
baking time @ 100°C (min)
Y o u n g 's m o d u lu s ( k P a ) a) b) c)
Figure 1: PDMS Young’s modulus as a function of the baking time at 100°C for a) 3%, b) 5% and c) 10% of cross-linker concentration in the PDMS solution.
a) 40 60 80 100 120 140 160 0,1 0,2 0,3 0,4 0,5 0,6 0,7 0,8 0,9 εεεε s tr e s s ( k P a ) first stretching 40 60 80 100 120 140 160 0,1 0,2 0,3 0,4 0,5 0,6 0,7 0,8 0,9 εεεε s tr e s s ( k P a ) first stretching b) 0 200 400 600 800 1000 1200 10 100 1000 10000
baking time @100°C (minute)
Y o u n g 's m o d u lu s ( k P a ) 5 months later 0 200 400 600 800 1000 1200 10 100 1000 10000
baking time @100°C (minute)
Y o u n g 's m o d u lu s ( k P a ) 5 months later
Figure 2: a) stress / strain curve of PDMS (3h backing time at 100°C, using 3% of cross-linker concentration in the PDMS solution) for repeated extension-retraction strain cycles. The red part of the curve corresponds to the first stretching. The uncertainty errors of the strain and stress measurements are respectively of less than 1% and 2%. b) PDMS Young’s modulus evolution for various baking time at 100°C, using 3% of cross-linker concentration in the PDMS solution: The solid line for Young’s moduli measurements taken right after PDMS synthesis and the solid line with round markers for Young’s moduli measurements taken 5 months later.
0% 10% 20% 30% 40% 50% 60% 70% 80% 90% 100% none Ar O2 Plasma applied on PDMS C O Si 0 10 20 30 40 50 60 70 80 90 none Ar O2 Plasma applied on PDMS S u rf a c e e n e rg y ( m N /m )
a)
b)
0% 10% 20% 30% 40% 50% 60% 70% 80% 90% 100% none Ar O2 Plasma applied on PDMS C O Si 0 10 20 30 40 50 60 70 80 90 none Ar O2 Plasma applied on PDMS S u rf a c e e n e rg y ( m N /m )a)
b)
Figure 3: a) surface energy and b) surface atomic composition (XPS analysis) of the PDMS as a function of the plasma treatment applied.
0 10 20 30 40 none Ar O2 Plasma applied on PDMS p e rc e n ta g e o f C e ll a d h e s io n a ft e r 1 h 0 0,2 0,4 0,6 0,8 1 none Ar O2 Plasma applied on PDMS w id th o v e r le n g th c e ll r a ti o
a)
b)
0 2 4 6 8 10 12 none Ar O2 Plasma applied on PDMS N b o f m e m b ra n e p ro tr u s io n s 0 1000 2000 3000 4000 5000 6000 none Ar O2 Plasma applied on PDMS C e ll s u rf a c e ( p x l² , A U )c)
d)
0 10 20 30 40 none Ar O2 Plasma applied on PDMS p e rc e n ta g e o f C e ll a d h e s io n a ft e r 1 h 0 0,2 0,4 0,6 0,8 1 none Ar O2 Plasma applied on PDMS w id th o v e r le n g th c e ll r a ti oa)
b)
0 10 20 30 40 none Ar O2 Plasma applied on PDMS p e rc e n ta g e o f C e ll a d h e s io n a ft e r 1 h 0 0,2 0,4 0,6 0,8 1 none Ar O2 Plasma applied on PDMS w id th o v e r le n g th c e ll r a ti oa)
b)
0 2 4 6 8 10 12 none Ar O2 Plasma applied on PDMS N b o f m e m b ra n e p ro tr u s io n s 0 1000 2000 3000 4000 5000 6000 none Ar O2 Plasma applied on PDMS C e ll s u rf a c e ( p x l² , A U )c)
d)
0 2 4 6 8 10 12 none Ar O2 Plasma applied on PDMS N b o f m e m b ra n e p ro tr u s io n s 0 1000 2000 3000 4000 5000 6000 none Ar O2 Plasma applied on PDMS C e ll s u rf a c e ( p x l² , A U )c)
d)
Figure 4: a) percentage of cell adhesion, b) polarisation, c) cell surface and d) number of cells membrane protrusions as a function of the plasma treatment applied on the PDMS surface.
REFERENCES:
1
J. Folkman, A.Moscona. Nature 273 (1978) 345-349.
2
R.J. Pelham, Y. Wang. Proc Natl Acad Sci USA 94 (1997) 13661-13665.
3
S. Huang. J. Mol. Med. 77 (1999) 469–480.
4
L. Tranqui, P. Tracqui. C R Acad Sci III 323 (2000) 31-47.
5
E.K. Yim, R.M. Reano, S.W. Pang, A.F. Yee, C.S. Chen, K.W. Leong. Biomaterials 26 (2005) 5405-5413.
6
C.F Deroanne, C.M. Lapiere, B.V. Nusgens. Cardiovasc Res 49 (2001) 647-658.
7
W.H. Guo, M.T. Frey, N.A. Burnham, Y.L. Wang. Biophysical Journal 90 (2006) 2213-2220.
8
K.A. Beningo, Y.L. Wang. Trends Cell Biol 12 (2002) 79-84.
9
S. Fereol, R. Fodil, B. Labat, S. Galiacy, V.M. Laurent, B. Louis, D. Isabey, E. Planus. Cell Motil Cytoskeleton 63 (2006) 321-340.
10
S. Li, S. Bhatia, Y.L. Hu, Y.T. Shiu, Y.S. Li, S. Usami, S. Chien. Biorheology 38 (2001) 101-108.
11
M.J. Paszek, V.M. Weaver. J Mammary Gland Biol Neoplasia 9 (2004) 325-342.
12
G.K. Toworfe, R.J. Composto, C.S. Adams, I.M. Shapiro, P. Ducheyne. J Biomed Mater Res A 71 (2004) 449-461.
13
F. M. Fowkes. Amer. Chemical Soc. 87 (1965) 1–12.
14
F. H. Bell, O. Joubert, L. Vallier. J. Vac. Sci. Technol. B 14 (1996) 1796.
15
L. Mullins. Rubber Chem Technol 42 (1969) 339–362.
16
A. Dorfmann, R.W. Ogden. Int. J. Solids Structures 41 (2004) 1855–1878.
17
D.E. Hanson, M. Hawley, R. Houlton, K. Chitanvis, P. Raeb, E.B. Orlerb, D.A. Wrobleski. Polymer 46 (24) (2005) 10989-10995.
18
P.-G. de Gennes, F. Brochard-Wyart, D. Quéré. “Capillarity and Wetting Phenomena: Drops, Bubbles, Pearls, Waves” (Springer, New-York, 2004).