Thermodynamic modelling of the Fe–Sn–Zr system based on new experiments and first-principles calculations
Paul Lafayea,b,*, Caroline Toffolon-Masclet a, Jean-Claude Crivellob, Jean-Marc Joubertb**
aDEN-Service de Recherches Métallurgiques Appliquées, CEA, Université Paris-Saclay,
F-91191 Gif-sur-Yvette, France
b ICMPE, UPEC-CNRS, 94320, Thiais, France ** corresponding author
Tel.: +33 1 49 78 13 44; Fax: +33 1 49 78 12 03 E-mail address: joubert@icmpe.cnrs.fr
Abstract
The Fe–Sn–Zr system has been studied by first principles calculation and modelled with the Calphad method using the literature and new experimental data. The work includes a revision of Fe–Sn and Fe–Zr systems. Our experimental study has confirmed that the W5Si3 phase
(stoichiometry Zr5Sn2,3Fe0,7) is stable at 1350 °C but also down to 1000 °C. Moreover, the
crystal structure of the X” phase has been determined. The formation enthalpies of all the ordered configurations of the C15, C16, C36, E1a phases and the stoichiometric Fe5Sn3,
Fe3Sn2, FeSn,FeSn2, Fe23Zr6, FeSn2Zr6 (θ), Fe36.36Sn36.36Zr27.27 (N) et Fe14.39Sn43.47Zr39.13 (X’’)
compounds have been calculated using the Density Functional Theory (DFT). The mixing enthalpies of the A1, A2 and A3 binary solid solutions have been calculated using the Special Quasirandom Structures (SQS) and DFT calculation. From these new experimental and calculated data, new thermodynaùic assessments are proposed for Fe–Sn, Fe–Zr and Fe–Sn– Zr systems.
Keywords: Fe–Sn–Zr; Calphad; DFT; SQS; thermodynamic assessment; phase equilibrium
1. Introduction
The Fe–Sn–Zr system is a system of great interest particularly for the nuclear industry both for low and high temperature applications. Regarding the low temperature applications, Zr– rich alloys (Zircaloy-4) containing Fe and Sn as major alloying elements have been employed for fuel cladding and as structural components in Light Water Reactors (LWR) and Heavy Water Reactors (HWR). Similarly for high temperature applications, Fe–Zr alloys are involved in the Fe–Zr–U–O quaternary system for in-vessel Corium studies [1].
At last, Fe–Zr alloys are promising candidate for hydrogen storage, particularly Fe2Zr
intermetallic compound because of its good gravimetric storage capacity, and the fast kinetics of hydrogen absorption–desorption and low equilibrium pressure at room temperature as well [2].
Several Calphad description of the Fe–Zr system are available in the literature [3–7]. Most of them [3–6] were obtained without DFT calculations and the resulting assessed formation enthalpies exhibit large deviations from the DFT ones. Moreover, recent papers devoted to DFT calculations of the Fe–Zr binary system [8,9] exhibit erroneous conclusions concerning the stability of the C16 and the Fe23Zr6 phases. Thus, several recent publications [7,10,11]
consider the Fe23Zr6 phase as stable despite the existence of several studies demonstrating its
unstability [9,12–14].
Similarly, the Calphad modelling of the Fe–Sn and Sn–Zr systems available in the literature have been carried out without DFT calculations [15,16] and the corresponding ground-states strongly disagree with our calculated energy level.
Thus, new thermodynamic assessments of the Fe–Sn, Fe–Zr and Sn–Zr systems are necessary. The Calphad description of the Sn–Zr system has been published separately in a paper dedicated to the Cr–Nb–Sn–Zr quaternary system [17]. We present here new Calphad assessments of the Fe–Sn and Fe–Zr binary systems and the description of the Fe–Sn–Zr ternary system. We provide new experimental results on the Fe–Sn–Zr ternary system concerning the stability of the W5Si3 phase (stoichiometry Zr5Sn2,3Fe0,7) based on a
comparison with the recent results of Calta et al. [18] in the Fe–Sn–Hf system. The formation enthalpies of the C15, C16, C36, E1a phases and the stoichiometric Fe5Sn3, Fe3Sn2, FeSn,
FeSn2, Fe23Zr6, FeSn2Zr6 (θ), Fe36.36Sn36.36Zr27.27 (N) et Fe14.39Sn43.47Zr39.13 (X’’) compounds
have been calculated using the Density Functional Theory (DFT). The SQS method is used with DFT calculations in order to calculate the enthalpies of mixing of the A1, A2 and A3 binary solid solutions. The first part of this paper is dedicated to the literature survey of the different systems; the second part is dedicated to the methodology and the third part to our results.
2. Literature survey
2.1 The Fe–Sn binary system 2.1.1 Experimental data
The Fe–Sn system presents four intermetallic phases, Fe5Sn3, Fe3Sn2, FeSn and FeSn2. The
phase diagram also includes two eutectoid reactions as well as one monotectic reaction. One may note the presence of a miscibility gap in the liquid phase below 1370 °C [19].
The invariant reactions were measured by Mills et al. [20], Tréheux et al. [21] and Fedorenko et al. [22]. The liquidus has been measured by Isaac et al. [23], Arita et al. [24], Predel et al. [19] in the Fe-rich part and by Isaac et al. [23], Arita et al. [24], Predel et al. [19] and Campbell et al. [25] in the Sn-rich. The miscibility gap in the liquid phase was measured
by Shiraishi et al. [26], Mills et al. [20], Campbell et al. [25], Predel et al. [19] and Nunoue et al. [27]. The solubility of the Fe-rich bcc solid solution was mainly studied by Mills et al. [20], Yamamoto et al. [28] and Arita et al. [24].
2.1.2 Thermodynamic data
The formation enthalpies of the FeSn and FeSn2 compounds have been measured by
electromotive force by Eremenko et al. [29] and Zabdyr et al. [30]. Measurements of Fe and Sn activities in the liquid phase have been performed by Yazawa et al. [31], Shiraishi et al. [26], Wagner et al. [32], Fedorenko et al. [22], Yamamoto et al. [33] and more recently by Nunoue et al. [27]. The mixing enthalpy of the liquid phase was measured by Wagner et al. [32], Petrushevski et al. [34], Yamamoto et al. [33] and Lueck et al. [35]. Note that the mixing enthalpies of the solid solutions have never been determined.
2.1.3 Thermodynamic assessment
The Fe–Sn system has been assessed by many authors [15,36–38]. The most recent study was carried out by Huang et al.[38] considering all experimental data available in the literature except for the mixing enthalpies of the liquid phase measured by Petrushevski et al. [34].
2.2 The Fe–Zr binary system 2.2.1 Experimental data
The Fe–Zr system has been experimentally investigated by many authors [39–49]. The Zr-rich part of the diagram was first studied by Hayes et al. [39] and corrected by Tanner et al. [40] using X-ray diffraction (XRD). The C16 phase was first reported by Malakhova et al. [41] as a stable phase down to 0 K, Malhakhova et al. [42] and Aubertin et al. [43] have confirmed this result. The Fe-rich part of the phase diagram was investigated by Svechnikov et al.[44].
Borrelly et al.[45] determined the solubility in the different solid solutions. The phase diagram was reviewed in the whole composition range by Alekseeva et al. [46]. Later, Bhanumurthy et al. [47,48] and Kumar et al. [49] reported the C16 phase to be a high temperature stable phase. Servant et al. [3] reinvestigated the invariant reaction temperatures as well as the melting temperature of the C15 phase. A detailed review and a very careful reinvestigation of the whole composition range of this system has been carried out by Stein et al. [14] using metallography, XRD, EPMA and DTA measurements. These authors have shown that the presumed Fe23Zr6 compound stable at high temperature is actually an
oxygen stabilized compound. Indeed, in binary alloys, this compound always appears as third phase which is not complying with the Gibbs phase rule. Moreover, the precipitate size and the amount of the Fe23Zr6 phase remains unchanged by increasing the heat treatment duration.
At last, these authors have clearly shown that Fe23Zr6 precipitates specifically in regions with
high O content. Moreover, Stein et al. [14] have demonstrated that the hexagonal C36 polymorph of the Laves phase is a high-temperature stable phase. According to Stein et al. [14] this system exhibits eight condensed phases (Liquid, A1, A2, A3, C15, C16, C36 and E1a). Two intermetallic compounds are stable at low temperatures (C15 and E1a). This system is characterised by the presence of one congruent melting and three eutectic, three eutectoid, two peritectic and one peritectoid invariant reactions.
2.2.2 Thermodynamic data
Sudavtsova et al. [50], Sidorov et al.[51], Wang et al.[52] and Rösner-Kuhn et al. [53] have measured the mixing enthalpies in the liquid phase at different temperatures. Moreover, Rösner-Kuhn et al. [53] also measured the formation enthalpy of the C15 phase as well as Gachon et al.[54]. The heat capacity of C15 phase was provided by Lück et al.[55]. Servant et al. [3] measured the enthalpy of melting of the C15 phase.
Later, the DFT calculations performed by Barberis et al.[12] and Ohodnicki et al.[13] showed that the formation enthalpies of the C16 and Fe23Zr6 phases are not on the convex hull and
these authors concluded that these phases are not stable down to 0 K. More recently, Lumley et al. [56] calculated the Fe–Zr ground-state not including the Fe23Zr6 phase. Their results
confirmed that the C16 phase is not stable down to 0 K. Tao et al [8] have calculated the formation enthalpy of the C16 phase. These authors concluded on the stability of this phase only considering the negative value of the formation enthalpy. This conclusion is not appropriate as long as the complete the ground-state has not been calculated. In addition, a new first-principles study dealing with DFT calculations on the Fe–Zr system was provided by Ali et al. [9]. The authors have calculated the formation enthalpies and the electronic structure of the C15, C16, C36 and E1a phases. Unfortunately, their conclusions on the stability of the Fe23Zr6 compound are improper. Indeed, a negative value of formation
enthalpy is a necessary but not sufficient condition to conclude whether the compound is stable or not. Contrariwise, their calculations clearly exhibit that the formation enthalpy of the Fe23Zr6 compound is by 0.8 kJ/mol more positive than the calculated convex hull.
2.2.3 Thermodynamic assessment
Pelton [57] was the first author to model the Fe–Zr system mainly based on experimental determination of the phase diagram and measurement of the formation enthalpy of the C15 phase [54]. Servant et al. [3] reinvestigated the Calphad modelling of the Fe–Zr system according to their new measurements of the temperatures of invariant reactions as well as the fusion enthalpy of the C15 phase. Later, Jiang et al. [4], Guo et al. [6] and Rigaud et al. [5] performed new thermodynamic description of the system mainly based on new experimental measurement of Stein et al. [14]. Taking into account new DFT calculations available on the
Fe–Zr system [12,13], Yang et al. [7] carried out a new Calphad modelling of the system but did not find clear evidence to confirm about the phase stability of Fe23Zr6.
2.3 The Fe–Sn–Zr ternary system 2.3.1 Experimental data
The first studies of this system were carried out by Tanner et al. [58] and Korotkova [59] in the Zr-rich part of the phase diagram. These two authors have reported the existence of the θ phase, which structure has been solved by Kwon et al. [60], as being K2UF6. In addition,
Kwon et al. [60] have reported the existence of the Zr5Sn2.3Fe0.7 phase at 1350 ° C. The
reported structure is an ordered variant of W5Si3 obtained by splitting of the site 4a of the
space group I4/mcm into sites 2a and 2b of space group I422. Mazet et al. [61] have reported the existence of the Fe6Sn6Zr compound which crystallizes in the MgFe6Ge6 structure (also
called HfFe6Ge6). More recently, Nieva et al. [62] studied this system in a wider composition
range. In addition to the θ phase, these authors reported two other ternary phases, called X and N, without succeeding in solving their structures. An experimental study in the Zr-poor X part of the Fe–Sn–Zr system was performed by Savidan et al. [63] who reported a complete isothermal section at 900 °C. These authors have confirmed the existence of the Fe6Sn6Zr
ternary phase but also highlighted two new ternary phases, the Y and C36 phases. Moreover, they established that two different phases were involved within the homogeneity domain of the X phase, called X’ and X”. In addition, Savidan et al. [63] solved the N phase structure. At last, Nieva et al. [64] determined the isothermal section at 800 °C of this system.
Very recently, Calta et al. [18] solved the structure of the Hf9Fe4Sn10 compound and have
noted several similarities between the structures of the Fe–Sn–Zr and Fe–Sn–Hf ternary compounds.
No paper reports measured or calculated thermodynamic data for this system.
2.3.3 Thermodynamic assessment
There is no thermodynamic assessment available in the literature.
3. Methodology
3.1 Experimental details
The experimental procedure was identical to that employed in our previous work [17]. The samples have been synthesized from pieces of the pure elements (Fe from Neyco (99.99%), Sn from Alfa Aesar (99.8%) and Zr “Van Arkel” (55 ppm of oxygen) from LTMEX-CEA)) by arc melting under argon atmosphere. The alloys were melted five times and turned upside down between each melting to ensure homogeneity. The weight losses were less than 1 wt.%. The samples were wrapped in molybdenum foils and sealed in a silica tube under argon and then annealed in a resistance furnace. A part of the samples was examined by X-ray powder diffraction (XRD) at room temperature using a Bruker D8 diffractometer equipped with a graphite monochromator in the diffracted beam with Cu Kα radiation. The diffractogram was treated with a Rietveld analysis. Another part of the samples was polished and served for the Electron Microprobe Analysis (EPMA, Cameca SX100) using pure elements as standards
3.2 DFT calculations
The enthalpies of formation of the C15 (Fd3̅m), C16 (I4/mcm), C36 (P63/mmc), E1a (Cmcm)
phases and the stoichiometric Fe5Sn3 (P63/mmc), Fe3Sn2 (R3̅m), FeSn (P6/mmm),
FeSn2 (I4/mcm), Fe23Zr6 (Fm3̅m), FeSn2Zr6 (θ), Fe36.36Sn36.36Zr27.27 (N) et
Fe14.39Sn43.47Zr39.13 (X’’) compounds have been calculated using VASP code [65,66]. The
the configurations obtained by distributing the atoms in the C15 and C36 structures. The same code ZenGen [67], potentials [68] k-points meshing (16 x 16 x 16 for Fe23Zr6, 21 x 6 x 8 for
E1a ) and Blöchl corrections [69] was used. With respect to the magnetic state of Fe, the calculations are performed with spin polarization. The reference for enthalpies is the Stable Element Reference (SER, ground-state structure for Fe-bcc, −Sn for Sn and Zr-hcp).
SQS calculations [70] were also conducted in the same way as previously [17] with A1, A2 and A3 structures taken from the literature [71] and complemented by 1/16 and 15/16 dilutions
3.3 Calphad methodology
The Gibbs energy of each phase is written: 𝐺𝑚𝛼 = 𝑟𝑒𝑓𝐺
𝑚𝛼+ 𝑖𝑑𝐺𝑚𝛼 + 𝑒𝑥𝐺𝑚𝛼
where 𝑟𝑒𝑓𝐺𝑚𝛼 is the Gibbs energy surface of reference. Considering a phase α modelled with
two-SL in a A−B−C ternary system, 𝑟𝑒𝑓𝐺𝑚𝛼 can be formulated as: 𝑟𝑒𝑓𝐺 𝑚𝛼 = 𝑦𝐴 (1) 𝑦𝐴(2)𝐺𝐴:𝐴+ 𝑦𝐴(1)𝑦𝐵(2)𝐺𝐴:𝐵+ 𝑦𝐴(1)𝑦𝐶(2)𝐺𝐴:𝐶+ 𝑦𝐵(1)𝑦𝐴(2)𝐺𝐵:𝐴+ 𝑦𝐵(1)𝑦𝐵(2)𝐺𝐵:𝐵 + 𝑦𝐵(1)𝑦𝐶(2)𝐺𝐵:𝐶+ 𝑦𝐶 (1) 𝑦𝐴(2)𝐺𝐶:𝐴+ 𝑦𝐶 (1) 𝑦𝐵(2)𝐺𝐶:𝐵 + 𝑦𝐶 (1) 𝑦𝐶(2)𝐺𝐶:𝐶
With 𝐺𝑖:𝑗 = 𝐻𝑖:𝑗𝑆𝐸𝑅,𝛼− 𝑇 ∗ 𝑆𝑖:𝑗; 𝑦𝑗(𝑠) is the site occupancy of each constituent on each sublattice and 𝐻𝑖,𝑗𝑆𝐸𝑅,𝛼 is the 0 K formation enthalpy and 𝑆𝑖:𝑗 is the formation entropy of the ordered configuration.
𝑖𝑑𝐺
𝑚𝛼 is the molar Gibbs energy of an ideal mixing, based on the number of possible
arrangements of the constituents of the phase:
𝑖𝑑𝐺 𝑚𝛼 = 𝑅𝑇 ∑ 𝑎𝑠∑ 𝑦𝑖 (𝑠) 𝑖 ln(𝑦𝑖(𝑠)) 𝑠=2 𝑠=1
The last term of the Gibbs energy is the excess Gibbs energy that includes all the non-ideal mixing contributions: 𝐸𝐺 𝑚𝛼 = 𝑦𝐴 (1) 𝑦𝐵(1)𝑦𝐶(2)𝐿𝐴,𝐵:𝐶𝛼 + 𝑦𝐴(1)𝑦𝐵(2)𝑦𝐶(2)𝐿𝐴:𝐵,𝐶𝛼 + 𝑦𝐴(1)𝑦𝐵(2)𝑦𝐶(1)𝐿𝐴,𝐶:𝐵𝛼 + 𝑦𝐴(2)𝑦𝐵(1)𝑦𝐶(1)𝐿𝛼𝐵,𝐶:𝐴 + 𝑦𝐴(2)𝑦𝐵(1)𝑦𝐶(2)𝐿𝛼𝐵:𝐴,𝐶 + 𝑦𝐴(2)𝑦𝐵(2)𝑦𝐶(1)𝐿𝛼𝐶:𝐴,𝐵
where the excess parameters 𝐿𝛼𝑖,𝑗:𝑘 can be expressed as a Redlich-Kister polynomial.
Table 1 presents the different phases treated within the Compound Energy Formalism and the corresponding sublattice model chosen according to the crystal structures.
At last, just note that the DFT calculations we performed are used as input data in the Calphad modelling. Thus, similarly to any experimental data, we provide systematic comparison between our DFT calculations and our optimization (labelled “calc.” and “opt.”, respectively, in Figures 1, 2, 5, 6 and Tables 2 and 3).
4. Results and discussion
4.1 The Fe–Sn system
4.1.1 First-principles calculations
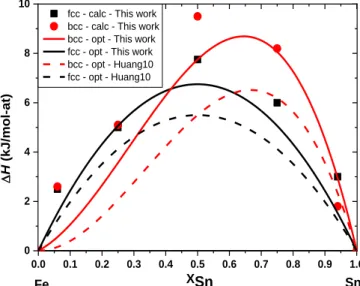
Fig. 1 shows the 0 K calculated formation enthalpies of the end-members of the C15 and C36 Laves phases and the stoichiometric Fe5Sn3, Fe3Sn2, FeSn and FeSn2 compounds compared
with data from literature. The calculated formation enthalpies of the stoichiometric Fe5Sn3,
Fe3Sn2, FeSn and FeSn2 compounds are also reported in the Table 2. The calculated mixing
enthalpies of the A1 and A2 solid solutions are reported in Fig. 2 and Table 3 and compared with our and former assessments.
4.1.2 Thermodynamic modelling 4.1.2.1 Selection of data
The liquidus measurements performed by Isaac et al. [23], Predel et al. [19] and Campbell et al. [25] were considered. The measurements of Arita et al. [24] were rejected because of the large deviations with the other sets of data.
The different measurements of the miscibility gap in the liquid phase exhibit relatively large discrepancies as reported in Figure 3. Hari Kumar et al. [15] have modelled a critical point of the miscibility gap at 1612 K but have noted that it could be at a higher temperature, which was confirmed by Okamoto [72] and Huang et al. [38]. Moreover, Okamoto [72] suggested that the miscibility gap is symmetrical. Thus, we have considered the measurements performed by Predel et al. [19] which exhibit a symmetrical miscibility gap in the liquid phase and a temperature of the critical point superior to the one modelled by Hari Kumar et al. [15]. Note that the miscibility gap modelled by Miettinen et al. [37] and Huang et al. [38] is in good agreement with the measurements of Predel et al. [19].
The Sn solubility in the bcc solid solution were taken from Mills et al. [20] and Arita et al. [24]. The solubility determined by Yamamoto et al. [33] were rejected due to the important disagreements with the other data.
The invariant reaction temperatures and compositions determined by Tréheux et al. [21] were considered.
The Gibbs free energy of the FeSn and FeSn2 compounds measured by Eremenko et al. [29]
and Zabdyr et al. [30] were rejected because of the strong disagreement with our own DFT calculations as reported in Figure 1. Our DFT calculations of the formation enthalpies of the intermetallic phases and the mixing enthalpies of the fcc and bcc solid solutions were considered.
At last, note that the Fe and Sn activity measured by Yamamoto et al. [33] and Nunoue et al. [27] were considered. The mixing enthalpy of the liquid phase measured by Yamamoto et al. [33] and Lueck et al. [35] was also considered.
4.1.2.2 Calphad assessment
We optimized the interaction parameters of the liquid phase according to the liquidus, the miscibility gap and the mixing enthalpy of the liquid phase. Binary second order parameters have been optimized without temperature dependence.
The formation enthalpies of the intermetallic compounds have been optimized after the measurements performed by Tréheux et al. [21] and our own calculations. The formation enthalpies of the end-members of the C15 and C36 Laves phases not existing in this system were kept fixed to DFT values. No entropic term was used for the Laves phases.
The bcc solid solution was modelled using regular and sub-regular binary interaction parameters with temperature dependence for the regular parameter. The fcc solid solution has been described with a regular interaction parameter without temperature dependence.
4.1.2.3 Discussion
Our thermodynamic assessment of the Fe–Sn system was performed using less parameters than Huang et al. [38]. Our description shows a comparable agreement with the experimental data similarly to Huang et al. [38] as reported in Figure 3. One may note that the ground state we have optimized is in very good agreement with our DFT calculations contrary to the description of Huang et al. [38] who considered the measurements performed by Eremenko et al. [29] and Zabdyr et al. [30], as reported in Figure 1. The optimized mixing enthalpy of the bcc solid solution shows a slightly better agreement with our calculations than the one assessed by Huang et al. [38], as reported in Figure 2.
At last, one may note the good agreement between the Fe and Sn activities measured by Yamamoto et al. [33] and Nunoue et al.[27]. The calculation we performed is reported in Figure 4 and optimized parameters are given in Table 4.
4.2 The Fe–Zr system
4.2.1 First-principles calculations
Fig. 5 shows the 0 K calculated formation enthalpies of the end-members of C15, C16, C36, E1a and Fe23Zr6 phases, compared to data from literature. The calculated formation enthalpies
of the end-members of C15 and C36 at the stoichiometry Fe2Zr are reported in Table 2. The
calculated mixing enthalpies of the in the solid solutions are reported in Fig. 6 and Table 3 and compared with our and former assessments.
The calculated ground-state of the Fe–Zr system allows us confirming the results of Barberis et al.[12] and Ohodnicki et al.[13] that the C16 and Fe23Zr6 compounds are not
stable down to 0 K since the calculated formation enthalpies of these two phases are above the calculated ground states line (mixing of C14 + E1a at the 1:2 and 23:6 compositions respectively).
4.2.2 Thermodynamic modelling 4.2.2.1 Selection of data
Compositions and temperature of the invariant reactions, the measurements of the single-phase and two-single-phase equilibria in addition to the liquidus were taken from the work of Stein et al. [14]. The data obtained by these authors are considered as the most accurate measurements available for this phase diagram. Thus, due to the very careful work of Stein et al. [14] confirmed by Barberis et al.[12], Ohodnicki et al.[13], Lumley et al.[56] and the DFT calculations we performed, the Fe23Zr6 phase was not included in the thermodynamic
modelling of the system. Moreover, the C36 phase was considered instead of the Fe23Zr6
compound as a high-temperature phase, according to the work of Stein et al. [14]. We have considered the formation enthalpy of the stable C15 phase measured by Rösner-Kuhn et al. [53] and Gachon et al.[54] and the ground-state calculated by Barberis et al.[12],
Ohodnicki et al.[13], Lumley et al.[56], Ali et al. [9] and that obtained in the present work. The mixing enthalpies of the liquid phase measured by Sudavtsova et al. [50], Sidorov et al.[51], Wang et al.[52] and Rösner-Kuhn et al. [53] were considered as well as the mixing enthalpies of the A1, A2 and A3 solid solutions obtained in this paper.
4.2.2.2 Calphad assessment
The formation enthalpy of the stable C15, C16, C36 and E1a end-members has been optimized after literature data [9,12,13,53,54] and our calculations. On the other hand, the formation enthalpy of the metastable end-members was kept fixed to the DFT values. Furthermore, no entropic term was used for the metastable end-members. The values of mixing enthalpies of the A1, A2 and A3 solid solutions were optimised after both the literature data [14,45] and our calculations.
The solubilities of the A1 and A3 terminal solid solutions were described using regular binary interaction parameters without temperature dependence. The solubilities of the A2 terminal solid solution were described using regular and sub-regular binary interaction parameters with temperature dependence for the regular parameter. The homogeneity range of the C15 Laves phase was described using a regular binary interaction parameter without temperature dependence. The liquid phase was described using regular and subregular interaction parameters without temperature dependence optimised considering the measurements available in the literature [50–53].
The optimized mixing enthalpy of the liquid phase is reported in Fig. 7 and compared with the measurements of Sudavtsova et al. [50], Sidorov et al.[51], Wang et al.[52] and Rösner-Kuhn et al. [53].
Fig. 8 shows the good description of the experimental data points obtained by our calculated diagram using our set of parameters. The optimized parameters are given in Table 5.
4.2.2.3 Discussion
Our thermodynamic description of the Fe–Zr system has been done using less parameters than the one of Guo et al. [6].
The optimized ground-state of the Fe–Zr system shown in Fig. 5 is in good agreement with the measurements [53,54] and calculations [9,12,13] available in the literature and with our own DFT calculations. Moreover, the optimised mixing enthalpies of the A1, A2 and A3 solid solutions exhibit a good agreement with our SQS calculations as reported in Fig. 6. At last, one may note the reasonable agreement existing between the optimised mixing enthalpy of the liquid phase and the measurements available in the literature [50–53] as reported in Fig. 7. Our description of the Fe–Zr phase diagram exhibits a better agreement with the experimental data points than the one of Guo et al. [6] particularly for the liquid phase in the whole composition range and for the bcc solid solution on the Zr-rich part.
4.3 The Fe–Sn–Zr system 4.3.1 Experimental study
Table 6 summarizes the chemical composition, annealing treatment and the structure and composition of the different phases of the Fe–Sn–Zr samples synthesized in the present work. Concerning the W5Si3 (I4/mcm) phase, the almost constant phase composition observed as
function of both the nominal composition and the temperature indicates the absence of any homogeneity range.
From the Rietveld analysis, the distribution of Sn and Fe of the W5Si3 (I4/mcm) phase at
1350 ° C is found to be similar to that proposed by Kwon et al. [60]. At 1000 °C, the distribution is more homogeneous between sites 2a and 2b and the structure is therefore very similar to that of W5Si3. Note that, at 1000 °C, this phase is involved in three phase equilibria
However, the structure of this third phase could not be solved. The structure of this phase is not a Laves phase, nor any other structure identified in the ternary Fe–Sn–Zr system. In addition, note that the proportion of this phase increases with the Fe content.
In a recent paper, Calta et al. [18] determined the structure of Hf9Fe4-xSn10+x. We discovered
that the structure of the X” phase that remained unknown after the work of Savidan et al. [63] was isotypic with this phase. Figure 9 presents the Rietveld refinement of the sample Fe19.2Sn43.2Zr37.6 (corresponding to the sample 8 in the work of Savidan et al. [63]). The
composition is indeed very close to that of the Hf phase. The presence of the additional ZrSn2 (13%) and N (22%) phases already shown in previous work was confirmed from the
Rietveld refinement. Given the complexity of the crystal structure, no attempt was made to refine atomic coordinates and/or site occupancies.
In the course of the refinement (and subsequent DFT calculation), we found an error in the Table 3 of Ref. [18]. After checking this point with the authors, we assumed that the z coordinate for Sn(5) is 0.0000 instead of 0.2695.
4.3.2 First-principles calculations
Table 7 summarizes the ternary intermetallic phases of the Fe–Sn–Zr system, their crystallographic description as well as the value of the calculated and optimized formation enthalpy for the FeSn2Zr6 (θ), Fe36.36Sn36.36Zr27.27 (N) and Fe14.39Sn43.47Zr39.13 (X'') compounds.
The formation enthalpy of the Fe17.65Sn39.22Zr43.13 (X') and Fe36.36Sn36.36Zr27.2 (Y) compounds
is not calculated in this paper because their crystal structure is not known. In Fig. 10, we have reported the calculation of the formation enthalpies of the end-members of the Mn5Si3 and
W5Si3 structures.
At first, note that the phase equilibria determined by Nieva et al. [62,64] and Savidan et al. [63] were considered. The formation enthalpies of the ternary intermetallic phases were fixed at the values computed by DFT, the entropic terms of the FeSn2Zr6 (θ),
Zr5Sn2.3Fe0.7 and Fe36.36Sn36.36Zr27.2 (Y) phases were optimized. The homogeneity range of the
Laves phases were optimized using two ternary interaction parameters for the C36 phase and one for the C15 phase.
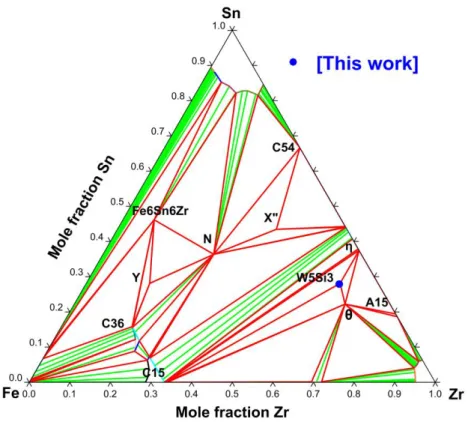
The result of our modelling is the best compromise between all measured phase equilibria. We have reported the calculated isothermal section together with experimental data of the ternary system at 800 °C, 900 °C, 1000 °C and 1350 °C in figures 11 to 14. The optimized parameters are given in Table 8.
4.3.3.4 Discussion
The competition between the Mn5Si3 and W5Si3 structures reported in figure 10 shows that the
W5Si3 structure is more stable than the Mn5Si3 structure only slightly and only in a small
range of composition in quite good agreement with the measurements of Kwon et al. [60] and those obtained in the frame of this work. This, together with the absence of an homogeneity range, justifies that the phase is treated as a stoichiometric one.
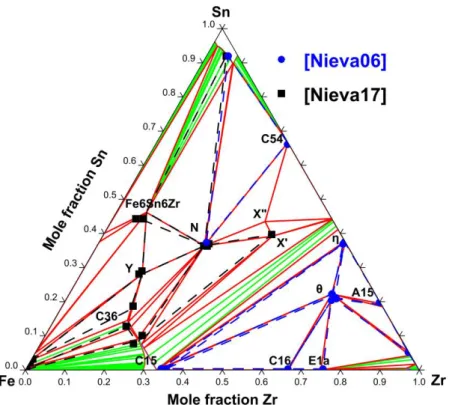
Our thermodynamic modelling of the Fe–Sn–Zr system is in good agreement with the measurements performed by Nieva et al. [62,64], Savidan et al. [63] and our own measurements as shown in Figure 11 to 14. Some of the slight differences observed between the isothermal sections at 800 °C and 900 °C [62] like the shift in the tie-triangle [Fe(𝛼) – Y – C36] toward Sn-richer composition as well as the shift in the tie-triangle [Fe(𝛼) – C15 – C36] toward Sn-poorer composition were reproduced in our modelling. The calculated isothermal sections at 1000 °C and 1350 °C show that the W5Si3 structure is stable in good agreement
good agreement with the experimental isothermal section provided by Nieva et al. [62,64]. The solubility of Fe in the η-phase of the Sn–Zr system and the ternary extension of the θ phase were not taken into account in the modelling.
In the absence of other isothermal sections, liquidus projection and temperatures for the ternary invariant reactions, the description should be considered as only tentative.
5. Conclusions
The experimental study we have performed on the Fe–Sn–Zr ternary system has confirmed that the W5Si3 phase (stoichiometry Zr5Sn2.3Fe0.7) is stable at 1350 °C but also down to
1000 °C. Moreover, the crystal structure of the X” phase has been determined using XRD and Rietveld refinement.
The Fe–Sn–Zr system has been then studied by first-principles calculations. We carried out new DFT calculations of the formation enthalpies of the C15, C16, C36, E1a phases and the stoichiometric Fe5Sn3, Fe3Sn2, FeSn,FeSn2, Fe23Zr6, FeSn2Zr6 (θ), Fe36.36Sn36.36Zr27.27 (N) et
Fe14.39Sn43.47Zr39.13 (X’’). Our results clearly show that the Fe23Zr6 phase is not
thermodynamically stable down to 0 K. Moreover, the competition between the two different structures W5Si3 and Mn5Si3 has been investigated. We have shown that the W5Si3 is only
stable in a narrow range of composition close to the stoichiometry Zr5Sn2Fe1.
At last, the thermodynamic modelling of the Fe–Sn and Fe–Zr binary system as well as the Fe–Sn–Zr ternary systems has been performed using the Calphad approach according to our new experimental results and DFT calculations. One may note that the ground-state of the modelled Fe–Sn binary system has been strongly shifted from the former assessments available in the literature [15].
Acknowledgements
Eric Bouaravong and Didier Hamon contributed to the alloy synthesis and the EPMA measurements. The authors aknowledge HPC resources from GENCI-CINES (Grant 2018-096175 and den0006) used for the DFT calculations, the GDR CNRS n°3584 TherMatHT for fruitful discussions and collaborative work on the present project andthe French Tripartite Institute CEA/EDF/Framatome [Projet Gaine] for funding.
References
[1] C. Guéneau, V. Dauvois, P. Pérodeaud, C. Gonella, O. Dugne, Liquid immiscibility in a (O,U,Zr) model corium, J. Nucl. Mater. 254 (1998) 158–174.
[2] L. Rodrigo, J.A. Sawicki, Aging characteristics of Zr-V-Fe getters as observed by Mossbauer spectroscopy, J. Nucl. Mater. 265 (1999) 208–212.
[3] C. Servant, C. Gueneau, I. Ansara, Experimental and thermodynamic assessment of the FeZr system, J. Alloys Compd. 220 (1995) 19–26.
[4] M. Jiang, K. Oikawa, T. Ikeshoji, L. Wulff, K. Ishida, Thermodynamic calculations of Fe-Zr and Fe-Zr-C systems, J. Phase Equilibria. 22 (2001) 406–417.
[5] V. Rigaud, B. Sundman, D. Daloz, G. Lesoult, Thermodynamic assessment of the Fe– Al–Zr phase diagram, Calphad. 33 (2009) 442–449.
[6] C. Guo, Z. Du, C. Li, B. Zhang, M. Tao, Thermodynamic description of the Al–Fe–Zr system, Calphad. 32 (2008) 637–649.
[7] Y. Yang, L. Tan, H. Bei, J.T. Busby, Thermodynamic modeling and experimental study of the Fe–Cr–Zr system, J. Nucl. Mater. 441 (2013) 190–202.
[8] X. Tao, J. Zhu, H. Guo, Y. Ouyang, Y. Du, Phase stability, thermodynamic and
mechanical properties of AlZr2, FeZr2 and Al2FeZr6 from first-principles calculations, J.
Nucl. Mater. 440 (2013) 6–10.
[9] K. Ali, A. Arya, P.S. Ghosh, G.K. Dey, A first principles study of cohesive, elastic and electronic properties of binary Fe-Zr intermetallics, Comput. Mater. Sci. 112 (2016) 52– 66.
[10] W.L. Huang, Y. Yu, S.Y. Yang, C.P. Wang, X.J. Liu, R. Kainuma, K. Ishida,
Experimental Investigation of Phase Equilibria in the Cu-Fe-Zr Ternary System, J. Phase Equilibria Diffus. 34 (2013) 438–446.
[11] S.Y. Yang, J.B. Zhang, C.P. Wang, W.J. Yu, Z. Shi, X.J. Liu, Experimental
investigation of phase equilibria in the Ni-Fe-Zr ternary system, J. Mater. Res. 31 (2016) 2407–2414.
[12] P. Barberis, N. Dupin, C. Lemaignan, A. Pasturel, J.M. Grange, Microstructure and phase control in Zr-Fe-Cr-Ni alloys: Thermodynamic and kinetic aspects, in: P. Rudling, B. Kammenzind (Eds.), Zircon. Nucl. Ind. 14th Int. Symp., American Society Testing and Materials, W Conshohocken, 2005: pp. 129–156.
[13] P.R. Ohodnicki, N.C. Cates, D.E. Laughlin, M.E. McHenry, M. Widom, Ab initio theoretical study of magnetization and phase stability of the (Fe,Co,Ni)23B6 and
(Fe,Co,Ni)23Zr6 structures of Cr23C6 and Mn23Th6 prototypes, Phys. Rev. B. 78 (2008)
[14] F. Stein, G. Sauthoff, M. Palm, Experimental determination of intermetallic phases, phase equilibria, and invariant reaction temperatures in the Fe-Zr system, J. Phase Equilibria. 23 (2002) 480–494.
[15] K.C.H. Kumar, P. Wollants, L. Delaey, Thermodynamic evaluation of Fe-Sn phase diagram, Calphad. 20 (1996) 139–149.
[16] R.J. Perez, C. Toffolon-Masclet, J.-M. Joubert, B. Sundman, The Zr-Sn binary system: New experimental results and thermodynamic assessment, Calphad-Comput. Coupling Phase Diagr. Thermochem. 32 (2008) 593–601.
[17] P. Lafaye, C. Toffolon-Masclet, J.-C. Crivello, J.-M. Joubert, Experimental
investigations and thermodynamic modelling of the Cr–Nb–Sn–Zr system, Calphad-Comput. Coupling Phase Diagr. Thermochem. 64 (2019) 43-54.
[18] N.P. Calta, M.G. Kanatzidis, Hf3Fe4Sn4 and Hf9Fe(4-x)Sn(10+x): Two stannide
intermetallics with low-dimensional iron sublattices, J. Solid State Chem. 236 (2016) 130–137.
[19] B. Predel, M. Frebel, Precipitation behavior of α-solid solutions of the Fe-Sn system, Metall. Trans. 4 (1973) 243–249.
[20] K.C. Mills, E.T. Turkdogan, Liquid miscibility gap in iron–tin system, Trans Met. Sot AIME. 230 (1964) 1202-1203.
[21] D. Treheux, D. Duc, P. Guiraldenq, Determination of the Limits of Solubility of Tin in Alpha and Gamma Irons, Mem Sci Rev Met. 71 (1974) 289–293.
[22] A.N. Fedorenko, V.G. Brovkin, Vapor pressure of tin and thermodynamic properties of the tin–iron system, Sb Nauchn Tr Gos Proektn Nauchno-Issled Inst Gipronikel. 3 (1977) 83-89.
[23] E. Isaac, G. Tammann, On the alloys of iron with tin and gold, Z Anorg Chem. 53 (1907) 281–297.
[24] M. Arita, M. Ohyama, K.S. Goto, M. Someno, Measurements of activity, solubility and diffusivity in alpha and gamma Fe-Sn alloys between 1183 and 1680 K, Z. Fuer Met. Res. Adv. Tech. 72 (1981) 244–250.
[25] A.N. Campbell, J.H. Wood, G.B. Skinner, The System Iron-Tin: Liquidus Only, J. Am. Chem. Soc. 71 (1949) 1729–1733.
[26] S.V. Shiraishi, H.B. Bell, Thermodynamic study of tin smelting. 1. Iron–tin and iron– tin–oxygen alloys, Inst Min. Met Trans Sect C. 77 (1968) 104–105.
[27] S. Nunoue, E. Kato, Mass Spectrometric Determination of the Miscibility Gap in the Liquid Fe-Sn System and the Activities of This System at 1 550°C and 1 600°C, Tetsu-Hagane. 73 (1987) 868–875.
[28] T. Yamamoto, T. Takashima, K. Ishida, Inter-diffusion in the alpha-solid solution of the Fe–Sn system, J. Jpn. Inst. Met. 45 (1981) 985-990.
[29] V.N. Eremenko, Conditions for the formation of stannides by the interaction of iron with Sn-Pb melts, and their thermodynamic properties, Izv. Akad. Nauk SSSR Met. 4 (1976) 58–62.
[30] L. Zabdyr, K. Fitzner, Gibbs free energy of formation of iron antimonide (FeSb2), iron– tin (FeSn), and iron–tin (FeSn2) intermetallic phases, Arch Hutn. 29 (1984) 227–233.
[31] A. Yazawa, K. Koike, Tin smelting. II. Activity measurements in molten tin–iron alloy, Nippon Kogyo Kaishi. 85, 969, (1969) 39-42.
[32] S. Wagner, G.R. St.Pierre, Thermodynamics of the liquid binary iron-tin by mass spectrometry, Metall. Trans. 3 (1972) 2873–2878.
[33] M. Yamamoto, S. Mori, E. Kato, Mass spectrometric study of the thermodynamic properties of liquid Fe-Sn, Fe-Sn-Cu alloys, Tetsu-Hagane Journal Iron Steel Inst. Jpn. 67 (1981) 1952–1961.
[34] M.S. Petrushevskii, Y.O. Esin, V.M. Baev, P.V. Gel’d, Influence of short-range ordering on the concentration-dependence of the enthalpies of formation of liquid iron-tin alloys, Rus. Met. 1 (1978) 61-63.
[35] R. Lueck, B. Predel, Enthalpy of mixing of liquid Iron-Tin alloys determined by means of a new high-temperature calorimeter, Z. Fuer Met. Res. Adv. Tech. 76 (1985) 684– 686.
[36] H.D. Nüssler, O. von Goldbeck, P.J. Spencer, A thermodynamic assessment of the iron-tin system, Calphad. 3 (1979) 19–26.
[37] J. Miettinen, Thermodynamic description of the Cu–Fe–Sn system at the Cu–Fe side, Calphad. 32 (2008) 500–505.
[38] Y.-C. Huang, W. Gierlotka, S.-W. Chen, Sn–Bi–Fe thermodynamic modeling and Sn– Bi/Fe interfacial reactions, Intermetallics. 18 (2010) 984–991.
[39] E. Hayes, A. Roberson, W. Obrien, Constitution and Mechanical Properties of Zirconium-Iron Alloys, Trans. Am. Soc. Met. 43 (1951) 888–905.
[40] L. Tanner, D. Levinson, Observations on the System Zirconium Iron, Trans. Am. Inst. Min. Metall. Eng. 215 (1959) 1066–1067.
[41] T. Malakhova, Z. Alekseyeva, The Zr-Fe Phase-Diagram in the Range 20 - 40 at-Percent Fe and the Crystalline-Structure of the Intermetallic Compound Zr3Fe, J. -Common Met.
81 (1981) 293–300.
[42] T. Malakhova, A. Kobylkin, The Zr-Fe Phase-Diagram (0-66.6 at.% Fe), Russ. Metall. (1982) 187–191.
[43] F. Aubertin, U. Gonser, S. Campbell, H. Wagner, An Appraisal of the Phases of the Zirconium-Iron System, Z. Met. 76 (1985) 237–244.
[44] V.N. Svechnikov, A.T. Spektor, The Iron-Zirconium Phase Diagram, Proc Acad Sci USSR Chem Sect. 142 (1962) 231–233.
[45] R. Borrelly, P. Merle, Study by Electron-Diffraction of Precipitation in Low Iron Content Zr-Fe Alloys, J. Nucl. Mater. 173 (1990) 105–107.
[46] Z. Alekseeva, N. Korotkova, The Zr-Fe Phase-Diagram, Russ. Metall. (1989) 197–203. [47] K. Bhanumurthy, G. Kale, S. Khera, Reaction Diffusion in the Zirconium Iron System, J.
Nucl. Mater. 185 (1991) 208–213.
[48] K. Bhanumurthy, G. Kale, Modification of Zirconium-Iron Phase-Diagram, Scr. Metall. Mater. 28 (1993) 753–756.
[49] L. Kumar, R.V. Ramanujan, R. Tewari, P. Mukhopadhyay, S. Banerjee, Active eutectoid decomposition in Zr-3 wt.% Fe, Scr. Mater. 40 (1999) 723–728.
[50] V.S. Sudavtsova, V.P. Kurach, G.I. Batalin, Thermochemical properties of liquid binary alloys Fe-(Y, Zr, Nb, Mo), Izv. Akad. Nauk SSSR Met. (1987) 60–61.
[51] O.Y. Sidorov, M.G. Valishev, Y.O. Esin, P.V. Gel’d, Formation heat of iron-zirconium melts, Izv Akad Nauk SSSR Met. 6 (1988) 23–25.
[52] H. Wang, R. Luck, B. Predel, Calorimetric Determination of the Enthalpy of Mixing of Liquid Iron-Zirconium Alloys, Z. Met. 81 (1990) 843–846.
[53] M. Rösner-Kuhn, J. Qin, K. Schaefers, U. Thiedemann, M.G. Frohberg, Temperature dependence of the mixing enthalpy and excess heat capacity in the liquid system iron-zirconium, Z. Für Met. 86 (1995) 682–685.
[54] J. Gachon, J. Hertz, Enthalpies of Formation of Binary Phases in the Systems Feti, Fezr, Coti, Cozr, Niti, and Nizr, by Direct Reaction Calorimetry, Calphad-Comput. Coupling Phase Diagr. Thermochem. 7 (1983) 1–12.
[55] R. Luck, H. Wang, Heat-Capacity of the Fe2zr Intermetallic Compound, J. Alloys Compd. 191 (1993) 11–12.
[56] S.C. Lumley, S.T. Murphy, P.A. Burr, R.W. Grimes, P.R. Chard-Tuckey, M.R. Wenman, The stability of alloying additions in Zirconium, J. Nucl. Mater. 437 (2013) 122–129.
[57] A. Pelton, L. Leibowitz, R. Blomquist, Thermodynamic Analysis of Phase-Equilibria in the Iron Zirconium System, J. Nucl. Mater. 201 (1993) 218–224.
[58] L. Tanner, D.W. Levinson, The system zirconium–iron–tin, Trans ASM. 52 (1960) 1115–1136.
[59] N.V. Korotkova, The zirconium corner of the phase diagram Zr–Sn–Fe, Russ Met. 5 (1990) 201–208.
[60] Y. Kwon, S. Sevov, J.D. Corbett, Substituted W5Si3- and Zr6Al2Co-type phases formed
in the zirconium-antimony and zirconium–tin systems with iron group metals, Chem. Mater. 2 (1990) 550–556.
[61] T. Mazet, B. Malaman, Local chemical and magnetic disorder within the HfFe6Ge6-type
RFe6Sn6 compounds (R = Sc, Tm, Lu and Zr), J. Magn. Magn. Mater. 219 (2000) 33–40.
[62] N. Nieva, D. Arias, Experimental partial phase diagram of the Zr–Sn–Fe system, J. Nucl. Mater. 359 (2006) 29–40.
[63] J.-C. Savidan, J.-M. Joubert, C. Toffolon-Masclet, An experimental study of the Fe–Sn– Zr ternary system at 900 °C, Intermetallics. 18 (2010) 2224–2228.
[64] N. Nieva, C. Corvalán, M.J. Jiménez, A. Gómez, C. Arreguez, J.-M. Joubert, D. Arias, Phase diagram of the Fe-Sn-Zr system at 800 °C, J. Nucl. Mater. 487 (2017) 186–191. [65] G. Kresse, J. Furthmüller, Efficient iterative schemes for ab initio total-energy
calculations using a plane-wave basis set, Phys. Rev. B. 54 (1996) 11169–11186. [66] G. Kresse, D. Joubert, From ultrasoft pseudopotentials to the projector augmented-wave
method, Phys. Rev. B. 59 (1999) 1758–1775.
[67] J.-C. Crivello, R. Souques, A. Breidi, N. Bourgeois, J.-M. Joubert, ZenGen, a tool to generate ordered configurations for systematic first-principles calculations: The Cr–Mo– Ni–Re system as a case study, Calphad. 51 (2015) 233–240.
[68] J.P. Perdew, K. Burke, M. Ernzerhof, Generalized Gradient Approximation Made Simple, Phys. Rev. Lett. 77 (1996) 3865–3868.
[69] P. Blöchl, Projector augmented-wave method, Phys. Rev. B. 50 (1994) 17953-17979. [70] A. Zunger, S.-H. Wei, L.G. Ferreira, J.E. Bernard, Special quasirandom structures, Phys.
Rev. Lett. 65 (1990) 353–356.
[71] C. Jiang, C. Wolverton, J. Sofo, L.-Q. Chen, Z.-K. Liu, First-principles study of binary bcc alloys using special quasirandom structures, Phys. Rev. B. 69 (2004) 214202-10. [72] H. Okamoto, Binary alloy phase diagrams, in: 2nd ed. Ohio: ASM International, 1990: p.
1774.
[73] S.V. Shiraishi, H.B. Bell, Thermodynamic study of tin smelting. 1. Iron–tin and iron– tin–oxygen alloys, Inst Min. Met Trans Sect C. 77 (1968) 104–105.
[74] X. Tao, J. Zhu, H. Guo, Y. Ouyang, Y. Du, Phase stability, thermodynamic and
mechanical properties of AlZr2, FeZr2 and Al2FeZr6 from first-principles calculations, J.
Nucl. Mater. 440 (2013) 6–10.
Figure caption:
Figure 1: Calculated formation enthalpies of the intermetallic phases of the Fe–Sn system compared to data of Eremenko et al. [29] and Zabdyr et al. [30]
Figure 2: Calculated mixing enthalpies of the A1 and A2 solid solutions in the Fe–Sn system compared to data of Huang et al. [38].
0.0 0.1 0.2 0.3 0.4 0.5 0.6 0.7 0.8 0.9 1.0 0 2 4 6 8 10 D H (k J/mo l-a t) Sn Fe XSn
fcc - calc - This work bcc - calc - This work bcc - opt - This work fcc - opt - This work bcc - opt - Huang10 fcc - opt - Huang10 0.0 0.1 0.2 0.3 0.4 0.5 0.6 0.7 0.8 0.9 1.0 -35 -30 -25 -20 -15 -10 -5 0 20 40 60 80 100
Calc. Ground-state This work Opt. Ground-state This work C14 - This work C15 - This work C36 - This work Fe5Sn3 - This work Fe3Sn2 - This work FeSn - This work FeSn2 - This work Fe5Sn3, Fe3Sn2 - Eremenko76 Fe5Sn3, Fe3Sn2 - Zabdyr84
D H (k J/mo l-a t) Fe XSn Sn
Figure 3: Calculated Fe-Sn system compared to data of Tréheux et al. [21], Arita et al. [24], Mills et al. [20], Shiraishi et al. [73], Predel et al. [19], Campbell et al. [25], Isaac et al. [23] et Fedorenko et al. [22] and assessment of Huang et al. [38].
Figure 4: Calculated activities of Fe and Sn at 1600 °C compared to data of Nunoue et al. [27] and Yamamoto et al. [33]
0.0 0.1 0.2 0.3 0.4 0.5 0.6 0.7 0.8 0.9 1.0 500 750 1000 1250 1500 1750 2000 Thiswork Huang10 Treheux74 Mills64 Arita81 Fedorenko77 Predel73 Campbell49 Isaac07 Shiraishi68
Sn Fe T (°C ) X
Sn
Liquid Fe5Sn3 Fe3Sn2 Fe Sn FeSn 2 Liquid#1 + Liquid#2 bc c 0.0 0.1 0.2 0.3 0.4 0.5 0.6 0.7 0.8 0.9 1.0 0.0 0.1 0.2 0.3 0.4 0.5 0.6 0.7 0.8 0.9 1.0opt. - This work Nunoue87 Yamamoto83
Activity
Figure 5: Calculated formation enthalpies of the intermetallic phases of the Fe–Zr system compared to data of Gachon et al. [54], Barberis et al. [12], Ohodnicki et al. [13], Tao et al. [74], Lumley et al. [56] et Ali et al. [9].
Figure 6: Calculated mixing enthalpies of the A1, A2 and A3 solid solutions in the Fe–Zr system compared to data of Guo et al. [7].
0.0 0.1 0.2 0.3 0.4 0.5 0.6 0.7 0.8 0.9 1.0 -10 -5 0 5 10 15 20 25 D H (k J/mo l-a t) Zr Fe XZr
fcc - calc - This work bcc - calc - This work hcp - calc - This work fcc - opt - This work bcc - opt - This work hcp - opt - This work fcc - opt - Guo08 bcc - opt - Guo08 hcp - opt - Guo08 0.0 0.1 0.2 0.3 0.4 0.5 0.6 0.7 0.8 0.9 1.0 -35 -30 -25 -20 -15 -10 -5 0 20 40 60 80
100 Calc. Ground-state This work Opt. Ground-state This work C14 - This work C15 - This work C36 - This work C16 - This work E1a - This work Fe23Zr6 - This work
C15, C16, E1a - Lumley13 C15 - Gachon88 C15, C16, E1a - Ohodnicki08 C15, C16, E1a - Barberis05 C15, C16, E1a - Ali16 C15 - Tao13
D H (k J/mo l-a t) Fe XZr Zr
Figure 7: Calculated mixing enthalpies of the liquid phase at 1690 °C in the Fe–Zr system compared to data of Sudatsova et al. [50], Sidorov et al.[51], Wang et al.[52] and Rösner-Kuhn et al. [53].
Figure 8: Calculated Fe–Zr system compared to data of Tanner et al. [40], Svechnikov et al. [44], Abrahamson et al. [75], Borrelly et al. [45], Servant et al. [3] et Stein et al. [14] and assessment of Guo et al. [6].
0.0 0.1 0.2 0.3 0.4 0.5 0.6 0.7 0.8 0.9 1.0 -24 -22 -20 -18 -16 -14 -12 -10 -8 -6 -4 -2 0
opt - 1690 °C - This work 1650 °C - Wang90 1690 °C - Sidorov88 1907 °C - Rosner-Kuhn95 1627 °C - Sudavtsova87 D H (k J/mo l-a t) Fe X
Zr
Zr 0.0 0.1 0.2 0.3 0.4 0.5 0.6 0.7 0.8 0.9 1.0 600 800 1000 1200 1400 1600 1800 2000 Thiswork Guo08Tanner59 Svechnikov62 Abrahamson66 Borrelly90 Servant95 Stein02
Zr Fe T (°C )
X
Zr
Liquid E 1 a -Fe Zr 3 C 15-F e2 Zr bcc C16-FeZr2 C3620 40 60 80 100 0 2000 4000 Int en sity (co un ts) 2 (°)
Figure 9: Rietveld refinement of Fe19.2Sn43.2Zr37.6 (sample 8 in Ref. [63], χ2=2.9, RB(X'')=6%).
Experimental (points), calculated (line) and difference (line below) patterns are shown. The markers show the positions of the different reflections of X'' (Hf9Fe4-xSn10+x type) (top), ZrSn2
(TiSi2 type) (middle) and N (Sc3Mn2Ga6 type) (bottom).
0.0 0.5 1.0 1.5 2.0 2.5 3.0 -60 -50 -40 -30 -20 -10 0 Zr5Fe3 D H (k J/mol -at ) x Mn5Si3 [Thiswork] W5Si3 [Thiswork] Zr5Sn3-XFeX Zr5Sn3
W5Si3 : 0.13kJ more stable
Figure 11: Calculated isothermal section at 800 °C of the Fe–Sn–Zr system compared to experimental data of Nieva et al. [62, 64].
Figure 12: Calculated isothermal section at 900 °C of the Fe–Sn–Zr system compared to experimental data of Savidan et al. [63] and Nieva et al. [62].
Figure 13: Calculated isothermal section at 1000 °C of the Fe–Sn–Zr system
Table caption:
Table 1: Crystallographic description and sublattice model of the non-stoichiometric phases of the Fe–Sn–Zr and Fe–Zr system
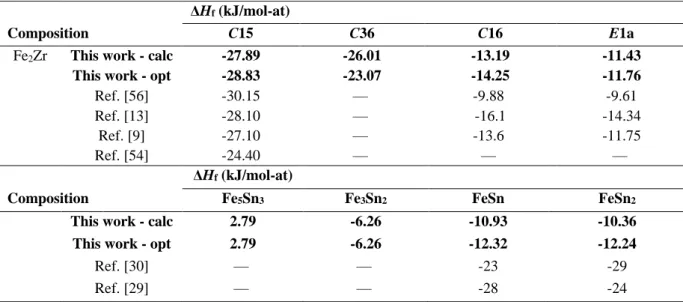
Table 2: Calculated and optimized formation enthalpies of the intermetallic phases of the Fe– Zr and Fe–Sn systems from the present work compared with the values available in the literature
Phase Space group Wyckoff position Crystallographic site Sublattice modelling
C15 Fd-3m (227) 8a; 16d 2 (Fe,Sn,Zr)2 (Fe,Sn,Zr)1
C16 I4/mcm (140) 4a; 8h 2 (Fe,Zr)1 (Fe,Zr)2
C36 P63/mmc (194) 4e; 4f; 4f; 8i; !8i 3 (Fe,Sn,Zr)4 (Fe,Sn,Zr)4
(Fe,Sn,Zr)16
E1a Cmcm (63) 4c; 4c ; 8f 3 (Fe,Zr) (Fe,Zr)3
ΔHf (kJ/mol-at)
Composition C15 C36 C16 E1a
Fe2Zr This work - calc -27.89 -26.01 -13.19 -11.43
This work - opt -28.83 -23.07 -14.25 -11.76
Ref. [56] -30.15 — -9.88 -9.61
Ref. [13] -28.10 — -16.1 -14.34
Ref. [9] -27.10 — -13.6 -11.75
Ref. [54] -24.40 — — —
ΔHf (kJ/mol-at)
Composition Fe5Sn3 Fe3Sn2 FeSn FeSn2
This work - calc 2.79 -6.26 -10.93 -10.36
This work - opt 2.79 -6.26 -12.32 -12.24
Ref. [30] — — -23 -29
Table 3: Calculated mixing enthalpies of the binary solid solutions from the present work.
Table 4: Optimized thermodynamic parameters for the Fe–Sn system from the present work
ΔHmix (kJ/mol-at)
Composition (at. %Zr) 0.06 0.25 0.50 0.75 0.94
This work - fcc 5.02 11.88 14.02 8.11 1.91
Fe-Zr This work - bcc 7.71 15.07 12.81 4.50 2.34
This work - hcp 5.05 11.26 9.76 4.21 1.52
Fe-Sn This work - fcc 2.51 5.06 7.75 5.94 3.08
This work - bcc 2.60 5.12 9.47 8.19 1.81
Phase Parameters (J/mol)
Liquide 0L Fe,Sn = 21340 1L Fe,Sn = – 6345 2L Fe,Sn = – 5518 fcc 0L Fe,Sn = 23510 bcc 0L Fe,Sn = 30011+5.31*T 1L Fe,Sn = – 24443 Fe5Sn3 G Fe:Sn = – 65017+23.66*T+5*GHSERFE+3*GHSERSN Fe3Sn2 G Fe:Sn = – 60284+32.45*T+3*GHSERFE+2*GHSERSN
FeSn G Fe:Sn = – 34941+22.60*T+GHSERFE+GHSERSN
Table 5: Optimized thermodynamic parameters for the Fe–Zr system from the present work
Table 6: Composition and annealing treatments of the Fe–Sn–Zr samples prepared in this work
Phase Parameters (J/mol)
Liquid 0L Fe,Zr = – 70236 1L Fe,Zr = – 3000 fcc 0L Fe,Zr = 60000 bcc 0L Fe,Zr = 40000-14.02*T 1L Fe,Zr = 50000 hcp 0L Fe,Zr = 25045 2L Fe,Sn,Zr = -700000 C15 (Fe, Zr) 1 (Fe, Zr)2 GFe:Fe = +35876 +3*GHSERFE GFe:Zr = +227815+2*GHSERZR+GHSERFE GZr:Fe = – 105104+12.44*T+GHSERZR+2*GHSERFE GZr:Zr = +88549+3*GHSERZR 0L Fe,Zr:Fe = 0LZr:Fe,Zr = – 22000 C36
(Fe, Zr)4 (Fe, Zr)4(Fe, Zr)16
GFe:Fe:Fe = 290739+24*GHSERFE GZr:Fe:Fe = – 279300+20*GHSERFE+4*GHSERZR GFe:Zr:Fe = – 253849+20*GHSERFE+4*GHSERZR GZr:Zr:Fe = – 700972+107.2*T+16*GHSERFE+8*GHSERZR GFe:Fe:Zr = 1791026+8*GHSERFE+16*GHSERZR GZr:Fe:Zr = 1419297+4*GHSERFE+20*GHSERZR GFe:Zr:Zr = 1375455+4*GHSERFE+20*GHSERZR GZr:Zr:Zr = 618997+24*GHSERZR 0L Zr:Fe,Zr:Fe = – 350000 C16 (Fe, Zr) 1 (Fe, Zr)2 GFe:Fe = +106333+3*GHSERFE GZr:Fe = +31049+GHSERZR+2*GHSERFE GFe:Zr = – 52050+7.92*T+GHSERFE+2*GHSERZR GZr:Zr = 94770+3*GHSERZR 0L Fe:Fe,Zr = – 218320 0L Fe,Zr:Zr = – 99416 E1a (Fe, Zr)1 (Fe, Zr)3 GFe:Fe = +160799+4*GHSERFE GZr:Fe = 198436+GHSERZR+3*GHSERFE GFe:Zr = – 56350+7.37*T+GHSERFE+3*GHSERZR GZr:Zr = +60769+4*GHSERZR Nominal
composition Heat treatment Structure (Space group)
Lattice parameters (Rietveld) Composition (EPMA) Fe0.7Sn2.3Zr5 8h at 1350 °C W5Si3 (I4/mcm) a=11.170 Å; c=5.490 Å Zr60.7Sn30.1Fe9.2 Fe0.7Sn2.3Zr5 7 days at 1000 °C W5Si3 (I4/mcm) Mn5Si3 (P63/mcm) ? a=11.166 Å; c=5.481 Å a=8.473 Å; c=5.780 Å ? Zr61.4Sn29.3Fe9.3 Zr60.1Sn38.7Fe1.2 Zr33.4Sn0.2Fe66.4 Fe0.85Sn2.15Zr5 7 days at 1000 °C W5Si3 (I4/mcm) Mn5Si3 (P63/mcm) ? a=11.163 Å; c=5.480 Å a=8.473 Å; c=5.780 Å ? Zr62.4Sn28.3Fe9.3 Zr61.9Sn37.7Fe0.4 Zr33.8Sn0.2Fe66.0 Fe1Sn2Zr5 7 days at 1000 °C W5Si3 (I4/mcm) Mn5Si3 (P63/mcm) ? a=11.168 Å; c=5.482 Å a=8.481 Å ; c=5.781 Å ? Zr60.6Sn30.6Fe8.8 Zr60.3Sn39.2Fe0.5 Zr32.9Sn0.2Fe66.9
Table 7: Calculated and optimized formation enthalpies of the Fe–Sn–Zr ternary phases
Table 8: Optimized thermodynamic parameters for the Fe–Sn–Zr system from the present work
Phase Space group ΔHf (kJ/mol) - calc ΔHf (kJ/mol) - opt
Fe36.36Sn36.36Zr27.27 (N) Pnma -27.623 -28.970 FeSn2Zr6 (θ) P-62m -39.437 -40.881 Fe6Sn6Zr P6/mmm -8.789 -8.940 Zr5Sn2.3Fe0.7 I4/mcm -40.035 -41.657 Fe17.39Sn43.47Zr39.13 (X’’) Cmc21 -39.860 -41.280 Fe17.65Sn39.22Zr43.13 (X’) Unknown — -47.605 Fe56.24Sn28.13Zr15.63 (Y) Unknown — -18.146
Phase Parameters (J/mol)
C14 (Fe,Sn,Zr)4 (Fe,Sn,Zr)2(Fe,Sn,Zr)6 GFe:Sn:Zr = 846468+4*GHSERFE+2*GHSERSN+6*GHSERZR GZr:Sn:Fe = – 305871+6*GHSERFE+2*GHSERSN+4*GHSERZR GSn:Zr:Fe = 156184+6*GHSERFE+4*GHSERSN+2*GHSERZR GSn:Fe:Zr = – 44458+2*GHSERFE+4*GHSERSN+6*GHSERZR GZr:Fe:Sn = – 120232+2*GHSERFE+6*GHSERSN+4*GHSERZR GFe:Zr:Sn = 665830+4*GHSERFE+6*GHSERSN+2*GHSERZR C15 (Fe,Sn,Zr) 2(Fe,Sn,Zr)1 0L Fe:Sn,Zr = – 110000 C36 (Fe,Sn,Zr)4 (Fe,Sn,Zr) 4(Fe,Sn,Zr)16 GFe:Sn:Zr = 975964+4*GHSERFE+2*GHSERSN+6*GHSERZR GZr:Sn:Fe = – 410268 –109*T+6*GHSERFE+2*GHSERSN+4*GHSERZR GSn:Zr:Fe = – 368546+6*GHSERFE+4*GHSERSN+2*GHSERZR GSn:Fe:Zr = 1175979+2*GHSERFE+4*GHSERSN+6*GHSERZR GZr:Fe:Sn = 1135254+2*GHSERFE+6*GHSERSN+4*GHSERZR GFe:Zr:Sn = 1205127+4*GHSERFE+6*GHSERSN+2*GHSERZR 0L Zr:Sn,Zr:Fe = – 398285 + 75*T Fe36,36Sn36,36Zr27,27 (N) (Fe) 16 (Sn)16(Zr)12 G= – 1420604 – 175*T+16*GHSERFE+16*GHSERSN+12*GHSERZR FeSn2Zr6 (θ) (Fe)1 (Sn)2(Zr)6 G= – 368233 +1*GHSERFE+2*GHSERSN+6*GHSERZR Fe6Sn6Zr (Fe)6 (Sn)6(Zr)1 G= – 170972 – 34*T+6*GHSERFE+6*GHSERSN+1*GHSERZR Zr5Sn2,3Fe0,7 (Fe) 3 (Sn)9(Zr)20 G= –1360910 –148*T+3*GHSERFE+9*GHSERSN+20*GHSERZR Fe14.39Sn43.47Zr39.13 (X’’) (Fe)8 (Sn)20(Zr)18 G= –1971900 –160*T+8*GHSERFE+20*GHSERSN+18*GHSERZR Fe17,65Sn39,22Zr43,13 (X’) (Fe)9 (Sn)20(Zr)22 G= – 2510000 +9*GHSERFE+20*GHSERSN+22*GHSERZR Fe36,36Sn36,36Zr27,2 (Y) (Fe) 18 (Sn)9(Zr)5 G= – 745000 +18*GHSERFE+9*GHSERSN+5*GHSERZR
![Figure 3: Calculated Fe-Sn system compared to data of Tréheux et al. [21], Arita et al](https://thumb-eu.123doks.com/thumbv2/123doknet/13086585.385137/24.892.239.626.139.458/figure-calculated-fe-system-compared-data-tréheux-arita.webp)

![Figure 8: Calculated Fe–Zr system compared to data of Tanner et al. [40], Svechnikov et al](https://thumb-eu.123doks.com/thumbv2/123doknet/13086585.385137/26.892.199.660.644.989/figure-calculated-fe-zr-compared-data-tanner-svechnikov.webp)


![[PDF] Cours sur Règles de programmation FORTRAN | Formation informatique](data:image/gif;base64,R0lGODlhAQABAIAAAP///wAAACH5BAEAAAAALAAAAAABAAEAAAICRAEAOw==)