HAL Id: hal-02147579
https://hal.archives-ouvertes.fr/hal-02147579
Submitted on 4 Jun 2019
HAL is a multi-disciplinary open access
archive for the deposit and dissemination of
sci-entific research documents, whether they are
pub-lished or not. The documents may come from
teaching and research institutions in France or
abroad, or from public or private research centers.
L’archive ouverte pluridisciplinaire HAL, est
destinée au dépôt et à la diffusion de documents
scientifiques de niveau recherche, publiés ou non,
émanant des établissements d’enseignement et de
recherche français ou étrangers, des laboratoires
publics ou privés.
Visualization of intracellular lipid droplets using
lipophilic benzothiazole-based push-pull fluorophores at
ultralow concentration
Mauro Filho, Pascal Dao, Anthony Martin, Rachid Benhida
To cite this version:
Mauro Filho, Pascal Dao, Anthony Martin, Rachid Benhida. Visualization of intracellular lipid
droplets using lipophilic benzothiazole-based push-pull fluorophores at ultralow concentration. Dyes
and Pigments, Elsevier, 2019, 167, pp.68-76. �10.1016/j.dyepig.2019.04.003�. �hal-02147579�
Visualization of intracellular lipid droplets using lipophilic benzothiazole-based push-pull fluorophores
at ultralow concentration.
Mauro Safir Filho,†,a,b Pascal Dao,†,a Anthony R. Martin,*a and Rachid Benhida,*a,c
a Université Côte d’Azur, CNRS, Institut de Chimie de Nice UMR7272, Nice, France. b CAPES Foundation, Ministry of Education of Brazil, Brasília DF 70040-020, Brazil c Mohamed VI Polytechnic University, UM6P, 43150 Ben Guerir, Morocco
* corresponding authors: anmartin@unice.fr, benhida@unice.fr
Abstract
In this study we describe the development of new lipophilic and biocompatible benzothiazole-based push-pull fluorophores as potent fluorogenic probes for the specific staining of intracellular lipid droplets (LDs) at ultralow concentration (≤ 100 nM). These new fluorophores, harboring a D-π-A framework featuring an extended π-conjugated spacer, a lipophilic tertiary amine (D) and hydrophobic aryl groups (A), were prepared by an efficient and practical synthetic route. The photophysical studies of these compounds underlined their high polarity sensitivity, characterized by a strong solvatochromic effect and the large Stokes shifts values (λem 465-630 nm, Δλ up to 6751 cm-1). Finally, the in cellulo investigations of D1 revealed its ability to selectivity accumulate
in LDs and to allow their remarkable visualization using confocal fluorescence microscopy.
Keywords: benzothiazole fluorophores, push-pull fluorophores, lipid droplets, confocal microscopy
Introduction
Lipid droplets (LDs) are cytoplasmic organelles involved in the storage of neutral lipids. They are composed of a core of hydrophobic neutral lipids surrounded by a phospholipid monolayer membrane and associated proteins of the PAT protein family (Perilipin, Adipocyte differentiation-related protein (ADRP) and TIP47 proteins (tail-interacting protein of 47 kDa)).[1] The degradation of LDs provides metabolic energy for different cellular process such as membrane formation, trafficking, or protein-protein interactions. The deregulation of LDs functions can lead to metabolic or immune disorders, as well as cancer.[2] Despite the recent advances in the understanding of biological properties and functions of LDs, the development of more specific and powerful tools dedicated to the visualization of LDs may further foster our deep understanding of the role of these peculiar organelles. In this context, fluorescence imaging techniques are one of the most powerful and popular tools for biomedical research, both for
in cellulo and in vivo studies. The development of robust and fine-tuned fluorescent probes featuring high brightness,
chemo/photostability and target selectivity significantly bolstered the ways to monitor and study biochemical changes of specific cellular compartments.[3] Of note, fluorescence imaging offers a versatile, biocompatible and non-invasive approach to track and
probe cellular organelles[4–6] and visualize local physicochemical changes such as the viscosity[7,8] and the pH.[9] Fluorescence imaging also enables the signaling of chemical analytes[10,11] or enzymes[12,13] with the advantages of its high sensitivity, low cost, user friendliness and possible temporal/spatial resolution.
Heretofore, only few examples of fluorescent probes for LD staining have been reported. Among them, the most popular and commercially available probes to visualize these structures include Nile Red[14] and BODIPY (493/503, 540)[15] fluorophores. However, these probes display important limitations. In fact, they need to be used as dilute solutions, as their fluorescence emission is highly suppressed at high-concentrations; possibly through an aggregation-caused quenching (ACQ). BODIPY fluorophores can selectively accumulates in LDs, but their reduced Stokes shift usually accounts for the self-deactivation of the excited fluorophore
via non-radiative energy transfer. This non-radiative decay leads to weak fluorescence intensity and interference from the scattered
excitation light that causes strong background artifacts. Conversely, the solvatochromic Nile Red dye shows poor selectivity towards LDs and usually stains other hydrophobic compartments within the cells. Moreover, it also shows broad absorption and emission spectra, hence hampering its use for multicolour imaging. To overcome such drawbacks and enhance the staining stability and selectivity for lipid droplets, the quest for new fluorogenic probes with superior photophysics and different operation modes was undertaken.[16] Prospective advances in molecular platforms for LDs staining have been recently published, exploiting numerous hydrophobic fluorogenic probes including AIEgens (aggregation induced emission luminogens),[17–22] solvatochromic StatoMerocyanine dyes,[23] and solvatofluorochromic fluorophores displaying emission from intramolecular charge transfer excited states.[24–27]
In our laboratory, we have recently developed a new set of environment responsive D-π-A fluorophores and demonstrated their high biocompatibility, fine-tuned spectroscopic properties, and their smooth chemical transformation into molecular probes for biological applications.[28,29] The molecular structures of our fluorophores encompass an electron donating 6-aminofunctionalized benzothiazole scaffold (D) which is connected via a single vinyl linker to different electron acceptor aryl groups (A) (Fig. 1). The straightforward and diversity-orientated synthetic pathway to access these compounds has enabled the preparation of 20 different fluorophores featuring high brightness and remarkable solvatofluorochromism.[28] Thereafter, these fluorophores were successfully employed to develop highly sensitive probes to monitor β-galactosidase activity during early stages of cellular senescence.[29]
Figure 1. General structure of the benzothiazole-based styryl fluorophores previously reported by our group.[28,29]
Results and discussion
N S N R2 R1 primary secondary tertiary polycyclic aromatic EWG phenyl EDG phenyl R
D
-π-
A
20 examples R1 = H, Et, nBu R2 = H, Et, nBu R = OMe, CF3, BrAr = Ph, Naphthyl, pyrenyl, etc. Ar
Building on our prior work on benzothiazole-based push-pull fluorophores adaptable for biomedical applications, we have developed a new set of highly lipophilic fluorogenic probes that are adapted to the intracellular staining of LDs. For this purpose, we designed a new set of fluorophores that features a lipophilic 6-N-ethyl-N’-butylaminobenzothiazole as the electron donating group (D), an extended vinyl-phenylacetylene spacer as a π-conjugated linker and a hydrophobic terminal aryl (A) motif (Fig. 2). Herein, we disclose the photophysical characterization of these novel structures by UV-Vis absorption and steady-state fluorescence emission spectroscopies and exemplify their use for intracellular lipid droplet visualization by confocal microscopy.
Figure 2. General structure of the benzothiazole-based push-pull fluorophores explored in this work.
The scaffold design presented in Fig.2 should grant access to fluorophores exhibiting high lipophilicity and improved photophysical properties in terms of absorption maxima, brightness and Stokes shift. Thus, a plain phenyl ring, analogs harboring electron withdrawing groups (4-methylbenzoate and 4-formylphenyl) and polycyclic aromatic hydrocarbons (9-phenanthryl, 4-biphenyl and 1-naphthyl) were selected as acceptor moieties (A) in order to build up a large charge transfer character of the dyes in the excited state (Table 1). In parallel, we also expected that the use of an extended π-conjugated spacer could be beneficial for: (i) the redshift of the absorption maxima; (ii) increased charge separation between the donor and the acceptor groups in the excited state, which may also enhance the dye sensitivity to solvent polarity; and (iii) a contribution to enhance the lipophilicity of the dyes. Finally, we selected a lipophilic tertiary N-ethyl-N-butylamino function as the donor group (D).
Table 1. Chemical structure of the benzothiazole-based push-pull fluorophores studied in this work.
Dye Aryl D1 Phenyl D2 1-naphthyl D3 9-phenanthryl D4 4-biphenyl D5 4-formylphenyl D6 4-methylbenzoate Synthesis N S N Tertiary Amine Increased lipophilicity Acceptor Hydrophobic groups ICT modulation
extended π-conjugated linker
Increased conjugation Increased charge separation
D
-π-
A
Ar N S N ArThe first step of our study consisted of the synthesis of the bromo-containing dye precursor 2 and its subsequent decoration with different arylacetylene groups via Sonogashira cross coupling reactions using selected arylacetylenes. Dye precursor 2 was synthesized in a one-pot two-step synthetic route (Scheme 1) involving a Knoevenagel condensation between the p-bromobenzaldehyde and the 6-N-ethylaminobenzothiazole derivative (1), followed by the direct alkylation of the N-ethylamino group using 1-iodobutane. Thus, benzothiazole derivative 1 was engaged in a Knoevenagel condensation using a slight excess of p-bromobenzaldehyde (1.3 equiv.) and a stoichiometric amount of potassium hydroxide, in N,N-dimethylformamide at room temperature. Then, alkylation of this intermediate using n-iodobutane, in the presence of potassium carbonate, smoothly afforded the dye precursor 2 in a satisfactory 52% yield. With precursor 2 in hand, we proceeded with its connection to various arylacetylene scaffolds via a Sonogashira cross-coupling reaction. This reaction was performed under palladium catalysis, using [Pd(PPh3)4] and
copper iodide in the presence of 1.5 equivalents of the corresponding arylacetylene. The target fluorophores D1-D6, whose structures are summarized on Scheme 1, were obtained in moderate to good yields (23-67 %) after purification by preparative thin layer chromatography.
Scheme 1. Synthetic preparation of dye D1-D6. Reagents and conditions (i) p-bromobenzaldehyde (1.3 equiv.), KOH (1.0 equiv.),
DMF, r.t., overnight; (ii) 1-iodobutane (3.0 equiv.), K2CO3 (1.0 equiv.), DMF, 80°C, overnight. (iii) arylacetylene (1.5 equiv.),
[Pd(PPh3)4] (20 mol%), CuI (15 mol%), DMF:TEA (1:1), 50°C, 12 h.
Spectroscopic Studies
UV-Visible Absorption
Once these new compounds (D1-D6)were characterized by 1H and 13C NMR spectroscopies and high-resolution mass spectrometry,
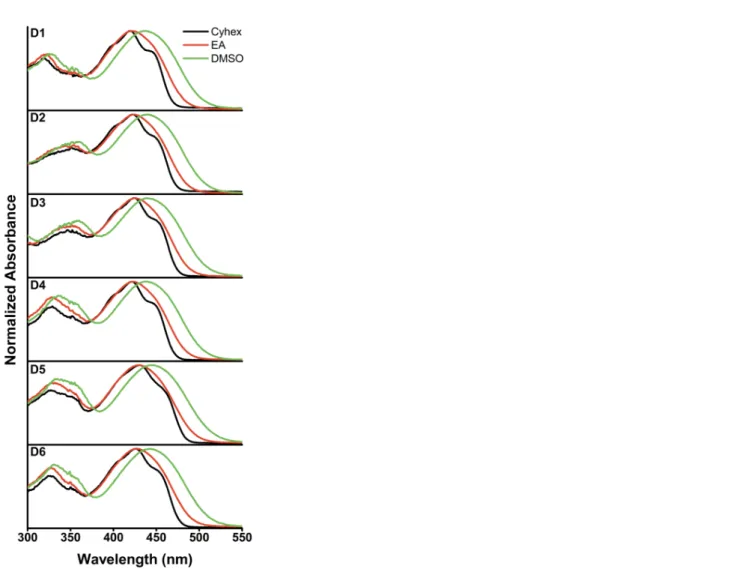
we investigated on their photophysical properties in different solvents: cyclohexane (Cyhex), 1,4-dioxane, ethyl acetate (EA), acetonitrile (MeCN), dimethyl sulfoxide (DMSO) and methanol (MeOH). Figure 3 and 4 depict the UV-Vis absorption and fluorescence emission spectra for these six fluorophores in three of the aforementioned solvents.[30] Table 1 summarizes the main photophysical data.
As a general trend, all these fluorophores present two intense absorption bands localized in the near ultraviolet (~ 318 - 356 nm, λabs1) and visible (~ 419 - 446 nm, λabs2) spectral regions. These bands should be associated with the excitation of these fluorophores
to an upper electronic excited state (S1 → Sn transition) and to the lowest energetic S1 state (S0 → S1 transition), respectively. In
addition, high molar extinction coefficient values were recorded regardless of the maxima (λabs1 orλabs2) that was considered (ε =
N S N nBu Br N S N nBu R (iii) O O OMe D1 (42%) D2 (23%) D3 (29%) D4 (67%) D5 (49%) D6 (56%) 2 (52%) D1-D6 (i) (ii) N S H N 1
24.6 - 39.7 × 10⁴ M-1.cm-1, λ
abs1; 35.0 - 53.3 x 10⁴ M-1.cm-1, λabs2); they are in agreement with a π−π* transitions. Interestingly, both
absorption bands exhibited very weak charge transfer character which is accounted for the moderate solvatochromic effect that was observed for all the dyes. In fact, when changing from the least to the most polar solvent the absorption maxima are red-shifted by only 8-17 nm. Regarding the absorption spectra, the maxima in the near-UV region (λabs1) are shifted to longer wavelength for the
molecules harboring the larger frameworks (1-naphthyl and 9-phenanthryl, dyes D2 and D3, respectively) compared with the dyes
D1, D4-D6. Conversely to λabs1, all the dyes displayed λabs2 values in a narrow range (Table 1). Moreover, compared with our
previous work where the donor and the acceptor were separated by a single vinyl π-spacer, the lowest energy electronic transitions are significantly red-shifted (~ 30 nm).[28] This is a clear consequence of the larger π-spacer that is used in the present study.
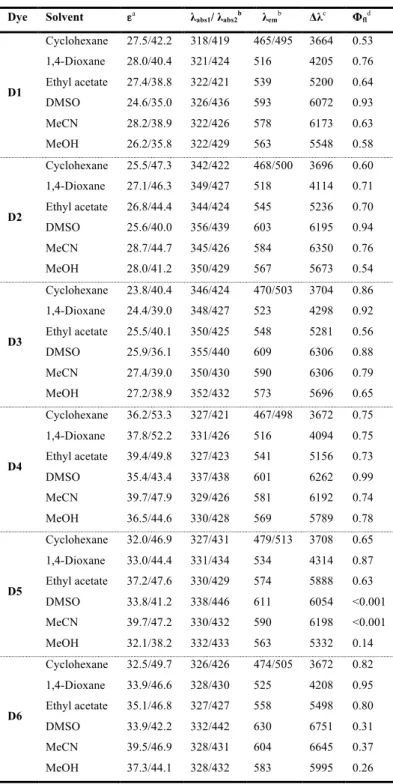
Table 2. Main photophysical data of the fluorophores D1-D6.
Dye Solvent εa λabs1/ λabs2b λemb Δλc Φfld
D1 Cyclohexane 1,4-Dioxane Ethyl acetate DMSO MeCN MeOH 27.5/42.2 28.0/40.4 27.4/38.8 24.6/35.0 28.2/38.9 26.2/35.8 318/419 321/424 322/421 326/436 322/426 322/429 465/495 516 539 593 578 563 3664 4205 5200 6072 6173 5548 0.53 0.76 0.64 0.93 0.63 0.58 D2 Cyclohexane 1,4-Dioxane Ethyl acetate DMSO MeCN MeOH 25.5/47.3 27.1/46.3 26.8/44.4 25.6/40.0 28.7/44.7 28.0/41.2 342/422 349/427 344/424 356/439 345/426 350/429 468/500 518 545 603 584 567 3696 4114 5236 6195 6350 5673 0.60 0.71 0.70 0.94 0.76 0.54 D3 Cyclohexane 1,4-Dioxane Ethyl acetate DMSO MeCN MeOH 23.8/40.4 24.4/39.0 25.5/40.1 25.9/36.1 27.4/39.0 27.2/38.9 346/424 348/427 350/425 355/440 350/430 352/432 470/503 523 548 609 590 573 3704 4298 5281 6306 6306 5696 0.86 0.92 0.56 0.88 0.79 0.65 D4 Cyclohexane 1,4-Dioxane Ethyl acetate DMSO MeCN MeOH 36.2/53.3 37.8/52.2 39.4/49.8 35.4/43.4 39.7/47.9 36.5/44.6 327/421 331/426 327/423 337/438 329/426 330/428 467/498 516 541 601 581 569 3672 4094 5156 6262 6192 5789 0.75 0.75 0.73 0.99 0.74 0.78 D5 Cyclohexane 1,4-Dioxane Ethyl acetate DMSO MeCN MeOH 32.0/46.9 33.0/44.4 37.2/47.6 33.8/41.2 39.7/47.2 32.1/38.2 327/431 331/434 330/429 338/446 330/432 332/433 479/513 534 574 611 590 563 3708 4314 5888 6054 6198 5332 0.65 0.87 0.63 <0.001 <0.001 0.14 D6 Cyclohexane 1,4-Dioxane Ethyl acetate DMSO MeCN MeOH 32.5/49.7 33.9/46.6 35.1/46.8 33.9/42.2 39.5/46.9 37.3/44.1 326/426 328/430 327/427 332/442 328/431 328/432 474/505 525 558 630 604 583 3672 4208 5498 6751 6645 5995 0.82 0.95 0.80 0.31 0.37 0.26
a ε : molar extinction coefficient (× 10-3 in (M.cm)-1); b λ
abs and λem : absorption and emission maxima (in nm), respectively; c Δλ :
Stokes shift (in cm-1); d Φ
fl : fluorescence quantum yield.
Figure 3. UV-Vis absorption spectra in different solvents of dyes D1-D6. Condition: dye concentration ≈ 10 µM; cell path length,
1 cm.
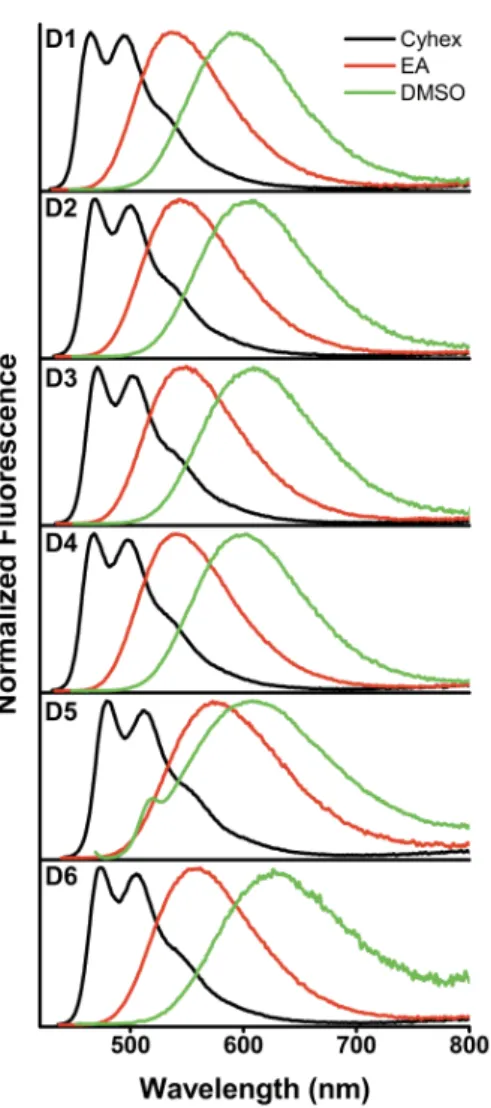
Fluorescence emission
The fluorescence emission spectra for each dye were recorded using the relevant absorption maxima (λabs1 and λabs2) as the excitation
wavelengths. In contrast to the ground state properties, all these six fluorophores showed remarkable red-shift in their emission maxima when going from the least polar aprotic solvent to the most polar environment (Table 2 and Fig. 4). This positive solvatofluorochromism strongly emphasizes a large charge transfer character of the S1 excited state of dyes D1-D6. Among all
fluorophores, compound D6, bearing the strong acceptor group 4-methylbenzoate, presented the highest degree of solvent sensitivity, with Stokes shift (Δλ, λabs2 - λem) values up to 6751 cm-1 in DMSO. Analogously, no noticeable differences in the
emission spectra were observed for the fluorophores featuring unsubstituted acceptor (A) groups (D1-D4). Additionally, whatever the excitation wavelength (λabs1 or λabs2) the same emission spectra were recorded, which may indicate that the rate of internal
conversion from upper excited states (Sn) to S1 is very fast and fluorescence emission only takes place from the relaxed S1 excited
bearing π-electron acceptor groups (-CHO and -COOMe, D5 and D6, respectively) where a decrease in the emission intensity was observed in solvents with increased polarity. It is well known that the reduced energy gap between the excited and ground states in polar solvents may favor internal conversion from the S1 to the S0 state and create a non-radiative tunnel to release energy. However,
the particular behavior observed for dye D5, harboring the strong electron withdrawing formyl group, actually supports the hypothesis that the fully charge separated and non-emissive twisted intramolecular charge transfer state (TICT) may be formed. Essentially, changes in the molecular geometry associated with an internal rotation within the fluorophore can usually provide an increase in the rate of the non-radiative decay, hence causing the fluorescence quenching. Many examples of solvatochromic fluorophores displaying either weak fluorescence emission or a significant drop of the Φfl values in highly polar solvents have been
associated with the formation of a putative TICT excited state.[31,32] Of note, an anomalous emission in methanol (blue shifted compared with the less polar ethyl acetate) was observed for dye D5. This may evidence conversion of the formyl group into an (hemi)acetal moiety, thus reducing its acceptor character.
Figure 4. Fluorescence emission spectra in different solvents of dyes D1-D6. Condition: dye concentration ≈ 1 µM; cell path length,
1 cm.
Finally, the positive solvatochromism was further investigated using the Lippert-Mataga model (Fig. 5). The Stokes shift was plotted as a function of the orientation polarizability (Δf) in aprotic solvents. In all cases, linear relationships were obtained. These results
Figure 5. Dependence of the Stokes shift (λabs2 - λem) on the Lippert-Mataga orientation polarizability paremeter for dyes D1 (black),
D4 (red) and D6 (green). Correlation factors R2 are, respectively, 0.97, 0.97 and 0.96.
In Cellulo Imaging
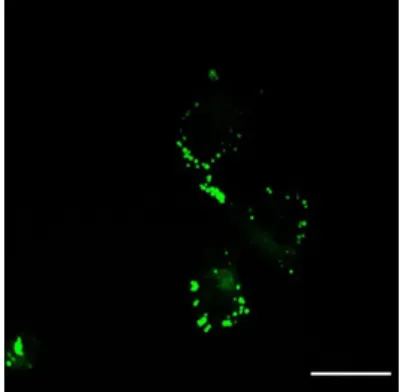
Following the investigation of the photophysical properties of these fluorophores, we assessed their applicability in the tracking of intracellular lipid droplets. For this purpose, dye D1, that bears a plain phenyl ring as the acceptor moiety, was selected as a simple example from the series D1-D6 (vide infra). As a preliminary study, cellular imaging experiments by confocal laser scanning microscopy were performed to investigate the in cellulo application of D1 in fixed cells. Since altered LD expression can marker of cancer aggressiveness,[27] we employed, in this experiment, A375 melanoma cells as a cancer cell model. After incubation of D1 (100 nM) in A375 melanoma cancer cells for 30 minutes, an intense and selective fluorescence emission was recorded. Thus, the cellular uptake of D1 could be confirmed (Fig. 6). The visualization under the microscope underlines that D1 selectively accumulates in cytoplasmic dots/vesicles which are consistent in size and shape with spherical organelles such as LDs.
Figure 6. Cellular uptake of dye D1: Melanoma cells A375 were incubated with 100 nM of probes D1 for 30 min. Scale bar 50 µM.
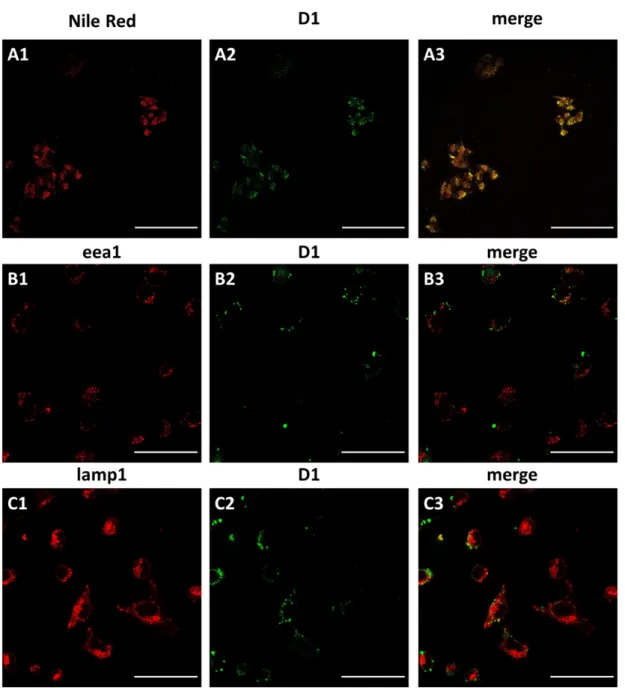
Following this initial experiment, we performed colocalization studies to evidence whether or not D1 was located in LDs. Therefore, we employed the Nile Red fluorophore as the reference marker for LDs.[14] Interestingly, control experiments with specific markers of different round-shaped structures such as eea1 (endosomes) and lamp1 (lysosomes) were performed as well to definitely identify the exact location of D1. Satisfactorily, the results clearly underpin the selective colocalization of D1 and Nile Red and no overlap with the two other organelles was recorded (Fig. 7). In fact, this confocal microscopy observation emphasized the higher capacity of probe D1 for staining LDs with improved selectivity, reduced background emission and in a lower concentration than the Nile Red marker. Heretofore, few probes for the tracking of lipid droplets at ultralow concentration (≤ 100 nM) have been reported in
the literature.[17] In addition, this report is, to date, the lowest reported concentration to stain LDs in cells using solvatofluorochromic fluorophores.[24–27]
Figure 7. Confocal microscopy of melanoma cells co-stained with probe D1 and (A) Nile Red (Lipid droplets), (B) lamp1
(lysosome) and (C) eea1 (endosome). Scale bar: 50 µm. For image A1, B1 and C1 emission was collected at 600-700 nm (λex = 594
nm). For image A2, B2 and C2 emission was collected at 450-550 nm (λex = 458 nm). The merged images (A3, B3 and C3)
correspond to the combined green and red channels.
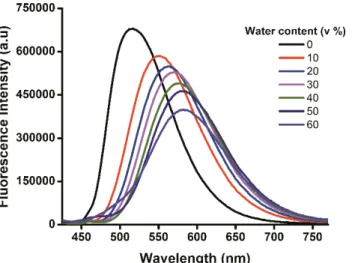
The excellent ability for staining LDs at submicromolar concentrations using probe D1 may result from the synergic contribution of different factors. Notably, D1 has an inherent and significant lipophilic character, evidenced by its high ClogP value of 10.1.[33] This value is significantly above the lower threshold value (ClogP = 5) usually required for lipid droplet staining, as estimated by Horobin and co-workers.[34] In addition, dye D1 shows significant sensitivity to water. Indeed, while bright fluorescence emission is recorded in non-aqueous environments (e.g. lipid droplets, organic solvent), this emission intensity is substantially suppressed when the water content increases (e.g. cytosol) (Fig. 8). Thus, the combination of the highly lipophilic character of D1 and its fluorescence quenching in aqueous environment may account for the selective staining of LDs with very low background noise.
To demonstrate the enhanced fluorescence emission of D1 in LDs, we analysed the changes in emission in PBS solution (pH = 7.4), in the presence of incremental amounts of dispersed oleic acid droplets (0-300 µM, Fig. 9). In this case, a spectacular increase in the fluorescence intensity (> 40-fold), together with the expected blue shift in the emission maxima, was observed upon accumulation of the probe D1 inside the lipidic vesicles. Hence, these observations strongly support the fact that D1 displays a high affinity for LDs and its sequestration in LDs greatly enhances its fluorescence emission.
Figure 8. Fluorescence emission spectra of D1 in response to incremental amount of H2O in 1,4-dioxane (0-60%, v:v). Conditions:
dye concentration ≈ 0.1 µM; λexc = 405 nm. (Higher water content led to the precipitation of the fluorophore).
Figure 9. Fluorescence emission spectra of D1 in PBS (pH 7.4) in the absence and after supplementation with increased amounts
of oleic acid (0-300 mM). Conditions: dye concentration ≈ 0.1 µM; λexc = 405 nm.
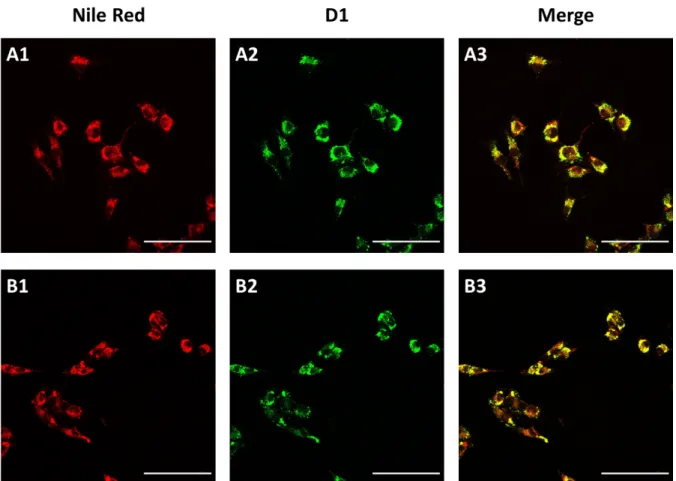
Next, we explored the application of D1 to monitor the accumulation of lipid droplets in cells. Fatty acids and phospholipids are essential sources of energy for the cellular machinery. Recent studies demonstrated that high levels of intracellular LDs can be closely associated with the rapid growth of cancer cells. These observations highlight that the monitoring of altered LD expression can be used as a marker of cancer aggressiveness.[27] Therefore, in this experiment, A375 melanoma cells were incubated with oleic acid (50 µM) for 24 h prior to their staining using D1. Of note, it is known that fatty acid supplementation of cultured cells stimulates the fatty acid receptor FFAR4, which in turn triggers the increase of LD vesicles in size and number.[35] As expected, this overproduction of lipid storage vesicles could be clearly visualized, and it was closely correlated with an increase in the fluorescence intensity compared with cells that were not supplemented with oleic acid (Fig. 10 vs Fig. 7A). Altogether, these results
clearly underpin that D1 can be used as a selective and specific intracellular lipid droplet staining probe in fixed cells. It can be used either for colocalization studies or to report altered lipid metabolism associated with an extended expression of lipid storage structures. It is noteworthy that the use of D1 at submicromolar concentration (100 nM) accounts for its superior performance compared with the Nile Red fluorophore.
Figure 10. Confocal microscopy of melanoma cells (2 fields) exposed to oleic acid for 24 h and co-stained with probe D1 (100 nM)
and Nile Red (300 nM), as the reference marker for LDs. Scale bar: 50 µm. For image A1 and B1 emission was collected at 600-700 nm (λex = 594 nm). For image A2 and B2 emission was collected at 450-550 nm (λex = 458 nm). The merged images (A3 and
B3) correspond to the combined green and red channels.
Conclusion
In this work a new family of highly lipophilic solvatofluorochromic fluorophores (D1-D6), exploiting a 6-aminofunctionalized benzothiazole core, were successfully designed and synthesized in a 6 steps synthetic route. The photophysical properties of D1-D6 were studied using solutions in different solvents, using UV-visible absorption and steady-state fluorescence emission spectroscopy. These new fluorophores display very bright fluorescence emissions in all solvents. They feature two intense absorption bands, large Stokes shifts and substantial polarity sensitivity underlined by the strong positive solvatochromic effect. The fluorescence quenching in aqueous environments and the high affinity of these compounds to target hydrophobic/lipidic compartments was demonstrated. The latter could be clearly rationalized considering the high ClogP value for dye D1. Finally, the biocompatibility for in cellulo applications was also ascertained, for D1, and exemplified in fixed A375 melanoma cells. This study revealed the high specificity
of this dye for intracellular lipid droplets staining at ultralow probe concentration and with low background emission. Moreover,
D1 can be used to visualize changes on LD size and concentration. Following this first study concerning this family of fluorophores,
we now envision the use of these as biological tools for LD tracking in applied biomedical research.
Experimental section
All solvents for absorption and fluorescence experiments were of spectroscopic grade. Absorption spectra were recorded on a Cary 4 spectrophotometer (Varian) using quartz cells of 1 cm path length. Fluorescence spectra were recorded on FluoroMax 4.0 spectrofluorometer (Jobin Yvon, Horiba). The wavelengths corresponding to the absorption maxima were used as the excitation wavelengths. Stock solutions of the solvatofluorochromic dyes were prepared in 1,4-dioxane. The samples used for spectroscopic measurements contained ≈ 1% v/v of the stock solvent. UV-vis absorption spectra were recorded using a dye concentration of ca. 10-5 M. Fluorescence emission spectra were recorded using a dye concentration of ca. 10-6 M. For the fluorescence quantum yield
calculation, the refraction indexes of solvents were taken into account. Quinine sulfate in an aqueous 0.1 M HClO4 solution (Φfl =
0.59) or fluorescein in 0.1 M NaOH aq. solution (Φfl = 0.89) ware used as the references.[36]. All chemical reagents were obtained
from commercial sources (Aldrich, Acros, Alfa Aesar) and were used without purification. Column chromatography was performed with flash silica gel (40–63 mm). Preparative TLC was performed using 20 × 20 cm, 500 µM silica gel plates (Analtech). All NMR spectra (1H, 13C) were recorded on a Bruker Advance Spectrometer 400. 1H NMR (400 MHz) and 13C{1H} NMR (101 MHz) spectra were obtained with samples dissolved in CDCl3 or CD2Cl2, with the solvent or residual solvent signals as internal references: 7.26
ppm for CHCl3 and 5.32 ppm for CD2Cl2 for 1H NMR experiments, and 77.16 ppm for CDCl3 and 53.84 ppm for CD2Cl2 for 13C
NMR experiments.[37] Chemical shifts (δ) are given in ppm to the nearest 0.01 (1H) or 0.1 ppm (13C). The coupling constants (J)
are given in Hertz (Hz). The signals are reported as follows: chemical shift, multiplicity (s = singlet, d = doublet, t = triplet, m = multiplet, dd = doublet of doublets), coupling constants (J) and integration. High Resolution Mass Spectra (HRMS) were recorded on a ThermoFisher Q Exactive (ESIMS) at a resolution of 140000 at m/z 200. Supplementary data associated with this article include: photophysical characterizations, copies of NMR spectra - see Supporting Information for more details.
Synthetic Procedures
Synthesis of dye 2
Precursor 1 (1.0 equiv.) in DMF (0.2 M), potassium hydroxide (1.0 equiv.) and corresponding aldehyde (1.3 equiv.) were stirred overnight at room temperature. After complete conversion of the starting material (TLC monitoring), the base was filtered off and 3 equivalents of 1-iodobutane and a stoichiometric amount of potassium carbonate were added. The mixture was heated at 80°C overnight. The solvent was removed in vacuo, and the crude material was purified by flash column chromatography on silica gel using a cyclohexane/ethyl acetate mixture as the eluent (9/1, v/v). Finally, recrystallization from methanol afforded the desired dyes
in good yield and satisfactory purity for the following steps. Yield 52 %. 1H NMR (400 MHz, CDCl3) δ 7.78 (d, J = 9.1 Hz, 1H),
7.51 (d, J = 8.5 Hz, 2H), 7.40 (d, J = 8.5 Hz, 2H), 7.34 (d, J = 16.2 Hz, 1H), 7.25 (t, J = 16.2 Hz, 1H), 6.98 (d, J = 2.4 Hz, 1H), 6.86 (dd, J = 9.1, 2.5 Hz, 1H), 3.43 (q, J = 7.1 Hz, 2H), 3.35 (t, J = 7.5 Hz, 2H), 1.66 – 1.62 (m, 2H), 1.42 – 1.34 (m, 2H), 1.20 (t, J = 7.0 Hz, 3H), 0.98 (t, J = 7.3 Hz, 3H).13C NMR (101 MHz, CDCl3) δ 161.0, 146.8, 145.1, 137.2, 135.1, 133.6, 132.2, 128.6, 123.5,
123.5, 122.8, 112.9, 101.8, 50.8, 45.6, 29.8, 20.5, 14.2, 12.5. HRMS (ESI) m/z: [M+H]+ Calcd for C
21H24BrN2S 415.0844; Found
415.0840.
Synthesis of dyes D1-D6
Bromide derivative 2 (0.1 mmol, 1.0 equiv.), [Pd(PPh3)4] (20 mol%), CuI (10 mol%) and the corresponding aryl alkyne (1.5 equiv)
were suspended in DMF/TEA (1:1, 0.05 M) and heated at 50°C overnight. The mixture was diluted with ethyl acetate (5 mL), filtered through a bed of celite and washed with a solution of EDTA disodium salt (0.1 M, 3 × 5 mL). The organic phase was dried over MgSO4 and concentrated in vacuo. The crude material was purified by preparative thin layer chromatography using a mixture
of cyclohexane and ethyl acetate as the eluent. Dyes D1-D6 were obtained as bright solids.
Dye D1. The crude product was purified using cyclohexane/ethyl acetate (9/1, v/v) as the eluent. Yield 42 %. 1H NMR (400 MHz,
CD2Cl2) δ 7.74 (d, J = 9.1 Hz, 1H), 7.56 – 7.54 (m, 6H), 7.41 – 7.37 (m, 4H), 7.32 (d, J = 16.2 Hz, 1H), 7.02 (d, J = 2.5 Hz, 1H),
6.87 (dd, J = 9.1, 2.5 Hz, 1H), 3.44 (q, J = 7.0 Hz, 2H), 3.34 (t, J = 7.8 Hz, 2H), 1.67 – 1.61 (m, 2H), 1.45 – 1.35 (m, 2H), 1.20 (t,
J = 7.0 Hz, 3H), 0.98 (t, J = 7.4 Hz, 3H). 13C NMR (101 MHz, CD
2Cl2) δ 161.1, 147.2, 145.4, 137.6, 136.4, 134.1, 132.4, 131.9,
128.8, 127.4, 124.0, 123.7, 123.6, 123.5, 113.1, 102.1, 91.2, 89.7, 51.0, 45.8, 30.0, 20.7, 14.2, 12.5. HRMS (ESI) m/z: [M + H]+ Calcd for C29H29N2S 437.2051; Found 437.2046.
Dye D2. The crude product was purified using cyclohexane/ethyl acetate (9/1, v/v) as the eluent. Yield 23 %. 1H NMR (400 MHz,
CDCl3) δ 8.45 (d, J = 8.3 Hz, 1H), 7.87 (t, J = 8.3 Hz, 2H), 7.79 (t, J = 8.2 Hz, 2H), 7.67 – 7.60 (m, 3H), 7.58 – 7.53 (m, 3H), 7.47 (dd, J = 8.1, 7.3 Hz, 1H), 7.41 (d, J = 16.2 Hz, 1H), 7.32 (d, J = 16.2 Hz, 1H), 6.99 (d, J = 2.5 Hz, 1H), 6.87 (dd, J = 9.1, 2.5 Hz, 1H), 3.44 (q, J = 7.1 Hz, 2H), 3.33 (t, J = 7.8 Hz, 2H), 1.67 – 1.59 (m, 2H), 1.43 – 7.35(m, 2H), 1.21 (t, J = 7.0 Hz, 3H), 0.99 (t, J = 7.3 Hz, 3H).13C NMR (101 MHz, CDCl 3) δ 161.2, 146.8, 145.1, 137.3, 136.1, 134.2, 133.4, 132.2, 130.6, 129.0, 128.5, 127.1, 126.9, 126.6, 126.3, 125.4, 123.7, 123.6, 123.5, 120.9, 112.9, 101.8, 94.5, 89.3, 50.8, 45.6, 29.8, 20.5, 14.2, 12.5. HRMS (ESI) m/z: [M + H]+ Calcd for C33H31N2S 487.2208; Found 487.2205.
Dye D3. The crude product was purified using cyclohexane/ethyl acetate (9/1, v/v) as the eluent. Yield 29 %. 1H NMR (400 MHz,
CD2Cl2) δ 8.74 – 8.70 (m, 1H), 8.69 (d, J = 8.2 Hz, 1H), 8.57 – 8.54 (m, 1H), 8.11 (s, 1H), 7.91 (d, J = 7.4 Hz, 1H), 7.76 – 7.67 (m,
6H), 7.65 – 7.60 (m, 3H), 7.41 (d, J = 16 Hz, 1H), 7.34 (d, J = 16.2 Hz, 1H), 7.02 (d, J = 2.4 Hz, 1H), 6.86 (dd, J = 9.1, 2.5 Hz, 1H), 3.43 (q, J = 7.0 Hz, 2H), 3.33 (t, J = 7.8 Hz, 2H), 1.66 – 1.62 (m, 2H), 1.42 – 1.34 (m, 2H), 1.19 (t, J = 7.0 Hz, 3H), 0.98 (t, J = 7.3 Hz, 3H).13C NMR (101 MHz, CD2Cl2) δ 161.1, 147.2, 145.4, 137.6, 136.6, 134.1, 132.5, 132.3, 131.6, 131.4, 130.7, 130.5, 129.0,
128.1, 127.6, 127.6, 127.5, 127.4, 127.2, 124.1, 123.7, 123.6, 123.3, 123.0, 119.8, 113.1, 102.1, 94.4, 89.5, 51.0, 45.8, 30.1, 30.0, 20.8, 14.2, 12.5. HRMS (ESI) m/z: [M + H]+ Calcd for C37H33N2S 537.2364; Found 537.2362.
Dye D4. The crude product was purified using cyclohexane/ethyl acetate (9/1, v/v) as the eluent. Yield 67 %. 1H NMR (400 MHz, CD2Cl2) δ 7.74 (d, J = 9.1 Hz, 1H), 7.65 – 7.58 (m, 6H), 7.58 (m, 4H), 7.47 (t, J = 7.6 Hz, 2H), 7.49 – 7.36 (m, 2H), 7.32 (d, J =
16.2 Hz, 1H), 7.02 (d, J = 2.5 Hz, 1H), 6.87 (dd, J = 9.1, 2.5 Hz, 1H), 3.44 (q, J = 7.0 Hz, 2H), 3.34 (t, J = 7.8 Hz, 1H), 1.67 – 1.59 (m, 2H), 1.45 – 1.37 (m, 2H), 1.20 (t, J = 7.0 Hz, 3H), 0.98 (t, J = 7.4 Hz, 3H). 13C NMR (101 MHz, CD2Cl2) δ 161.1, 147.2, 145.4,
141.5, 140.6, 137.6, 136.4, 134.1, 132.4, 132.3, 129.3, 128.1, 127.5, 127.4, 127.3, 124.0, 123.7, 123.6, 122.4, 113.1, 102.1, 91.2, 90.4, 51.0, 45.8, 30.0, 20.8, 14.2, 12.5. HRMS (ESI) m/z: [M + H]+ Calcd for C35H33N2S 513.2364; Found 513.2359.
Dye D5. The crude product was purified using cyclohexane/ethyl acetate (8.5/1.5, v/v) as the eluent. Yield 49 %. 1H NMR (400 MHz, CD2Cl2) δ 10.01 (s, 1H), 7.87 (d, J = 8.4 Hz, 2H), 7.74 (d, J = 9.1 Hz, 1H), 7.70 (d, J = 8.2 Hz, 2H), 7.58 (s, 4H), 7.40 (d, J
= 16.2 Hz, 1H), 7.32 (d, J = 16.2 Hz, 1H), 7.02 (d, J = 2.5 Hz, 1H), 6.87 (dd, J = 9.1, 2.6 Hz, 1H), 3.44 (q, J = 7.0 Hz, 2H), 3.34 (t,
J = 7.8 Hz, 2H), 1.66 – 1.61 (m, 2H), 1.44 – 1.35 (m, 2H), 1.20 (t, J = 7.1 Hz, 3H), 0.98 (t, J = 7.4 Hz, 3H).13C NMR (101 MHz, CD2Cl2) δ 191.7, 160.9, 147.2, 145.4, 137.6, 137.1, 136.0, 133.9, 132.6, 132.5, 129.9, 129.7, 127.4, 124.4, 123.6, 122.9, 113.1,
102.0, 93.5, 90.32, 51.0, 45.8, 30.0, 20.7, 14.2, 12.5. HRMS (ESI) m/z: [M + H]+ Calcd for C30H29N2OS 465.2001; Found 465.1999.
Dye D6. The crude product was purified using cyclohexane/ethyl acetate (8/2, v/v) as the eluent. Yield 56 %. 1H NMR (400 MHz, CD2Cl2) δ 8.02 (dd, J = 8.5, 1.8 Hz, 2H), 7.74 (d, J = 9.1 Hz, 1H), 7.62 (dd, J = 8.5, 1.8 Hz, 2H), 7.58 (s, 4H), 7.40 (d, J = 16.2 Hz,
1H), 7.32 (d, J = 16.2 Hz, 1H), 7.02 (d, J = 2.5 Hz, 1H), 6.87 (dd, J = 9.1, 2.6 Hz, 1H), 3.91 (s, 3H), 3.44 (q, J = 7.1 Hz, 2H), 3.34 (t, J = 7.6 Hz, 2H), 1.66 – 1.59 (m, 2H), 1.44 – 1.35 (m, 2H), 1.20 (t, J = 7.0 Hz, 3H), 0.98 (t, J = 7.4 Hz, 3H).13C NMR (101 MHz, CD2Cl2) δ 166.7, 160.9, 147.2, 145.4, 137.6, 136.9, 133.9, 132.6, 131.9, 130.2, 129.9, 128.1, 127.4, 124.3, 123.6, 123.1, 113.1,
102.0, 92.6, 90.4, 52.5, 51.0, 45.8, 30.0, 20.7, 14.2, 12.5. HRMS (ESI) m/z: [M + H]+ Calcd for C31H31N2O2S 495.2106; Found
495.2105.
Cell experiments
Human melanoma A375 cells were obtained from American Type Culture Collection (ATCC, Manassas, VA, USA) and cultured in Dubelcco’s Modified Eagle’s Medium (DMEM) containing 10% fetal bovine serum (FBS) and 5% penicillin/streptomycin at 37°C in a 5% CO2 incubator.
Fluorescence imaging
Cultured cells (A375, 5 × 10⁴ cells/well) were seeded overnight onto coverslips placed into a 6-well plate and incubated at 37°C in
a 5% CO2 incubator overnight. On the next day, the cover slips were rinsed with PBS, followed by fixation with 4%
paraformaldehyde for 5 min, washed with PBS and incubated with the primary antibody for 1 h at RT (EEA1, mouse monoclonal anti-endosome and lamp1, mouse monoclonal anti-lysosome). Next, the coverslips were washed and incubated with the secondary antibody (Alexa Fluor 488 anti-mouse) or Nile Red for 1 h for lipid staining. Finally, the coverslips were washed and mounted on glass slides. Cells were examined using a confocal microscope Nikon A1R scan head on a Nikon Eclipse Ti stand, using a Plan Apo
63× oil 1.4 NA objective. The excitation channel used was a LASER diode 405 nm and the emission signal was collected with an internal PMT detector equipped with a 450/50 filter set, and the transmission signal was collected on an external PMT.
To induce the production of lipid storage vesicles, the cells were treated with oleic acid (100 µM) for 24h before staining with Nile Red or/and D1.
Conflict of interest
There are no conflicts of interest to declare.
Acknowledgments
This work was supported by CNRS, University of Nice Sophia Antipolis and University Côte d’Azur, INSERM, Cancéropôle PACA and CAPES (fellowship to MSF, process number 99999.001495/2015-01). We also thank Maéva Gesson for her help with the fluorescence microscopy imaging.
Notes
† These authors (MSF and PD) contributed equally.
Associated Content
Supporting Information: Supplementary figures, copies of 1H, and 13C NMR and HRMS spectra of all reported compounds; spectra
from the photophysical study.
References
[1] Thiam AR, Farese R V, Walther TC, Walther TC. The biophysics and cell biology of lipid droplets. Nat Rev Mol Cell Biol 2013;14:775–86. doi:10.1038/nrm3699.
[2] Onal G, Kutlu O, Gozuacik D, Dokmeci Emre S. Lipid Droplets in Health and Disease. Lipids Health Dis 2017;16. doi:10.1186/s12944-017-0521-7.
[3] Danial JSH, Aguib Y, Yacoub MH. Advanced fluorescence microscopy techniques for the life sciences. Glob Cardiol Sci Pract 2016;16. doi:10.21542/gcsp.2016.16.
[4] Zhang X, Wang C, Han Z, Xiao Y. A photostable near-infrared fluorescent tracker with pH-independent specificity to lysosomes for long time and multicolor imaging. ACS Appl Mater Interfaces 2014;6:21669–76. doi:10.1021/am506750m. [5] Han Y, Li M, Qiu F, Zhang M, Zhang YH. Cell-permeable organic fluorescent probes for live-cell long-term
super-resolution imaging reveal lysosome-mitochondrion interactions. Nat Commun 2017;8:1307. doi:10.1038/s41467-017-01503-6.
[6] Zheng X, Zhu W, Ni F, Ai H, Gong S, Zhou X, et al. Simultaneous dual-color tracking lipid droplets and lysosomes dynamics using a fluorescent probe. Chem Sci 2019;10:2342-8. doi:10.1039/C8SC04462G.
[7] Kuimova MK, Yahioglu G, Levitt JA, Suhling K. Molecular Rotor Measures Viscosity of Live Cells via Fluorescence Lifetime Imaging. J Am Chem Soc 2008;50:6672–3. doi:10.1021/ja800570d
[8] Yang Z, He Y, Lee JH, Park N, Suh M, Chae WS, et al. A self-calibrating bipartite viscosity sensor for mitochondria. J Am Chem Soc 2013;135:9181–5. doi:10.1021/ja403851p.
[9] Han J, Burgess K. Fluorescent Indicators for Intracellular pH. Chem Rev 2010;110:2709–28. doi:10.1021/cr900249z. [10] Yang X, Zhou Y, Zhang X, Yang S, Chen Y, Guo J, et al. A TP-FRET-based two-photon fluorescent probe for ratiometric
visualization of endogenous sulfur dioxide derivatives in mitochondria of living cells and tissues. Chem Commun 2016;52:10289–92. doi:10.1039/c6cc05254a.
[11] Roopa, Kumar N, Bhalla V, Kumar M. Development and sensing applications of fluorescent motifs within the mitochondrial environment. Chem Commun 2015;51:15614–28. doi:10.1039/c5cc07098h.
[12] Burke HM, Gunnlaugsson T, Scanlan EM. Recent advances in the development of synthetic chemical probes for glycosidase enzymes. Chem Commun 2015;51:10576–88. doi:10.1039/c5cc02793d.
[13] Huang J, Li N, Wang Q, Gu Y, Wang P. A lysosome-targetable and two-photon fluorescent probe for imaging endogenous β-galactosidase in living ovarian cancer cells. Sensors Actuators, B Chem 2017;246:833–9. doi:10.1016/j.snb.2017.02.158.
[14] Greenspan P, Mayer EP, Fowler SD. Nile red: A selective fluorescent stain for intracellular lipid droplets. J Cell Biol 1985;100:965–73. doi:10.1083/jcb.100.3.965.
[15] Spandl J, White DJ, Peychl J, Thiele C. Live cell multicolor imaging of lipid droplets with a new dye, LD540. Traffic 2009;10:1579–84. doi:10.1111/j.1600-0854.2009.00980.x.
[16] Fam TK, Klymchenko AS, Collot M. Recent advances in fluorescent probes for lipid droplets. Materials 2018;11:1768– 87. doi:10.3390/ma11091768.
[17] Niu G, Zhang R, Kwong JPC, Lam JWY, Chen C, Wang J, et al. Specific Two-Photon Imaging of Live Cellular and Deep-Tissue Lipid Droplets by Lipophilic AIEgens at Ultralow Concentration. Chem Mater 2018;30:4778–87. doi:10.1021/acs.chemmater.8b01943.
[18] Jiang M, Gu X, Lam JWY, Zhang Y, Kwok RTK, Wong KS, et al. Two-photon AIE bio-probe with large Stokes shift for specific imaging of lipid droplets. Chem Sci 2017;8:5440–6. doi:10.1039/c7sc01400g.
[19] Wang Z, Gui C, Zhao E, Wang J, Li X, Qin A, et al. Specific Fluorescence Probes for Lipid Droplets Based on Simple AIEgens. ACS Appl Mater Interfaces 2016;8:10193–200. doi:10.1021/acsami.6b01282.
[20] Wang E, Zhao E, Hong Y, Lam JWY, Tang BZ. A highly selective AIE fluorogen for lipid droplet imaging in live cells and green algae. J Mater Chem B 2014;2:2013–9. doi:10.1039/c3tb21675f.
droplets. Chem Commun 2016;52:5957–60. doi:10.1039/c6cc01797e.
[22] Gao M, Su H, Lin Y, Ling X, Li S, Qin A, et al. Photoactivatable aggregation-induced emission probes for lipid droplets-specific live cell imaging. Chem Sci 2017;8:1763–8. doi:10.1039/c6sc04842k.
[23] Collot M, Fam TK, Ashokkumar P, Faklaris O, Galli T, Danglot L, et al. Ultrabright and Fluorogenic Probes for Multicolor Imaging and Tracking of Lipid Droplets in Cells and Tissues. J Am Chem Soc 2018;140:5401–11. doi:10.1021/jacs.7b12817.
[24] Kim E, Lee S, Park SB. A Seoul-Fluor-based bioprobe for lipid droplets and its application in image-based high throughput screening. Chem Commun 2012;48:2331–3. doi:10.1039/c2cc17496k.
[25] Sharma A, Umar S, Kar P, Singh K, Sachdev M, Goel A. A new type of biocompatible fluorescent probe AFN for fixed and live cell imaging of intracellular lipid droplets. Analyst 2016;141:137–43. doi:10.1039/C5AN01623A.
[26] Goel A, Sharma A, Kathuria M, Bhattacharjee A, Verma A, Mishra PR, et al. New fluoranthene FLUN-550 as a fluorescent probe for selective staining and quantification of intracellular lipid droplets. Org Lett 2014;16:756–9. doi:10.1021/ol403470d.
[27] Appelqvist H, Stranius K, Börjesson K, Nilsson KPR, Dyrager C. Specific Imaging of Intracellular Lipid Droplets Using a Benzothiadiazole Derivative with Solvatochromic Properties. Bioconjug Chem 2017;28:1363–70.
doi:10.1021/acs.bioconjchem.7b00048.
[28] Safir Filho M, Fiorucci S, Martin AR, Benhida R. Design, synthesis and photophysical studies of styryl-based push–pull fluorophores with remarkable solvatofluorochromism. New J Chem 2017;41:13760–72. doi:10.1039/C7NJ03142D. [29] Safir Filho M, Dao P, Gesson M, Martin AR, Benhida R. Development of highly sensitive fluorescent probes for the
detection of β-galactosidase activity – application to the real-time monitoring of senescence in live cells. Analyst 2018;143:2680–8. doi:10.1039/C8AN00516H.
[30] Remaining UV-Vis absorption and fluorescence emission spectra are presented in the SI file (Fig. S1).
[31] Baladi T, Granzhan A, Piguel S. Microwave-Assisted C-2 Direct Alkenylation of Imidazo[4,5-b]pyridines: Access to Fluorescent Purine Isosteres with Remarkably Large Stokes Shifts. Eur J Org Chem 2016;2016:2421–34.
doi:10.1002/ejoc.201600166.
[32] Mata G, Luedtke NW. Synthesis and solvatochromic fluorescence of biaryl pyrimidine nucleosides. Org Lett 2013;15:2462–5. doi:10.1021/ol400930s.
[33] Estimated using ChemBioDraw 15.0.
[34] Horobin RW, Rashid-Doubell F, Pediani JD, Milligan G. Predicting small molecule fluorescent probe localization in living cells using QSAR modeling. 1. Overview and models for probes of structure, properties and function in single cells. Biotech Histochem 2013;88:440–60. doi:10.3109/10520295.2013.780634.
[35] Rohwedder A, Zhang Q, Rudge SA, Wakelam MJO. Lipid droplet formation in response to oleic acid in Huh-7 cells is mediated by the fatty acid receptor FFAR4. J Cell Sci 2014;127:3104–15. doi:10.1242/jcs.145854.
[36] Würth C, Grabolle M, Pauli J, Spieles M, Resch-genger U. Relative and absolute determination of fluorescence quantum yields of transparent samples. Nat Protoc 2013;8:1535–50. doi:10.1038/nprot.2013.087.
[37] Fulmer GR, Miller AJM, Sherden NH, Gottlieb HE, Nudelman A, Stoltz BM, et al. NMR chemical shifts of trace impurities: Common laboratory solvents, organics, and gases in deuterated solvents relevant to the organometallic chemist. Organometallics 2010;29:2176–9. doi:10.1021/om100106e.
![Figure 1. General structure of the benzothiazole-based styryl fluorophores previously reported by our group.[28,29]](https://thumb-eu.123doks.com/thumbv2/123doknet/13528299.417630/3.892.57.399.932.1081/figure-general-structure-benzothiazole-styryl-fluorophores-previously-reported.webp)