HAL Id: hal-00800273
https://hal.inria.fr/hal-00800273
Submitted on 13 Mar 2013
HAL is a multi-disciplinary open access
archive for the deposit and dissemination of
sci-entific research documents, whether they are
pub-lished or not. The documents may come from
teaching and research institutions in France or
abroad, or from public or private research centers.
L’archive ouverte pluridisciplinaire HAL, est
destinée au dépôt et à la diffusion de documents
scientifiques de niveau recherche, publiés ou non,
émanant des établissements d’enseignement et de
recherche français ou étrangers, des laboratoires
publics ou privés.
Julio Araujo, Frédéric Giroire, Yaning Liu, Remigiusz Modrzejewski, Joanna
Moulierac
To cite this version:
Julio Araujo, Frédéric Giroire, Yaning Liu, Remigiusz Modrzejewski, Joanna Moulierac. Energy
Efficient Content Distribution. IEEE International Conference on Communications (ICC), Jun 2013,
Budapest, Hungary. pp.4233-4238, �10.1109/ICC.2013.6655228�. �hal-00800273�
Energy Efficient Content Distribution
Julio Araujo
1,2, Fr´ed´eric Giroire
1, Yaning Liu
3, Remigiusz Modrzejewski
1and Joanna Moulierac
11
MASCOTTE joint project INRIA / I3S (CNRS, Univ. of Nice-Sophia), France
2ParGO Research Group - Universidade Federal do Cear´a - UFC, Brazil
3JCP-Consult, France
Abstract—To optimize energy efficiency in network, operators try to switch off as many network devices as possible. Recently, there is a trend to introduce content caches as an inherent capacity of network equipment, with the objective of improving the efficiency of content distribution and reducing network congestion. In this work, we study the impact of using in-network caches and content delivery network (CDN) cooperation on an energy-efficient routing. We formulate this problem as Energy Efficient Content Distribution. The objective is to find a feasible routing, so that the total energy consumption of the network is minimized subject to satisfying all the demands and link capacity. We exhibit the range of parameters (size of caches, popularity of content, demand intensity, etc.) for which caches are useful. Experimental results show that by placing a cache on each backbone router to store the most popular content, along with well choosing the best content provider server for each demand to a CDN, we can save a total up to 23% of power in the backbone, while 16% can be gained solely thanks to caches. Index Terms—Energy Efficiency, Integer Linear Programming, Content Delivery Network, In-network Caching, Future Internet.
I. INTRODUCTION
Energy efficiency of networking systems is a growing concern, due to both increasing energy costs and worries about CO2 emissions. In [1] it is reported that Information and
Communication Technology sector is responsible for up to 10% of global energy consumption. 51% of that is attributed to telecommunication infrastructure and data centers. Thus, saving power there is important. Backbone network operators study the deployment of energy-efficient routing solutions. The general principle is to aggregate traffic in order to be able to turn off a maximum number of devices [2]–[5].
On the other hand, in order to reduce network load and improve quality of service, content providers and network operators try to disaggregate traffic by replicating their data in several points of the networks, reducing the distance between this data and their users. Recent years have seen, along the growing popularity of video over Internet, a huge raise of traffic served by Content Delivery Networks (CDNs). These kinds of networks operate by replicating the content among its servers and serving it to the end users from the nearest one. CDNs deliver nowadays a large part of the total Internet traffic: estimation ranges from 15% to 30% of all Web traffic
Supported by Conselho Nacional de Desenvolvimento Cient´ıfico e Tec-nol´ogico, Brazil, under postdoctoral fellowship PDE 202049/2012-4.
The research leading to these results has received partial funding from the European Union’s Seventh Framework Programme (FP7/2007-2013) under grant agreements no 317762 (COMBO) and no 287975 (SocialSensor)
Supported by region PACA.
worldwide for the single most popular CDN [6]. Chiaraviglio et al. [7], [8] have shown how the choice of CDN servers impacts the backbone energy consumption. More precisely, they aim at turning off network devices by choosing, for each demand from a client to a content provider, the best server of this CDN while being energy aware.
Here, we go further on this idea by also considering the usage of caches on each of backbone routers, while still taking into account the choice of CDN servers. It is important to mention that there have been several proposals for developing global caching systems [9], in particular recently using in-network storage and content-oriented routing to improve the efficiency of content distribution by future Internet architec-tures [10]–[12]. Among these studies, we mention that in this paper we do not assume any specific technology for future Internet architectures, nor anything else that would require major overhaul of how the Internet works. Thus, there is no content routing among our caches. We assume that a cache serves a single city, taking all of its contents from the original provider. We consider that caches use energy and can be turned on or off. Thus, there is a trade-off between the energy savings they allow, by reducing network load, and their own consumption.
We propose an Integer Linear Programming (ILP) for-mulation to reduce energy consumption by using caches and properly choosing content provider servers, for each demand. We implemented this formulation on the ILP solver CPLEX version 12 and made experiments on real, taken from SNDlib [13], and random, Erd˝os-R´enyi [14], network topologies. We study the impact of different parameters: size of caches, demand intensity, network size, etc. In particular, we found that almost maximal energy gain can be achieved, in our scenarios, by caches of the order of 1 TB. Larger caches do not lead to significantly better gains. We discuss the increase of cache usage with network size. Experimental results show potential energy savings of about 20% by putting devices to sleep outside peak hours; introducing CDN to the network without caches gives 16% savings; introducing caches to network without CDN also gives around 16% savings.
The main take away of our work is thus that by storing the most popular content in caches at each router and by choosing the best content provider server we may save a total 23% of power in the backbone.
The paper is organized as follows. We discuss the related work in Section II. We present the problem and its formula-tion in Secformula-tion III. Section IV describes how we built the instances used in the experimentations. Finally, we present the experiments we did and discuss the results in Section V.
II. RELATEDWORK
Reducing energy consumption of the backbone network has been approached before multiple times. A model where it was achieved by shutting down individual links is studied in [5]. An interesting way of performing this in a distributed manner is shown in [4]. Energy efficient CDNs have also been studied recently. Authors in [15] propose to reduce energy consumption in CDN networks by turning off CDN servers through considering user SLAs. In order to optimize the power consumption of content servers in large-scale content distribution platforms across multiple ISP domains, a strategy is proposed in [16] to put servers into sleep without impact on content service capability. Our work is different from these works, since they do not consider in-network caches.
Network caches have been used in global caching sys-tems [9]. In recent years, several Information Centric Net-working architectures, such as Cache and Forward Network (CNF) [10], Content Centric Networking (CCN) [12] and NetInf [11], have exploited in-network caching. Their objec-tives are to explore new network architectures and protocols to support future content-oriented services. Caching schemes have been investigated in these new Internet architectures [10], [17], [18]. Similar to our work, these works also use in-network caches, however they do not consider energy savings. Energy efficiency in content-oriented architectures [19]– [21] with an in-network caching has been studied recently. In [19], authors analyze the energy benefit of using CCN by comparison to CDN networks. A further work [21] con-sidering the impact of different memory technologies on energy consumption is studied. Adding network caches that work transparently with current Internet architecture has been studied, with linear power models, in [22], where caches are added to backbone routers and in [23], where it is found that optimal placement during peak hours is in the access network. These works focus on the energy efficiency considering data delivery and storage, however, they do not take into account the energy savings by turning on/off network links. Authors in [20] extend GreenTE [2] to achieve a power-aware traffic engineering in CCN network. It is different from our work, since we consider energy consumption of in-network caches that could be turned on or off, as well as a cooperation between network operators and content providers.
Most closely related to ours is the work from Chiaraviglio et al. [7], [8], which enables the cooperation between network operators and content providers, to optimize the total energy consumption by an ILP formulation for both sides. In this paper, we also consider this cooperation to achieve such a total energy saving. Our work is an extension of this optimization problem formulation, through considering in-network caching.
III. PROBLEMMODELING
What follows in this section is a discussion of model parameters, formal problem definition and a Mixed Integer Linear formulation used to solve it.
A. Parameters
For in-network caches, it is still an open question: if and how they will be deployed. Therefore, we try to avoid making
1010 1011 1012 1013 1014
Cache size [bytes] 0 10 20 30 40 50 60 70 80 Cac he hit rate [%] LRU Static
Fig. 1: Cache hit ratio for YouTube trace, assuming average video size 100MB, following the results in [24].
specific assumptions about the details. Once the question is answered, the model can be updated to answer any possible specific concerns. Conclusions can change if the actual param-eters vary heavily from our estimates.
a) Cache hit rate: A cache, located in each router, automatically caches the most popular content, potentially saving a fraction of any demand. Establishing this fraction is a non-trivial task. According to [24], content popularity follows a Zipf-like distribution. In their study, they computed the relation between cache size and hit rate for a trace of traffic towards YouTube. Note that this relation does not depend on the number of cache accesses, only on the relative size of the cache and all the content collection. This relation is shown on Figure 1, with the assumption that an average video is 100 megabytes. The figure shows results for two algorithms: least recently used, a classic cache algorithm, and static most popular, a simple algorithm proposed by the authors. For example with a cache of around 800GB the expected hit rate is around 17.7% using LRU and around 32.5% using the static algorithm, thus saving an equivalent fraction of traffic.
As the situation changes frequently, both regarding to the volume of popular content and available storage, we leave this fraction as a parameter of the model: α – the maximal part of any demand that can be served from a cache. Network oper-ator can establish it empirically, by means of measurements. Typically, we take α ∈ [0.2, 0.35].
b) Cache power usage: In our model we deal with two types of equipment: links and caches. In practice, main energy drain of links are port cards and amplifiers. As can be seen in Powerlib [25], power requirements of single port cards suitable for long haul networks are well over 100 Watts, while other backbone cards can be as few as a quarter of that. For the caches, the main concern is fast mass storage. This has improved recently, with current SSD models offering 1TB of storage accessed at 10Gbps consuming below 10 Watts of power, for example [26].
Again, as the practical values in the time of implementation are hard to predict, we make this ratio another parameter of the model: β – power consumption of a cache divided by power consumption of a link. Typically we take β ∈ [0.1, 1]. B. Problem definition
We use a typical model, from the perspective of a backbone provider, where aggregated traffic between cities is expressed as a demand matrix. We augment this matrix to represent not
only cities, but also content providers. This is motivated by the fact that content providers generate traffic that can easily be equal to that of a city.
Let us first formally define the optimization problem we are dealing with. We call it ENERGY EFFICIENT CONTENT
DISTRIBUTION. In this problem, we model the network by a graph G = (V, E), for which we have a link capacity function c : E → R+and city to city demands ˜Dts, ∀s, t ∈ V .
Moreover, we are given a set of content providers P . For each content provider p ∈ P , the subset of vertices of V (G) containing its servers is given by the function Lp ⊆ V (G).
Each server placed in location l ∈ Lp of a content provider
p has a capacity C(sl
p). We are also given demands from
cities to content providers given by the function ˜Dps, for every
s ∈ V, p ∈ P . We consider that the data is replicated at each node of Lp. Finally, each node v ∈ V (G) in the network has
a cache of bandwidth capacity b(v).
The goal of our problem is to find a feasible routing in G satisfying all the demands ˜Dt
sand ˜D p
sunder the capacity
con-straints c(u, v), C(slp) and b(v) that minimizes the total energy consumption of the network. By total energy consumption, we mean the energy used by the links plus the energy used by the caches. For each cache, despite of a fixed energy cost of turning it on, we also consider an increased usage of energy in terms of its load.
C. Mixed Integer Linear Programming Formulation
First recall that our goal is to turn off links and caches in order to minimize the amount of energy used in the underlying network. Consequently, we use a variable xuvto indicate if the
link uv is turned on or off, for every {u, v} ∈ E. The model is normalized as to say that every link uses 1 unit of energy. We denote this unit lc. We use a variable yvto indicate if the cache
at router v is turned on or off, for every v ∈ V . We say that a cache uses at most β units of energy. Finally, we recognize that mass memory access can constitute a significant energy cost. Thus, we use a variable zv to indicate the load (fraction
of used bandwidth) of the cache in router v. We assume that an idle cache uses fraction γ of β and its power consumption grows linearly with load to reach β once fully utilized. The objective function is then written formally as:
min X {u,v}∈E xuv+ X v∈V βγyv+ X v∈V β(1 − γ)zv.
Denote ˜D and ˜D as the demands posed in the problem instance, respectively from other cities and content providers. A cache in a source router s, when turned on, allows to save a portion of any demand up to α, call these savings respectively C and C. We will consider reduced demands, denoted D and D, which are the input demands with the caching savings subtracted: Dt s= ˜D t s− C t s , ∀s, t ∈ V, Cst≤ α ˜D t s , ∀s, t ∈ V, Dps= ˜Dps− Cp s , ∀s ∈ V, p ∈ P, Cps≤ α ˜Dps , ∀s ∈ V, p ∈ P.
Then, we record the load of the cache: X t Ct s+ X p Cps= zsb(s) , ∀s, t ∈ V, ∀p ∈ P.
Finally, the load cannot exceed the capacity and needs to be zero if cache is off:
zs≤ ys , ∀s ∈ V.
Each possible source s ∈ V demands from each provider p ∈ P an amount of data flow Dps≥ 0. The provider has a set
of servers of slp located in a subset of nodes of the network
l ∈ Lp ⊆ V . Each of those servers sends Sl,sp flow units, to
collectively satisfy the demand: X
l∈Lp
Sl,sp = Dps , ∀s ∈ V, p ∈ P. Each server sl
p has a constrained capacity C(slp), which
limits the demands it can satisfy: X
s∈V
Sl,sp ≤ C(sl
p) , ∀p ∈ P, l ∈ Lp.
Now we set flow constraints. By fu,vs we denote the flow
on edge {u, v} corresponding to demands originating from s. X v∈Nu fv,us − X z∈Nu fu,zs = = ( −P p∈PD p s− P t∈V D t s u = s Du s+ P {p∈P |u∈Lp}S u,s p otherwise , ∀s, u ∈ V. Finally we consider capacities of links, denoted c(uv). The constraints involve both kinds of flows and the on/off status of the links:
X
s∈V
(fu,vs + f s
v,u)+ ≤ c(uv)xuv , ∀{u, v} ∈ L.
All variables are non-negative real numbers, except for xuv
and yv which admit only values in {0, 1}.
IV. INSTANCE GENERATION
The Survivable fixed telecommunication Network Design (SND) Library contains a set of real network topologies, which we use as a base for most of our instances. In particular, we have decided to use three networks:
• Atlanta – |V | = 15, |E| = 22, unidentifiable cities • Nobel-EU – |V | = 28, |E| = 41, major European cities • Germany50– |V | = 50, |E| = 88, major German cities We added the position of the Content Distribution Network servers. Usually, Content Distribution Networks locate their servers in Internet Exchanges and major Points of Presence, to minimize the network distance to the end users. Locations of such points are publicly known. Thus, for topologies with clearly identifiable cities, we have ready sets of candidate locations for CDN servers. Otherwise, we put them manually at cities which minimize the route lengths.
We used a population model to build the traffic matrices of the demands between cities. Then, we augmented matrices with the demands towards content providers. Obtaining exact
CDN1 40 0.3 Berlin Hamburg Duesseldorf Frankfurt Muenchen Nuernberg CDN2 20 0.45 Berlin Duesseldorf Frankfurt Muenchen
CDN3 15 0.6 Berlin Frankfurt
CDN4 15 0.5 Hamburg Frankfurt Muenchen
CDN5 10 0.2 Berlin Duesseldorf Frankfurt Hamburg Muenchen Nuernberg Osnabrueck
TABLE I: Content Distribution Networks assumed for the germany50 network. figures about CDN market shares and operational details is out
of scope of this study. Still, we explored the publicly available information to come up with a list of the major providers. Each of the networks is assigned a popularity, which is based on market share either claimed by the company or media. The number of servers is heterogeneous and we try to arrange it into distinct classes in regard to popularity/server capacity proportion, i.e. there can be networks with many small servers, or few strong ones.
Table I exemplifies CDN specification used in the ger-many50 network. Server capacity means what part of total demand towards a network can be satisfied by the infrastruc-ture in a single location. For example, just two servers with capacity 0.5 can satisfy all demands towards CDN4.
A more detailed description of the instance generation can be found in the research report [27].
V. EMPIRICAL RESULTS
We implemented the formulation on the ILP solver CPLEX version 12. For large networks, we set a limit on the execution time to five minutes per instance. This section summarizes the empirical results obtained by solving our model, explains the impact of the parameters and shows the potential energy savings. Note that, as described in section III-C, energy consumption is given in normalized energy units equal to energy used by one link, denoted lc.
A. Cache parameters
In this section, we exemplify the impact of parameters of the cache. We look into how the obtained network designs differ on changing values of the cache hit rate α and of the cache power usage β. Due to lack of space, results are given here for the germany50 network. Similar results on different networks can be found in [27].
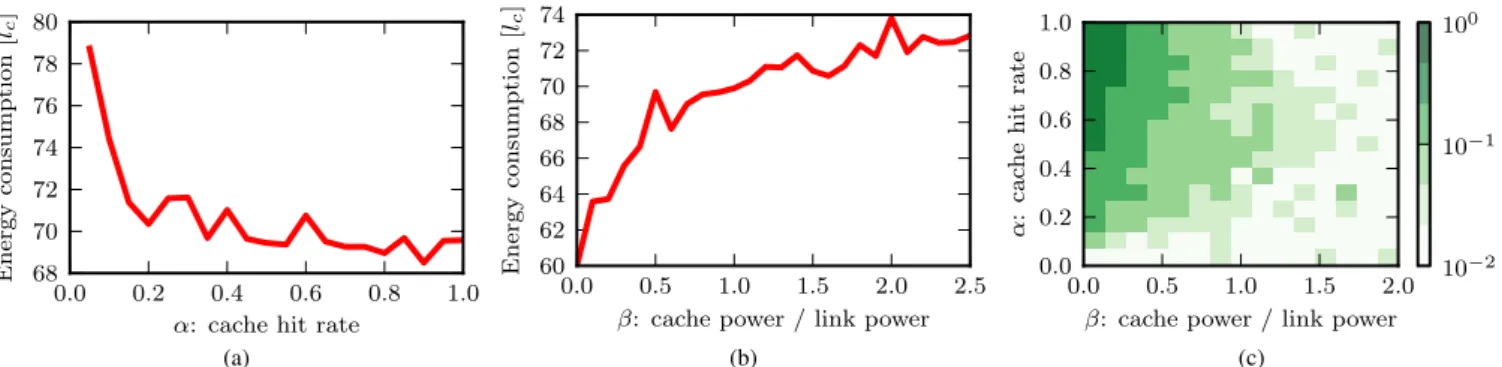
First, we look at the effects of changing the parameter α, shown in Figure 2a. Recall, that it limits what part of any single demand can be served from a cache. Increasing the significance of caches results in more being used and energy being saved. However, note that once about 15% of traffic can be cached, further gains are highly diminished. This, according to Section III-A0a, is equivalent to about 800GB or just 100GB depending on the cache algorithm used.
Figure 2b shows the effects of changing maximum cache power usage, β. As we can see, when the caches use no energy, the network uses 60 units of power. Then it raises, through 63.4 for β = 0.1, to 69.7 for β = 0.5. After this point, further increases to β have little effect, not increasing past 74. This is because at this point caches simply get turned off as they consume too much energy.
Figure 2c shows combined effects of both parameters. The demands in it have been slightly reduced, to make routing without caches feasible. Then, a baseline power consumption has been established with caches disabled to be 71. For each pair of parameters energy savings, relative to that baseline, are mapped to a color and displayed in appropriate region of the figure. The darker the color the higher the savings.
B. CDN parameters
Then, we investigate the impact of the cooperation with CDN, shown on Figure 3. Plot 3a shows the evolution of energy consumption in function of what part of all demands are directed towards CDN networks. The traffic has been reduced for this plot to make routing without caches nor cooperating content providers feasible. Results both with and without caches are compared. As we can see, introducing cooperating content providers to a network without caches is highly beneficial. In the idealized case when all traffic would be served by CDNs, energy consumption would decrease by 27.4%. At today’s claimed values this number is still 16.4%. Then, introducing caches to a network without CDN gives 16.7% savings. There remain 8.0% savings at today’s CDN popularity. What may be a bit surprising, there are still 6.6% savings by introducing caches when 100% of traffic is served by the Content Delivery Networks. Finally, comparing network without CDN nor caches, to network with 50% of traffic served by CDN and with enabled caches, we save 23.12% of energy.
Plot 3b investigates how many location choices are needed to achieve good savings. In this scenario, for the sake of clarity, there is only one CDN. Its servers are potentially located in: Berlin, Frankfurt, Muenchen, Hamburg, Dortmund, Stuttgart, Leipzig and Aachen. In each data point, only the first n servers from this list are enabled. Each server is able to provide all the demands alone, 50% of all traffic is served by the CDN. It is infeasible to route with less than 3 locations. As we can see, increasing the number of possible choices from 3 to 5 yields around 13% of energy savings. Further increases have little effect. Thus, it is optimal to have 5 server locations in this network of 50 cities.
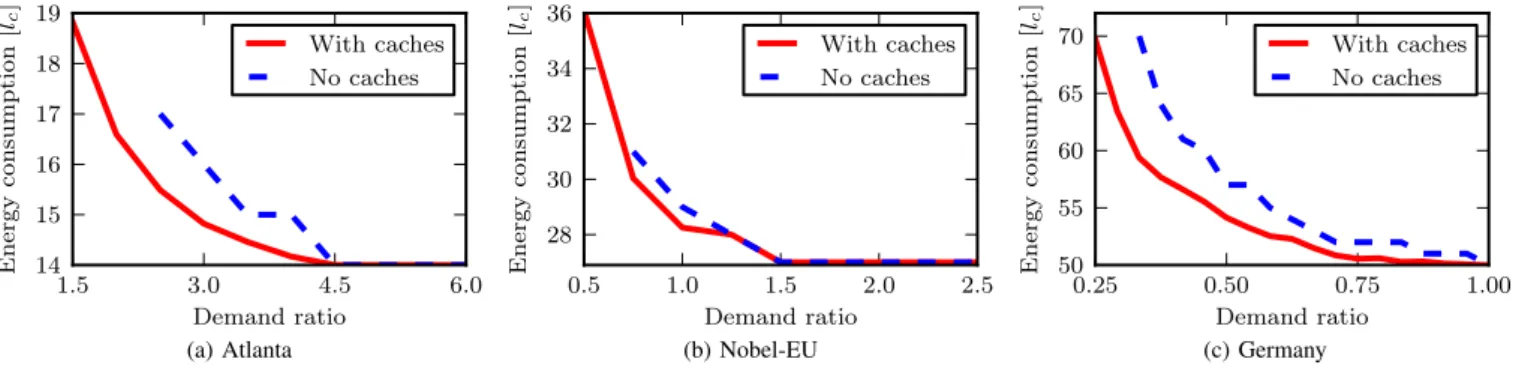
C. Impact of traffic level
In this section, we look into the potential reduction of energy consumption of the networks in our model, both with and without usage of the caches, exploiting the variance in network traffic over time. The parameters are: α = 0.35, β = 0.1 and cache bandwidth is half of a link.
Figure 4 shows energy consumption in function of demand ratio, that is the inverse of traffic level. As we can see, in all the networks, enabling caches makes routing feasible under
0.0 0.2 0.4 0.6 0.8 1.0 α: cache hit rate
68 70 72 74 76 78 80 Energy consumption [lc ] (a) 0.0 0.5 1.0 1.5 2.0 2.5 β: cache power / link power 60 62 64 66 68 70 72 74 Energy consumption [lc ] (b) 0.0 0.5 1.0 1.5 2.0 β: cache power / link power 0.0 0.2 0.4 0.6 0.8 1.0 α : cac he hit rate 10−2 10−1 100 (c)
Fig. 2: Energy consumption in network designs obtained by model with different parameters.
0.0 0.2 0.4 0.6 0.8 1.0 Part of demands towards CDN 50 55 60 65 70 75 Energy consumption [lc ] With caches No caches
(a) In function of CDN popularity.
1 2 3 4 5 6 7 8 CDN server locations 72 74 76 78 80 82 84 Energy consumption [lc ]
(b) In function of server location cardinality.
Fig. 3: Total energy consumption varied by CDN properties. much higher loads than before. For example in the case of Germany, we can accommodate an increase in demands by one third. Then, as traffic decreases, we can save energy by turning off some devices. The right column of Table II states relative difference between energy consumption of a network under highest possible load and half of that load, with caches enabled.
For a range of demand values, it is feasible to route without caches, but at a higher total energy cost. Note that half of maximum sustainable load is in all cases within this range. The left column of Table II shows the highest difference of power consumption accommodating the same traffic with and without caches.
As can be seen, there is a point after which there are no additional savings with falling traffic. This is when the routing is feasible on a spanning tree, using no caches. Turning off any additional device would disconnect the network.
What is interesting is the fact that caches have a much higher effect in the germany50 than the smaller instances. We attribute that to longer routes, which mean higher energy cost to transfer the data through the network. This effect is
Network Nodes count
Maximum energy saved due to caches
Total energy savings (load=50%)
Atlanta 15 8.9% 21.3% Nobel-EU 28 3.2% 21.7% Germany 50 16.7% 22.3%
TABLE II: Potential energy savings investigated in Section V-D.
D. Impact of network size
We have seen different usage of caches in different net-works. There is an explanation for that. First note that energy savings of serving from cache depend on how long would be the route traversed by the data if it was served from the network. Then, in the biggest network we used, the germany50 the average route length is only 4. We claim that in bigger networks we could see higher utility of caches.
To estimate the impact of route length, we look into results on Erd˝os-R´enyi graphs. Recall that in these graphs, the route lengths grow logarithmically in respect to the graph size. As we need many big networks to demonstrate the effect, obtaining integer solutions would be impractical. Therefore, the results presented are for a fractional relaxation of the model.
Figure 5 shows the number of caches used divided by the number of cities in two-connected Erd˝os-R´enyi graphs of increasing sizes. The average degree of each graph is 4, each city emits 7 demands to random other cities, cache parameters are α = 0.5, β = 1.0 and γ = 0.5. Each data point is an average over 200 instances, error bars represent standard deviation.
As we can see, with no other parameters changing, usage of caches clearly grows with increasing network sizes. In a network of size 20, having average route length around 2.3, average cache usage is only 7.7%, while in networks of size 320, of average route length around 4.5, it is 80.3%. Caches see an average usage over 50% for networks of size at least 160, where the average route length is only around 3.9. This size can correspond to real networks comprised of both core and metropolitan parts.
VI. CONCLUSIONS AND FURTHER RESEARCH
We have proposed a new model for saving energy in back-bone networks by disabling equipment, taking into account in-router caches. It has been validated by solving instances based
1.5 3.0 4.5 6.0 Demand ratio 14 15 16 17 18 19 Energy consumption [lc ] With caches No caches (a) Atlanta 0.5 1.0 1.5 2.0 2.5 Demand ratio 28 30 32 34 36 Energy consumption [lc ] With caches No caches (b) Nobel-EU 0.25 0.50 0.75 1.00 Demand ratio 50 55 60 65 70 Energy consumption [lc ] With caches No caches (c) Germany
Fig. 4: Comparison of energy consumption with and without caches in the model.
0 50 100 150 200 250 300 350 Number of nodes 0.0 0.1 0.2 0.3 0.4 0.5 0.6 0.7 0.8 0.9 Cac hes / Size
Fig. 5: Cache usage divided by network size for Erd˝os-R´enyi graphs.
on real network topologies. The total energy savings found oscillate about 25% for realistic parameters. Part of energy saved solely due to introduction of caches is up to 16% in our instances.
In future work, the model can be extended by enabling shar-ing a sshar-ingle cache between multiple cities. Another interestshar-ing direction is modelling the problem from perspective of content provider. We can also look at different network architectures. This work considered only the backbone. A next step could be introducing access networks, leading to larger instances. As the savings due to caches grow with network size, they should be substantially higher in this case. This could also motivate study of new mechanisms, e.g. layered caching.
REFERENCES
[1] M. Webb, “Smart 2020: Enabling the low carbon economy in the information age,” The Climate Group London, 2008.
[2] M. Zhang, C. Yi, B. Liu, and B. Zhang, “Greente: Power-aware traffic engineering,” in ICNP’10: IEEE International Conference on Network Protocols, 2010.
[3] L. Chiaraviglio, M. Mellia, and F. Neri, “Minimizing isp network energy cost: Formulation and solutions,” IEEE/ACM Transactions on Networking, vol. 20, pp. 463–476, April 2011.
[4] A. P. Bianzino, L. Chiaraviglio, M. Mellia, and J.-L. Rougier, “Grida: Green distributed algorithm for energy-efficient ip backbone networks,” Computer Networks, vol. 56, no. 14, pp. 3219–3232, August 2012. [5] F. Giroire, D. Mazauric, and J. Moulierac, “Energy efficient routing by
switching-off network interfaces,” Energy-Aware Systems and Network-ing for Sustainable Initiatives, p. 207, 2012.
[6] Akamai. [Online]. Available: http://www.akamai.com/html/riverbed/ akamai internet.html
[7] L. Chiaraviglio and I. Matta, “Greencoop: Cooperative green routing with energy-efficient servers,” in First International Conference on Energy-Efficient Computing and Networking (e-Energy), April 2010. [8] ——, “An energy-aware distributed approach for content and network
management,” in IEEE Conference on Computer Communications Work-shops (INFOCOM WKSHPS), April 2011, pp. 337 –342.
[9] E. J. Rosensweig and J. Kurose, “Breadcrumbs: Efficient, best-effort content location in cache networks,” in IEEE INFOCOM, April 2009, pp. 2631 –2635.
[10] S. Paul, R. Yates, D. Raychaudhuri, and J. Kurose, “The cache-and-forward network architecture for efficient mobile content delivery services in the future internet,” in Innovations in NGN: Future Network and Services, May 2008, pp. 367 –374.
[11] C. Dannewitz, “Netinf: An information-centric design for the future internet,” in Proceedings of 3rd GI/ITG KuVS Workshop on The Future Internet, May 2009.
[12] V. Jacobson, D. K. Smetters, J. D. Thornton, M. F. Plass, N. H. Briggs, and R. L. Braynard, “Networking named content,” in Proceedings of ACM CoNEXT, December 2009.
[13] SNDLib. [Online]. Available: http://sndlib.zib.de
[14] P. Erd˝os and A. R´enyi, “On the evolution of random graphs,” in Publication of The Mathematical Institute of The Hungarian Academy of Sciences, 1960, pp. 17–61.
[15] V. Mathew, R. K. Sitaraman, and P. Shenoy, “Energy-aware load bal-ancing in content delivery networks,” in Proceedings IEEE INFOCOM, March 2012, pp. 954 –962.
[16] C. Ge, N. Wang, and Z. Sun, “Optimizing server power consumption in cross-domain content distribution infrastructures,” in IEEE International Conference on Communications Workshops (ICC), June 2012. [17] Z. Li, G. Simon, and A. Gravey, “Caching policies for in-network
caching,” in 21st International Conference on Computer Communica-tions and Networks (ICCCN), August 2012, pp. 1 –7.
[18] I. Psaras, W. K. Chai, and G. Pavlou, “Probabilistic in-network caching for information-centric networks,” in Proceedings of the second edition of the ICN workshop on Information-centric networking (ICN). ACM, 2012, pp. 55–60.
[19] K. Guan, G. Atkinson, D. C. Kilper, and E. Gulsen, “On the energy efficiency of content delivery architectures,” in IEEE International Conference on Communications Workshops (ICC), june 2011, pp. 1–6. [20] Y. Song, M. Liu, and Y. Wang, “Power-aware traffic engineering with named data networking,” in Seventh International Conference on Mobile Ad-hoc and Sensor Networks (MSN), Dec. 2011, pp. 289–296. [21] N. Choi, K. Guan, D. C. Kilper, and G. Atkinson, “In-network caching
effect on optimal energy consumption in content-centric networking,” in IEEE International Conference on Communications Workshops (ICC), June 2012.
[22] U. Mandal, C. Lange, A. Gladisch, P. Chowdhury, and B. Mukherjee, “Energy-efficient content distribution over telecom network infrastruc-ture,” in Transparent Optical Networks (ICTON), 2011 13th Interna-tional Conference on. IEEE, 2011, pp. 1–4.
[23] C. Jayasundara, A. Nirmalathas, E. Wong, and C. A. Chan, “Energy efficient content distribution for vod services,” in Optical Fiber Com-munication Conference. Optical Society of America, 2011.
[24] G. Haßlinger and O. Hohlfeld, “Efficiency of caches for content dis-tribution on the internet,” in Teletraffic Congress (ITC), 2010 22nd International. IEEE, 2010, pp. 1–8.
[25] W. Van Heddeghem and F. Idzikowski, “Equipment power consumption in optical multilayer networks-source data,” Technical Report IBCN-12-001-01 (January 2012), available at http://powerlib. intec. ugent. be, Tech. Rep., 2012.
[26] OCZ Technology Group. [Online]. Available: http://www.ocztechnology. com/ocz-revodrive-3-x2-pci-express-ssd.html
[27] J. Araujo, F. Giroire, Y. Liu, R. Modrzejewski, and J. Moulierac, “Energy efficient content distribution,” INRIA, Research Report RR-8091, 10 2012.
![Fig. 1: Cache hit ratio for YouTube trace, assuming average video size 100MB, following the results in [24].](https://thumb-eu.123doks.com/thumbv2/123doknet/13462987.411828/3.892.519.765.78.242/cache-ratio-youtube-trace-assuming-average-following-results.webp)