HAL Id: hal-01410203
https://hal.sorbonne-universite.fr/hal-01410203
Submitted on 6 Dec 2016
HAL is a multi-disciplinary open access
archive for the deposit and dissemination of
sci-entific research documents, whether they are
pub-lished or not. The documents may come from
teaching and research institutions in France or
abroad, or from public or private research centers.
L’archive ouverte pluridisciplinaire HAL, est
destinée au dépôt et à la diffusion de documents
scientifiques de niveau recherche, publiés ou non,
émanant des établissements d’enseignement et de
recherche français ou étrangers, des laboratoires
publics ou privés.
Distributed under a Creative Commons Attribution| 4.0 International License
the global ocean
Thomas Vannier, Jade Leconte, Yoann Seeleuthner, Samuel Mondy, Eric
Pelletier, Jean-Marc Aury, Colomban de Vargas, Michael Sieracki, Daniel
Iudicone, Daniel Vaulot, et al.
To cite this version:
Thomas Vannier, Jade Leconte, Yoann Seeleuthner, Samuel Mondy, Eric Pelletier, et al.. Survey of
the green picoalga Bathycoccus genomes in the global ocean. Scientific Reports, Nature Publishing
Group, 2016, 6, pp.37900. �10.1038/srep37900�. �hal-01410203�
Survey of the green picoalga
Bathycoccus genomes in the
global ocean
Thomas Vannier
1,2,3, Jade Leconte
1,2,3, Yoann Seeleuthner
1,2,3, Samuel Mondy
1,2,3,
Eric Pelletier
1,2,3, Jean-Marc Aury
1, Colomban de Vargas
4, Michael Sieracki
5,
Daniele Iudicone
6, Daniel Vaulot
4, Patrick Wincker
1,2,3& Olivier Jaillon
1,2,3Bathycoccus is a cosmopolitan green micro-alga belonging to the Mamiellophyceae, a class of
picophytoplankton that contains important contributors to oceanic primary production. A single species of Bathycoccus has been described while the existence of two ecotypes has been proposed based on metagenomic data. A genome is available for one strain corresponding to the described phenotype. We report a second genome assembly obtained by a single cell genomics approach corresponding to the second ecotype. The two Bathycoccus genomes are divergent enough to be unambiguously distinguishable in whole DNA metagenomic data although they possess identical sequence of the 18S rRNA gene including in the V9 region. Analysis of 122 global ocean whole DNA metagenome samples from the Tara-Oceans expedition reveals that populations of Bathycoccus that were previously identified by 18S rRNA V9 metabarcodes are only composed of these two genomes. Bathycoccus is relatively abundant and widely distributed in nutrient rich waters. The two genomes rarely co-occur and occupy distinct oceanic niches in particular with respect to depth. Metatranscriptomic data provide evidence for gain or loss of highly expressed genes in some samples, suggesting that the gene repertoire is modulated by environmental conditions.
Phytoplankton, comprising prokaryotes and eukaryotes, contribute to nearly half of the annual global primary production1. Picocyanobacteria of the genera Prochlorococcus and Synechococcus dominate the prokaryotic com-ponent2. However, small eukaryotes (picoeukaryotes; < 2 μ m) can be major contributors to primary produc-tion3,4. In contrast to cyanobacteria, the phylogenetic diversity of eukaryotic phytoplankton is wide, with species belonging to virtually all photosynthetic protist groups5. Among them, three genera of green algae belonging to the order Mamiellales (class Mamiellophyceae6), Micromonas, Ostreococcus and Bathycoccus are particularly important ecologically because they are found in a wide variety of oceanic ecosystems, from the poles to the trop-ics7–12. The cosmopolitan distribution of these genera raises the questions of their diversity and their adaptation to local environmental conditions. These genera exhibit genetic diversity: for example, there are at least three genetically different clades of Micromonas with different habitat preferences12,13. One ecotype of Micromonas seems to be restricted to polar waters8,14. Ostreococcus which is the smallest free-living eukaryotic cell known to date with a cell size of 0.8 μ m15 can be differentiated into at least four clades. Two Ostreococcus species have been formerly described: O. tauri and O. mediterreanus15,16. Among these Ostreococcus clades, different strains seem to be adapted to different light ranges17. However, the ecological preferences of Ostreococcus strains are probably more complex, implying other environmental parameters such as nutrients and temperature9.
The genus Bathycoccus was initially isolated at 100 m from the deep chlorophyll maximum (DCM) in the Mediterranean Sea18 and cells with the same morphology (body scales) had been reported previously from the Atlantic Ocean19. Bathycoccus has been since found to be widespread in the oceanic environment, in particular in coastal waters20,21, and one genome sequence from a coastal strain is available22. Metagenomic data have sug-gested the existence of two Bathycoccus ecotypes10,11,23, recently named B1 and B211. These two ecotypes have 1CEA - Institut de Génomique, GENOSCOPE, 2 rue Gaston Crémieux, 91057 Evry, France. 2CNRS, UMR 8030, CP5706
Evry, France. 3Université d’Evry, UMR 8030, CP5706 Evry, France. 4Sorbonne Universités, UPMC Université Paris
06, CNRS, UMR7144, Station Biologique de Roscoff, 29680 Roscoff, France. 5National Science Foundation, 4201
Wilson Blvd., Arlington, VA 22230, USA. 6Stazione Zoologica Anton Dohrn, Villa Comunale, 80121 Naples, Italy.
Correspondence and requests for materials should be addressed to P.W. (email: pwincker@genoscope.cns.fr). or O.J. (email: ojaillon@genoscope.cns.fr)
received: 28 April 2016 accepted: 03 November 2016 Published: 30 November 2016
identical 18S rRNA sequences and therefore cannot be discriminated when using metabarcodes such as the V4 or V9 regions of the 18S rRNA genes10. However information on the ocean-wide distribution and the ecological preferences of these two ecotypes are lacking.
Mapping of metagenomic reads onto whole genomes (fragment recruitment) has been shown to be an effi-cient way to assess the distribution of oceanic bacterial populations24,25. The paucity of eukaryotic genomes and metagenomes has prevented this approach to be applied on a large scale to eukaryotes. Therefore the determina-tion of the geographical distribudetermina-tion and ecological preferences of marine eukaryotic species has relied on the use of marker genes such as 18S rRNA or ITS (internal transcribed spacer)26 and more recently on metabarcodes27. One major problem is the absence of reference genomes for many marine eukaryotes as a consequence of the difficulty to cultivate them. To overcome this limitation, Single Cells Genomics is a very promising approach28,29. However, this approach has been largely used for bacteria30 and numerous technical challenges have limited the recovery of eukaryotic genomes with this approach28,31–33. The most complete assembly obtained so far is for an uncultured stramenopile belonging to the MAST-4 clade and contains about one third of the core eukaryotic gene set33. Recently, the Tara Oceans expedition collected water samples from the photic zone of hundreds of marine sites from all oceans and obtained physicochemical parameters, such as silicate, nitrate, phosphate, temperature and chlorophyll34–36. This expedition also led to the massive sequencing of the V9 region from 18S ribosomal gene providing a description of the eukaryotic plankton community over wide oceanic regions27. During this expedi-tion a large number of metagenomic data and single-cell amplified genomes (SAGs37) have also been acquired. Here, we introduce a novel genome assembly for Bathycoccus based on the sequence assembly of four SAGs obtained from a Tara Oceans sample collected in the Arabian Sea. Comparison of this assembly with the reference sequence of Bathycoccus strain RCC110522 unravels substantial genomic divergence. We investigated the geo-graphical distributions of these two genomes by mapping onto them the short reads of a large set of metagenomes obtained in multiple marine basins from the Tara Oceans survey35,38. We also determined the genomic properties and habitat preferences of these two Bathycoccus.
Results
Genome structure of Bathycoccus TOSAG39-1.
We obtained a new Bathycoccus SAG assembly (TOSAG39-1) by the single cell genomics approach from four single cells collected from a single sample dur-ing the Tara Oceans expedition. We presumed these cells were from the same population and combined their genomic sequences to improve the assembly. The length of the final combined-SAGs assembly is 10.3 Mb com-prising 2 345 scaffolds. Half of the assembled genome lies in 179 scaffolds longer than 13.6 kb (N50 size). This assembly covers an estimated 64% of the whole genome when considering the proportion of identified eukaryotic conserved genes39. We verified that this combined SAG assembly has longer cumulative size, and a larger rep-resentation of the genome than each assembly obtained from sequences of a single-SAG. We also merged the four assemblies from single-SAGs and, after removing redundancies, we obtained a substantially lower genomic rep-resentation than for the combined-SAGs strategy (Table 1). We mapped the reads of each SAG-sequencing onto the final assembly to examine whether genomic variability among the sampled population might have affected the quality of the assembly. We did not detect any major genomic variability; contigs can be formed by reads from different cells (Supplementary Figure S1). In total, half of the assembly (52.2%) was generated by reads from a single cell and one third (30.5%) by two cells.The approximate estimated genome size is 16 Mb and GC content is 47.2%, similar to what has been reported for RCC1105 (15 Mb and 48%, respectively). We predicted 6 157 genes (Supplementary Table 1), representing a higher gene density compared to RCC1105 (622 vs. 520 genes per Mb), probably because of the higher fragmen-tation of the SAG assembly (the coding base density is conversely higher in TOSAG39-1, 742 vs. 821 kb/Mb for the two assemblies, respectively, Supplementary Table 1). The photosynthetic capacity of TOSAG39-1, presumed from the chlorophyll autofluorescence in the cell sorting step, was verified by the presence of plastid contigs (removed during quality control filtering) and by the presence of nuclear photosynthetic gene families (encoding RuBisCo synthase, starch synthase, alternative oxidase and chlorophyll a/b binding proteins) in the final assembly.
Previous comparisons of Mamiellales genomes demonstrated global conservation of chromosomal locations of genes between Bathycoccus, Ostreococcus and Micromonas22. These genera all possess outlier chromosomes (one part of chromosome 14 and the entire chromosome 19 for Bathycoccus) that display an atypical GC% and numerous small, unknown, non-conserved genes. We detected almost perfect co-linearity between non-outlier
SAG Assembly Total Size (Mb) N50 (kb) NG501 (kb) Genome Completion (%)
A 3.5 14.8 NA 30.8 B 4.7 14.5 NA 27.7 C 3.7 24.1 NA 21.5 D 4.1 18.1 NA 26.0 (A) + (B) + (C) + (D)2 8.0 16.6 0.9 44.6 Combined ABCD3 10.1 14.1 6.0 64.0
Table 1. Assembly summaries of TOSAG39-1. 1The longest assembly contigs covering together half of the genome size (15 Mbp) are each longer than the NG50. This evaluation was not possible for the four individual cell assemblies for which the total assembly sizes are shorter than half of the genome size. 2A + B + C + D corresponds to a non-redundant merging of contigs from individual assemblies. 3Combined ABCD corresponds to the co-assembly process.
chromosomes of RCC1105 and orthologous regions of TOSAG39-1 scaffolds (Supplementary Figure S2). However, there is a significant evolutionary divergence between the genomes: the orthologous proteins are only 78% identical on average (Supplementary Figure S3). Only 26 genes are highly conserved (> 99% identity), they are distributed on 14 chromosomes (including outlier chromosome 14) and did not display any clustering. As expected, chromosome 19 did not fit this pattern: we could not align most of its genes by direct BLAST compar-ison. Some traces of homology were observed for nine genes (62% protein identity). One of the twenty longest scaffolds of TOSAG39-1 had characteristics similar to chromosome 19. This scaffold could not be aligned to RCC1105 and has the lowest GC content (0.44 vs. 0.48% for the other scaffolds on average).
Manual curation of alignments to analyze synteny along the twenty longest TOSAG39-1 scaffolds showed that 90% of genes are collinear between the two genomes, 5% are shared outside syntenic blocks, and 5% are specific to TOSAG39-1. The three rRNA genes (18S or small subunit (SSU), 5S, 23S or large subunit (LSU)), used as phyloge-netic markers in many studies, are identical between the two genomes. The SSU and LSU genes of TOSAG39-1 have introns. The SSU intron (440 bp) is at the same position as in RCC1105, but is only 91% similar. The LSU intron (435 bp) is only present in TOSAG39-1. The internal transcribed spacers (ITS) are different between the two TOSAG39-1 and the RCC1105 assemblies (82% and 86% for ITS1 and ITS2, respectively) but closer to those of two Bathycoccus oceanic strains from the Indian Ocean (RCC715 and RCC716) (Supplementary Figure S4) and of a metagenome from the Atlantic Ocean DCM40. We also looked at the plastid 16 S marker gene41 and to the PRP8 intein gene that has been proposed as markers for Bathycoccus10. The plastid 16 S sequences of the two Bathycoccus genomes share 92% identical nucleotides, and PRP8 is lacking from the TOSAG39-1 assembly.
We were able to determine the affiliation of three metagenomes23,40 containing Bathycoccus and two Bathycoccus transcriptomes of the MMETSP database42 (Supplementary Figures S5). Metagenomes T142 and T149 from the South East Pacific23 and transcriptome MMETSP1399 (strain CCMP1898, which is the type strain for Bathycoccus prasinos) correspond, or are closely related to RCC1105. The tropical Atlantic Ocean metage-nome40 and transcriptome MMETSP1460 (strain RCC716 from the Indian Ocean) correspond, or are closely related to TOSAG39-1. Direct amino acid BLAST43 comparison of TOSAG39-1 and RCC1105 versus metagen-omes T142 and T149 demonstrates the presence of additional genmetagen-omes in these samples that were obtained by flow cytometry sorting of natural picoplankton populations (Supplementary Figure S5).
Oceanic distribution of Bathycoccus genomes.
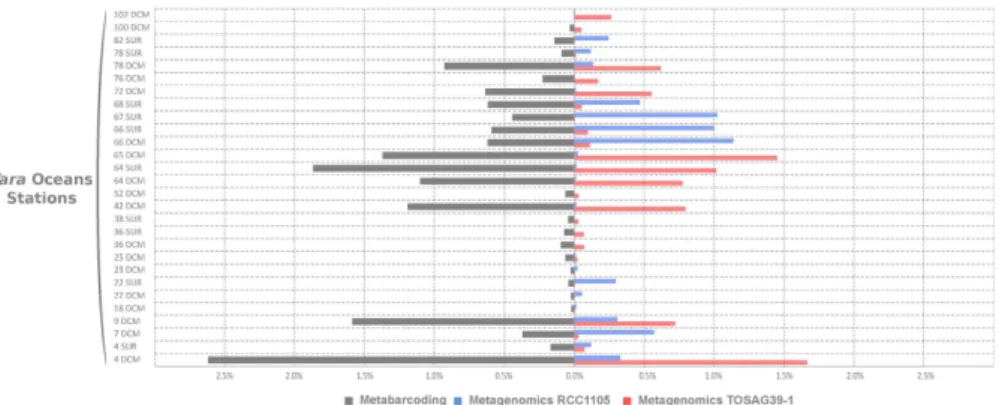
We analyzed the worldwide distribution of the two Bathycoccus genomes using metagenomic samples from the Tara Oceans expedition. Metagenomic short reads obtained from 122 samples taken at 76 sites and covering 24 oceanic provinces were mapped onto the two Bathycoccus genomes RCC1105 and TOSAG39-1. Among the four eukaryotic size fractions sampled in this expe-dition (0.8–5 μ m, 5–20 μ m, 20–180 μ m, 180–2000 μ m) statistically significant mapping was only obtained for the 0.8–5-μ m fraction, which matches the cellular size of Bathycoccus (1.5–2.5 μ m18). The percentage of filtered mapped metagenomic reads for every gene and station was used to estimate the relative genomic abundance of Bathycoccus. We compared final counts of genome abundances with counts based on amplicon sequences of the V9 region of the 18S rRNA gene27 which does not distinguish RCC1105 from TOSAG39–1 because their 18S rRNA gene sequences are identical. The V9 data demonstrated the wide distribution of Bathycoccus in marine waters, with maximum relative abundance reaching 2.6% of all reads. The Bathycoccus metabarcode was repre-sented by more than 1% of reads in 13% of the samples. Bathycoccus sequences were detected in whole metage-nome reads from the same samples where Bathycoccus was detected with 18S rRNA metabarcodes (Fig. 1). For each sample displaying a V9 signal, we detected the presence of the genomes of either RCC1105, TOSAG39-1, or both. In addition, the relative abundances estimated from V9 metabarcodes were correlated with the sum of the relative genomic abundances of TOSAG39-1 and RCC1105 (Supplementary Figure S6). Therefore, the Bathycoccus populations detected by the V9 metabarcode are likely to correspond to these two genomes only, and not to a third yet unknown genome.Figure 1. Comparisons of relative abundances of Bathycoccus in the 0.8–5 μm size fraction samples from
Tara Oceans stations. Left: relative 18S rRNA V9 amplicons abundance (percent of reads). Right: relative metagenomic abundances (percent of metagenomic reads) from direct mapping of metagenomic reads onto two genome sequence assemblies (strain RCC1105 and TOSAG39-1, single cell assembly from an Indian Ocean sample). Stations and depth (Surface or DCM) are indicated on the Y axis.
Among the 58 samples where Bathycoccus metagenomics abundances represented more than 0.01% of the total numbers of reads, in 91% of the cases a single genome was dominant, i.e. accounting for more than 70% of the reads. The two Bathycoccus showed similar proportions (i.e., between 40% and 60% of the reads) in only two samples (stations TARA_006 and TARA_150 at DCM, Supplementary Figure S7).
The global distribution of the two Bathycoccus genomes revealed complex patterns. The RCC1105 genome was found mainly in temperate waters, both at the surface and at the DCM, whereas TOSAG39-1 appeared more prevalent in tropical zones and at the DCM (Fig. 2). TOSAG39-1 was found in surface water in only five winter samples from the Agulhas and Gulf Stream regions at stations undergoing strong vertical mixing (Supplementary Table 2, Supplementary Figure S8). RCC1105 was detected more widely in surface water and was restricted to two narrow latitudinal bands around 40°S and 40°N. Conversely, TOSAG39-1 was found throughout a latitudinal range from 40°S to 39°N (Fig. 2). In particular, TOSAG39-1 was found in the tropical and subtropical regions in the Pacific, Atlantic and Indian Oceans.
In the equatorial and tropical Pacific Ocean, a region characterized by high nutrient and low chlorophyll where phytoplankton is limited by iron44, Bathycoccus was not detected (or only at very low abundance), except close to the Galapagos Islands. We detected opposite trends in the presence of the two Bathycoccus along the Gulf Stream: RCC1105 increased from west to east while TOSAG39-1 showed the reverse trend. The two Bathycoccus also showed opposite trends at some stations that were relatively close but located on both sides of important oceanographic boundaries. The first case was off South Africa, between stations TARA_065 and TARA_066 (Supplementary Figure S8) located, respectively, in coastal, temperate Atlantic and in Indian subtropical water from the Agulhas current45.
The second case occurred in winter in the North Atlantic, downstream of Cape Hatteras (US East coast), where station TARA_145 was in cold, nutrient-rich waters north of the northern boundary of the Gulf Stream (also called the Northern Wall for its sharp temperature gradient) and TARA_146 was south of the southern boundary, in the subtropical gyre (Fig. 2 and Supplementary Figure S8).
Figure 2. Geographical distribution of two Bathycoccus genomes, RCC1105 and TOSAG39-1, along Tara Oceans expedition stations from recruitments of metagenomic reads. Top and bottom maps correspond to
the surface and deep chlorophyll maximum (DCM) samples respectively. Gray crosses indicate Tara Oceans sampling stations and the sizes of the red or blue circles indicate the relative genomic abundances of the two Bathycoccus types. We generated this map using R-package maps_2.1-6, mapproj_1.1-8.3, gplots_2.8.0 and mapplots_1.4 (version R-2.13, https://cran.r-project.org/web/packages/maps/index.html).
Principal component analysis was used to assess the relationship between the genomic data and environmen-tal parameters determined in situ36 complemented by satellite and climatology data (Supplementary Information). Temperature, oxygen, sampling depth and PAR (photosynthetic active radiation), though with less significant p-values for the latter, were related to the segregation of the two genomes (Fig. 3 and Supplementary Figure S9). The two Bathycoccus were found in temperature ranges from 0 to 32 °C and from 7 to 28 °C for RCC1105 and TOSAG39-1, respectively. On average, the TOSAG39-1 genome was found in waters 3 °C warmer than was RCC1105 (21.5 vs. 18.4 °C, p-value < 10−3, Fig. 3 and Supplementary Figure S10). Abundances were very low below 13 °C for both genomes, and above 22 °C for RCC1105. A similar discrimination was observed for oxygen: TOSAG39-1 was found in samples with lower oxygen content. For example, the TOSAG39-1 genome was abun-dant in the DCM of station 138 where O2 was low (31.2 μ M, Fig. 3, Supplementary Figures S9 and S10), though no samples originated from anoxic waters46.
The two Bathycoccus were recovered from significantly different ranges of PAR, estimated from weekly aver-ages of surface irradiance measurements extrapolated to depth using an attenuation coefficient derived from local surface chlorophyll concentrations47 (Fig. 3, Supplementary Figures S9 and S10, Supplementary Information). Both Bathycoccus could thrive in winter when the overall light availability is low (Supplementary Figure S8). Nutrient concentrations did not seem to explain the separation between the two Bathycoccus. We found RCC1105 in nutrient-rich surface waters and TOSAG39-1 mostly at the DCM in oligotrophic waters, close to the nutricline characterized by a significant upward flux of nutrients48,49. While RCC1105 was never abundant below 80 m, TOSAG39-1 extended down to almost 150 m (Fig. 3 and Supplementary Figure S10).
Genomic plasticity.
For each genome, we searched for evidence of gene gain or loss by analyzing gene content variations at the different stations. Lost or gained genes could be considered as dispensable genes or as present only in some genomic variants, therefore, characterizing a “pan-genome” analogous to what is observed in bacterial populations50. We analyzed the coverage of metagenomic reads that were specifically mapped at high stringency onto one genome and looked for traces of gene loss. To avoid false positives caused by conserved genes, we restricted this analysis to samples where 98% of the genes from one of the two Bathycoccus genome sequences were detected, and focused on genes that were detected in the metagenomes of at least four samples, and not detected in at least five samples. Metatranscriptomic data was used to select genes having an expres-sion signal in at least six samples. Using these stringent criteria, we detected about one hundred dispensable genes for each genome (Supplementary Tables 1,4 and 5). Half of the RCC1105 dispensable genes (50/108) are located on chromosome 19, representing 70% of the genes on this chromosome. These genes have shorter cod-ing and intronic regions than other genes (Supplementary Table 1), which is a property of the genes predicted on outlier chromosome 1922. Dispensable genes on regular chromosomes also tend to be shorter. Additionally, the distribution of dispensable genes on the genome is not random. Among the 72 genes of chromosome 19, 47 out the 50 dispensable genes are grouped into two long blocks at the chromosome end, leaving the first part of chromosome 19 almost free of dispensable genes (Supplementary Figure S11). Dispensable genes also appear clustered on regular chromosomes. Twenty-one out of 58 dispensable genes are in small cassettes, two to four gene-long, especially on chromosomes 2, 5 and 17 (Fig. 4 and Supplementary Figure S11). We verified the conti-guity of the genomic regions around the dispensable genes by alignment with assemblies of metagenomics reads (Supplementary Information). We analyzed the pattern of loss of these dispensable cassettes in samples whereFigure 3. Relationships between environmental parameters and Bathycoccus genome abundance.
Left: Principal component analysis. We only considered stations where we detected 98% of the genes for one Bathycoccus genome, and for which all environmental parameters were available (Oxygen, Nitrates, Phosphates, Chlorophyll, Sampling Depth, Water Temperature and Salinity). Crosses indicate stations, with a color scale corresponding to the water temperature. The distance to coast parameter corresponds to the shortest geographical distance to the coast. The two Bathycoccus are distributed along temperature and oxygen axes. Stars indicate parameters that statistically discriminate the two Bathycoccus. Right: Range of values of temperature, oxygen and sampling depth for parameters where a significant difference was detected between RCC1105 and TOSAG39-1.
they were not detected and obtained alignments that included gaps in place of dispensable genes (Fig. 4). Notably, cassette borders were at the same positions in the various samples, showing a low diversity at these loci. This suggests that a common or single breakpoint event occurred in the past. Fragment recruitments plots showed a homogenous decrease of read coverage along the contiguous dispensable genes, confirming that genomic losses or gains occurred at the scale of entire cassettes (Fig. 4 and Supplementary Figure S11). We examined the synteny between RCC1105 and TOSAG39-1 for the regions corresponding to the two cassettes illustrated in Fig. 4. We retrieved the orthologous genes situated around the cassettes in two TOSAG39-1 scaffolds in a clear syntenic relationship, but the cassettes genes were missing.
Figure 4. Evidence for cassettes of dispensable genes in B. prasinos RCC1105. Left and right sides of the figures
represent fragment recruitment and genomic alignments of dispensable gene cassettes, respectively. Fragment recruitments plots are displayed by marine zones (left legend). Each dot corresponds to a given number of mapped reads at a given identity percent (indicated on the Y-axis). The density of mapped read is displayed as the black line plotted below each fragment recruitment plot. Gene positions are represented by black boxes on the top of the first fragment recruitment plot and dispensable genes are highlighted in red. Genomic alignments are represented as circos graphs79 on which dispensable genes are colored in red, and other genes are represented by black boxes. Left side and right side of the genomic region are connected to metagenomics contigs (gray segments), leaving in-between the locus of the dispensable gene cassette that remains unconnected to any metagenomic contig. Connections correspond to blast alignments positions. (A) 100- and 8.6-kb regions of chromosome 1 are represented on a fragment recruitment plot and on the circos graph, respectively. A two gene long cassette is represented. A massive decrease of read coverage appears on the fragment recruitment plot in all oceanic zones except in the Mediterranean Sea, which indicates that the two genes are present only in a sub-population in this basin. A similar pattern is observed in panel (B) for four consecutive genes for which fragment recruitment plots representing 100 kb of chromosome 5 suggest a presence in a Mediterranean sub-population and absence in other marine areas. The circos graph represents alignments along the 15.6-kb cassette locus with metagenomics contigs, which resulted in a gap that included three small genes (in blue) in addition to the four automatically detected dispensable genes. Fragment recruitment confirmed a significant, but not total, decrease of read coverage for these three genes in every oceanic zone, indicating that their presence or absence in the two sub-populations was widely distributed.
We observed an incomplete, but marked, depletion of read coverage for three contiguous genes on chromo-some 5. These genes immediately precede the longest dispensable gene cassette. This incomplete read coverage depletion indicates that this genomic region only occurs in a sub-population, suggesting a sympatry or at least co-occurence of these two genomic forms. This pattern was observed in every oceanic basin (Fig. 4B) with the longest dispensable gene cassette spanning seven genes.
The function of these dispensable genes is unclear. Only 15 dispensable genes located on RCC1105 non-outlier chromosomes possess a protein Pfam domain (Supplementary Information, Supplementary Table 3). However, several of these genes might be involved in genomic rearrangements because they contain reverse transcriptase and HNH endonuclease domains and this could be linked to their dispensability. Intriguingly, the average relative transcriptomic activity is higher in dispensable genes than in non-dispensable genes (0.73 vs. 0.56, Mann-Whitney-Wilcoxon test p-value = 1.52E-4, Supplementary Table 1).
Beside these patterns suggesting gene gains or losses, we examined at a global level the genomic variation within populations of each Bathycoccus. This was done by fragment recruitment of the metagenomic reads of Tara Oceans samples onto the two reference assemblies. The distributions of nucleotide identities show a weak divergence between the reference assemblies and geographically distant samples, though higher for TOSAG39-1 than for RCC1105 (Supplementary Information, Supplementary Figure S12).
Discussion
We provide a novel Bathycoccus genome assembly using a single-cell genomics approach. This assembly is esti-mated to be 64% complete, which is, to our knowledge, the most complete eukaryotic genome obtained to date by this approach. This relatively high level of completion was reached through the combination of several independ-ent cells originating from the same population. It has been described that the enzymatic amplification of DNA which is inherent to single-cell genomics induces strong biases in sequencing depth along the genome, leading to partial and fragmented assemblies51. Here, this caveat appears reduced as the combined-SAGs assembly is signif-icantly more complete than the assembly obtained from each of the individuals SAGs.
This Bathycoccus SAG assembly is significantly different from the previously described genome assembly, orig-inating from the coastal Mediterranean strain RCC1105. The former corresponds to the B1 clade and the latter to the B2 clade as, defined recently11. Orthologous proteins of these two genomes share only 78% identity, which is similar to the 74% of amino-acid identity shared by the two sequenced Ostreococcus isolates which belong to different clades52.
A previous study11 estimated a lower genetic distance (82% of identical nucleotides) between the two Bathycoccus using metagenomic data. This difference is probably as expected because of the reduced dataset of highly conserved and single copy genes (1 104 genes) considered in the latter analysis. The evolutionary distance that separates the protein coding genes of these two Bathycoccus is slightly smaller than the one between two vertebrate lineages separated by more than 400 million years (mammal and fish share 72% of identity53) and larger than the one reported between many model organisms (for example, human and mouse share 85% of iden-tity54,55). This high divergence in protein coding genes and the frequent genes rearrangement in chromosomes is hardly compatible with chromatid pairing required for intercrossing56 between the two Bathycoccus. Very few genes are highly conserved (>99% identity) between the two Bathycoccus and conserved genes are not clus-tered, which makes active genetic exchange by homologous recombination unlikely. Therefore, although the two Bathycoccus share 100% similar rRNA gene sequences, these genomic differences reflect two different, probably cryptic, species. Identical rRNA sequences have been previously reported in the yeast Saccharomyces cerevisiae sensu stricto clade57, or the haptophyte species Emiliania huxleyi and Gephyrocapsa oceanica, which also have identical 18S rRNA gene sequences, but quite different morphologies58.
The combination of genomics and environmental data from a large set of oceanic samples revealed the distinct ecological preferences of the two Bathycoccus with respect to depth, temperature, light and oxygen. TOSAG39-1 is usually found in warmer but deeper and darker water than RCC1105. TOSAG39-1 seems to be well adapted to the DCM conditions, which would explain its presence in oligotrophic marine zones where nutrients are found deeper.
Numerous marine bacteria show geographical variation of their gene repertoire59–63 which affects genomic regions that generally represent only a few percent of the total genome61 and has been proposed, in some cases, to result from horizontal transfer. In Prochlorococcus, genomic islands are thought to be related to niche adapta-tion63 because they host ecologically important genes60. A comparison of two Prochlorococcus ecotypes revealed that differences in gene content were related to high-light vs. low-light adaptation64. Such adaptations have been hypothesized in species closely related to Bathycoccus, like Ostreococcus17, but are still a matter of debate9. Our data show that the depth and light ranges of the two Bathycoccus are different but overlapping, with TOSAG39-1 extending deeper. Interestingly, the surface samples where TOSAG39-1 was detected correspond to sites that undergo vertical mixing (Aghulas and Gulf Stream). Temperature also seemed to influence the distribution of the two Bathycoccus, as for example along the Gulf Stream where one type is more prevalent on the West side and is replaced by the other type eastward as water cools down. Among eukaryotes, several examples of correspondence between temperature and geographical distribution have been reported, such as for the heterotrophic MAST-426,65 and the Arctic ecotype of Micromonas8. TOSAG39-1 was also observed at low O
2 concentrations at Costa Rica Dome station 138, an area of high biological production in the East equatorial Pacific66 where picoplankton can be very abundant67. This could reflect the fact that since TOSAG39-1 is better adapted to low light conditions it could be found deeper in the water column where suboxic conditions are developing, rather than having a specific capacity to withstand low O2.
The wide geographical distribution and relatively high abundance of Bathycoccus observed here implies a capability to thrive across a range of ecological niches. Dispensable genes could correspond to the genomic traces of this adaptation. Intriguingly, dispensable Bathycoccus genes have genomic features similar to those of
chromosome 19 genes, such as a lower GC content. This suggests that these genes may have been located on chromosome 19 ancestrally and have undergone subsequently inter-chromosomal translocations. A recent exper-imental evolution experiment of Ostreococcus tauri inoculated with a large quantity of virus, Otv5, provided evidence that genes on outlier chromosome 19 are up-regulated in viral-resistant cell lines and that the size of this chromosome varies in resistant lines68. Our results on gene content plasticity in Chromosome 19 is consistent with the immunity chromosome hypothesis: frequent events of gene birth and gene loss may thus be the genomic traces of a microalgal – virus evolutionary arm race.
Dispensable genes possess features of so-called de novo genes, genes emerging from previously noncoding regions. These genes are an important class of unknown genes and challenge evolutionary sciences69,70. It has been hypothesized that cosmopolitan bacteria would hold specific genes or gene variants due to their ecological properties71. Cosmopolitan marine lineages are exposed to a range of contrasted environmental constraints, rais-ing the question of their genomic plasticity. The high turnover of a certain class of genes restricted to some envi-ronmental conditions might be an evolutionary advantage for rapid acclimation related to being cosmopolitan.
The amplification biases inherent to the Single Cell Genomics approach do not in general allow recovering full genomes from environmental protists. However even incomplete SAG assemblies are sufficient to allow map-ping of environmental metagenomes and to determine the distribution of genotypes that are not resolved by traditional marker genes or metabarcodes. In the case of Bathycoccus we provide the distribution of two clades, corresponding to the genomes of RCC1105 (clade B1) and to the genome of TOSAG39-1 (clade B2) and identify environmental parameters underlying these distributions. Our observations unfortunately do not cover all oce-anic ecosystems, particularly the polar zones. Future analysis of additional genomes and transcriptomes of wild and cultured Bathycoccus will improve the accuracy of the environmental niches of the two types of Bathycoccus.
Material and Methods
During the Tara Oceans expedition34,35, we collected and cryo-preserved samples at station TARA_039 situated in the Arabian Sea (Supplementary Figure S13, oceanographic conditions are available in reference36). In the laboratory, single cells were sorted by flow cytometry based on their size and chlorophyll autofluorescence. Four Bathycoccus cells were identified following DNA amplification and 18 S rDNA sequencing37. The four amplified genomes (A, B, C, D - Table 1) were individually sequenced using Illumina HiSeq technology, and a suite of tools was used to obtain single-cell final assembly (Supplementary Information). Firstly, individual assemblies were generated using a colored de Bruijn graph-based method72 and then a final assembly, named here as TOSAG39-1, was generated comprising gap-reduced scaffolded contigs, using SPAdes, SSPACE and GapCloser73–75 (Supplementary Figure S14). The four cells had identical 18 S sequences and came from the same 4 mL sample, so it is reasonable to presume they were of the same population.
Quality control filters detected and removed contigs or scaffolds that did not correspond to Bathycoccus nuclear DNA (Supplementary Figure S14, Supplementary Information). Direct comparisons of sequence assem-blies detected putative DNA contamination from other SAGs that were sequenced in the same laboratory and scaffolds corresponding to organelles.
We predicted exon-intron gene structures by integrating various coding regions data. We aligned the reference protein set of the published Bathycoccus RCC1105 genome22 to our assembly. We extracted and sequenced polyA mRNA from Tara Oceans samples. We aligned this eukaryote metatranscriptome on TOSAG39-1 assembly. We also used a public protein databank76 and the Marine Microbial Eukaryote Transcriptome Sequencing Project (MMETSP) collection of marine protist transcriptomes42. In addition, we performed direct ab initio prediction by calibrating and running the Markov model implemented in snap77. Integrating and combining all this evidence provided a final set of genes, using a process based on Gmorse software rationale78. We evaluated the relative genomic abundance of each genome for two sampled depths (surface and DCM) at the 76 Tara Oceans stations (122 samples in total, Supplementary Figure S13) by recruiting metagenomic reads24. We mapped metagenomic reads directly from 0.8–5 μ m organism-size fraction samples onto genome assemblies, and estimated the relative contribution of each Bathycoccus genome in the metagenomes. To obtain a proper genome abundance estimate, we developed methods to select genome-specific signals only (Supplementary Information). We discarded highly conserved genes that were detected by direct sequence comparisons.
A more detailed description of methods is available in the online supplementary information.
References
1. Field, C. B., Behrenfeld, M. J., Randerson, J. T. & Falkowski, P. Primary production of the biosphere: integrating terrestrial and oceanic components. Science 281, 237–240 (1998).
2. Scanlan, D. J. et al. Ecological genomics of marine picocyanobacteria. Microbiol. Mol. Biol. Rev. 73, 249–299 (2009).
3. Worden, A. Z., Nolan, J. K. & Palenik, B. Assessing the dynamics and ecology of marine picophytoplankton: the importance of the eukaryotic component. Limnol. Oceanogr. 49, 168–179 (2004).
4. Wilkins, D. et al. Biogeographic partitioning of Southern Ocean microorganisms revealed by metagenomics. Environ. Microbiol. 15, 1318–1333 (2013).
5. Vaulot, D., Eikrem, W., Viprey, M. & Moreau, H. The diversity of small eukaryotic phytoplankton (≤ 3 μ m) in marine ecosystems. FEMS Microbiol. Rev. 32, 795–820 (2008).
6. Marin, B. & Melkonian, M. Molecular phylogeny and classification of the Mamiellophyceae class. nov. (Chlorophyta) based on sequence comparisons of the nuclear- and plastid-encoded rRNA operons. Protist 161, 304–336 (2010).
7. Šlapeta, J., López-García, P. & Moreira, D. Global dispersal and ancient cryptic species in the smallest marine eukaryotes. Mol. Biol. Evol. 23, 23–29 (2006).
8. Lovejoy, C. et al. Distribution, phylogeny, and growth of cold-adapted picoprasinophytes in arctic seas. J. Phycol. 43, 78–89 (2007). 9. Demir-Hilton, E. et al. Global distribution patterns of distinct clades of the photosynthetic picoeukaryote Ostreococcus. ISME J. 5,
1095–1107 (2011).
10. Monier, A., Sudek, S., Fast, N. M. & Worden, A. Z. Gene invasion in distant eukaryotic lineages: discovery of mutually exclusive genetic elements reveals marine biodiversity. ISME J. 7, 1764–1774 (2013).
11. Simmons, M. P. et al. Abundance and biogeography of picoprasinophyte ecotypes and other phytoplankton in the eastern north pacific ocean. Appl. Environ. Microbiol. 82, 1693–1705 (2016).
12. Foulon, E. et al. Ecological niche partitioning in the picoplanktonic green alga Micromonas pusilla: evidence from environmental surveys using phylogenetic probes. Environ. Microbiol. 10, 2433–2443 (2008).
13. Worden, A. Z. et al. Green evolution and dynamic adaptations revealed by genomes of the marine picoeukaryotes Micromonas. Science 324, 268–272 (2009).
14. Simmons, M. P. et al. Intron invasions trace algal speciation and reveal nearly identical arctic and antarctic Micromonas populations. Mol. Biol. Evol. 32, 2219–2235 (2015).
15. Chrétiennot-Dinet, M.-J. et al. A new marine picoeucaryote: Ostreococcus tauri gen. et sp. nov. (Chlorophyta, Prasinophyceae). Phycologia 34, 285–292 (1995).
16. Subirana, L. et al. Morphology, genome plasticity, and phylogeny in the genus Ostreococcus reveal a cryptic species, O. mediterraneus sp. nov. (Mamiellales, Mamiellophyceae). Protist 164, 643–659 (2013).
17. Rodríguez, F. et al. Ecotype diversity in the marine picoeukaryote Ostreococcus (Chlorophyta, Prasinophyceae). Environ. Microbiol.
7, 853–859 (2005).
18. Eikrem, W. & Throndsen, J. The ultrastructure of Bathycoccus gen. nov. and B. prasinos sp. nov., a non-motile picoplanktonic alga (Chlorophyta, Prasinophyceae) from the Mediterranean and Atlantic. Phycologia 29, 344–350 (1990).
19. Johnson, P. W. & Sieburth, J. M. In-Situ morphology and occurrence of eucaryotic phototrophs of bacterial size in the picoplankton of estuarine and oceanic waters. J. Phycol. 18, 318–327 (1982).
20. Collado-Fabbri, S., Vaulot, D. & Ulloa, O. Structure and seasonal dynamics of the eukaryotic picophytoplankton community in a wind-driven coastal upwelling ecosystem. Limnol. Oceanogr. 56, 2334–2346 (2011).
21. Not, F. et al. A single species, Micromonas pusilla (Prasinophyceae), dominates the eukaryotic picoplankton in the Western English Channel. Appl. Environ. Microbiol. 70, 4064–4072 (2004).
22. Moreau, H. et al. Gene functionalities and genome structure in Bathycoccus prasinos reflect cellular specializations at the base of the green lineage. Genome Biol. 13, R74 (2012).
23. Vaulot, D. et al. Metagenomes of the picoalga Bathycoccus from the Chile coastal upwelling. PLoS ONE 7, e39648 (2012). 24. Rusch, D. B. et al. The Sorcerer II Global Ocean Sampling expedition: northwest Atlantic through eastern tropical Pacific. PLoS Biol.
5, e77 (2007).
25. Hellweger, F. L., van Sebille, E. & Fredrick, N. D. Biogeographic patterns in ocean microbes emerge in a neutral agent-based model. Science 345, 1346–1349 (2014).
26. Rodríguez-Martínez, R., Rocap, G., Salazar, G. & Massana, R. Biogeography of the uncultured marine picoeukaryote MAST-4: temperature-driven distribution patterns. ISME J. 7, 1531–1543 (2013).
27. de Vargas, C. et al. Eukaryotic plankton diversity in the sunlit ocean. Science 348, 1261605 (2015).
28. Heywood, J. L., Sieracki, M. E., Bellows, W., Poulton, N. J. & Stepanauskas, R. Capturing diversity of marine heterotrophic protists: one cell at a time. ISME J. 5, 674–684 (2011).
29. Lasken, R. S. Genomic sequencing of uncultured microorganisms from single cells. Nat. Rev. Microbiol. 10, 631–640 (2012). 30. Gasc, C. et al. Capturing prokaryotic dark matter genomes. Res. Microbiol. 166, 814–830 (2015).
31. Yoon, H. S. et al. Single-cell genomics reveals organismal interactions in uncultivated marine protists. Science 332, 714–717 (2011). 32. Martinez-Garcia, M. et al. Unveiling in situ interactions between marine protists and bacteria through single cell sequencing. ISME
J. 6, 703–707 (2012).
33. Roy, R. S. et al. Single cell genome analysis of an uncultured heterotrophic stramenopile. Sci. Rep. 4, 4780 (2014).
34. Karsenti, E. A journey from reductionist to systemic cell biology aboard the schooner Tara. Mol. Biol. Cell 23, 2403–2406 (2012). 35. Karsenti, E. et al. A holistic approach to marine eco-systems biology. PLoS Biol 9, e1001177 (2011).
36. Pesant, S. et al. Open science resources for the discovery and analysis of Tara Oceans data. Sci. Data 2, 150023 (2015).
37. Stepanauskas, R. & Sieracki, M. E. Matching phylogeny and metabolism in the uncultured marine bacteria, one cell at a time. Proc. Natl. Acad. Sci. USA. 104, 9052–9057 (2007).
38. Bork, P. et al. Tara Oceans. Tara Oceans studies plankton at planetary scale. Introduction. Science 348, 873 (2015).
39. Parra, G., Bradnam, K. & Korf, I. CEGMA: a pipeline to accurately annotate core genes in eukaryotic genomes. Bioinformatics 23, 1061–1067 (2007).
40. Monier, A. et al. Phosphate transporters in marine phytoplankton and their viruses: cross-domain commonalities in viral-host gene exchanges. Environ. Microbiol. 14, 162–176 (2012).
41. Decelle, J. et al. PhytoREF: a reference database of the plastidial 16S rRNA gene of photosynthetic eukaryotes with curated taxonomy. Mol. Ecol. Resour. 15, 1435–1445 (2015).
42. Keeling, P. J. et al. The Marine Microbial Eukaryote Transcriptome Sequencing Project (MMETSP): illuminating the functional diversity of eukaryotic life in the oceans through transcriptome sequencing. PLOS Biol 12, e1001889 (2014).
43. Altschul, S. F., Gish, W., Miller, W., Myers, E. W. & Lipman, D. J. Basic local alignment search tool. J. Mol. Biol. 215, 403–410 (1990). 44. Martin, J. H. et al. Testing the iron hypothesis in ecosystems of the equatorial Pacific Ocean. Nature 371, 123–129 (1994). 45. Villar, E. et al. Environmental characteristics of Agulhas rings affect interocean plankton transport. Science 348, 1261447–1261447
(2015).
46. Ulloa, O., Canfield, D. E., DeLong, E. F., Letelier, R. M. & Stewart, F. J. Microbial oceanography of anoxic oxygen minimum zones. Proc. Natl. Acad. Sci. 109, 15996–16003 (2012).
47. Morel, A. et al. Examining the consistency of products derived from various ocean color sensors in open ocean (Case 1) waters in the perspective of a multi-sensor approach. Remote Sens. Environ. 111, 69–88 (2007).
48. Cullen, J. J. Subsurface chlorophyll maximum Layers: enduring enigma or mystery solved? Annu. Rev. Mar. Sci. 7, 207–239 (2015). 49. Fernández-Castro, B. et al. Importance of salt fingering for new nitrogen supply in the oligotrophic ocean. Nat. Commun. 6, 8002
(2015).
50. Medini, D., Donati, C., Tettelin, H., Masignani, V. & Rappuoli, R. The microbial pan-genome. Curr. Opin. Genet. Dev. 15, 589–594 (2005).
51. Gawad, C., Koh, W. & Quake, S. R. Single-cell genome sequencing: current state of the science. Nat. Rev. Genet. 17, 175–188 (2016). 52. Palenik, B. et al. The tiny eukaryote Ostreococcus provides genomic insights into the paradox of plankton speciation. Proc. Natl.
Acad. Sci. USA 104, 7705–7710 (2007).
53. Jaillon, O. et al. Genome duplication in the teleost fish Tetraodon nigroviridis reveals the early vertebrate proto-karyotype. Nature
431, 946–957 (2004).
54. Makałowski, W., Zhang, J. & Boguski, M. S. Comparative analysis of 1196 orthologous mouse and human full-length mRNA and protein sequences. Genome Res. 6, 846–857 (1996).
55. Mouse Genome, Sequencing Consortium et al. Initial sequencing and comparative analysis of the mouse genome. Nature 420, 520–562 (2002).
56. Coleman, A. W. Is there a molecular key to the level of ‘biological species’ in eukaryotes? A DNA guide. Mol. Phylogenet. Evol. 50, 197–203 (2009).
57. James, S. A., Cai, J., Roberts, I. N. & Collins, M. D. A phylogenetic analysis of the genus Saccharomyces based on 18S rRNA gene sequences: description of Saccharomyces kunashirensis sp. nov. and Saccharomyces martiniae sp. nov. Int. J. Syst. Bacteriol. 47, 453–460 (1997).
58. Bendif, E. M. et al. Genetic delineation between and within the widespread coccolithophore morpho-species Emiliania huxleyi and Gephyrocapsa oceanica (Haptophyta). J. Phycol. 50, 140–148 (2014).
59. Acuña, L. G. et al. Architecture and gene repertoire of the flexible genome of the extreme acidophile Acidithiobacillus caldus. PLoS ONE 8, (2013).
60. Coleman, M. L. et al. Genomic islands and the ecology and evolution of Prochlorococcus. Science 311, 1768–1770 (2006). 61. Fernández-Gómez, B. et al. Patterns and architecture of genomic islands in marine bacteria. BMC Genomics 13, 347 (2012). 62. Gonzaga, A. et al. Polyclonality of concurrent natural populations of Alteromonas macleodii. Genome Biol. Evol. 4, 1360–1374
(2012).
63. Kashtan, N. et al. Single-Cell genomics reveals hundreds of coexisting subpopulations in wild Prochlorococcus. Science 344, 416–420 (2014).
64. Rocap, G. et al. Genome divergence in two Prochlorococcus ecotypes reflects oceanic niche differentiation. Nature 424, 1042–1047 (2003).
65. Lin, Y.-C. et al. Distribution patterns and phylogeny of marine Stramenopiles in the North Pacific Ocean. Appl. Environ. Microbiol.
78, 3387–3399 (2012).
66. Fiedler, P. C. The annual cycle and biological effects of the Costa Rica Dome. Deep Sea North Pacific Ocean Res. Part Oceanogr. Res. Pap. 49, 321–338 (2002).
67. Ahlgren, N. A. et al. The unique trace metal and mixed layer conditions of the Costa Rica upwelling dome support a distinct and dense community of Synechococcus. Limnol. Oceanogr. 59, 2166–2184 (2014).
68. Yau, S. et al. A viral immunity chromosome in the marine picoeukaryote, Ostreococcus tauri. PLoS Pathog. Part I 12, e1005965 (2016).
69. Carvunis, A.-R. et al. Proto-genes and de novo gene birth. Nature 487, 370–374 (2012).
70. Schlötterer, C. Genes from scratch – the evolutionary fate of de novo genes. Trends Genet. 31, 215–219 (2015).
71. Ramette, A. & Tiedje, J. M. Biogeography: an emerging cornerstone for understanding prokaryotic diversity, ecology, and evolution. Microb. Ecol. 53, 197–207 (2007).
72. Chitsaz, H. et al. Efficient de novo assembly of single-cell bacterial genomes from short-read data sets. Nat. Biotechnol. 29, 915–921 (2011).
73. Bankevich, A. et al. SPAdes: a new genome assembly algorithm and its applications to single-cell sequencing. J. Comput. Biol. J. Comput. Mol. Cell Biol. 19, 455–477 (2012).
74. Boetzer, M., Henkel, C. V., Jansen, H. J., Butler, D. & Pirovano, W. Scaffolding pre-assembled contigs using SSPACE. Bioinforma. Oxf. Engl. 27, 578–579 (2011).
75. Luo, R. et al. SOAPdenovo2: an empirically improved memory-efficient short-read de novo assembler. GigaScience 1, 18 (2012). 76. Suzek, B. E., Huang, H., McGarvey, P., Mazumder, R. & Wu, C. H. UniRef: comprehensive and non-redundant UniProt reference
clusters. Bioinforma. Oxf. Engl. 23, 1282–1288 (2007).
77. Korf, I. Gene finding in novel genomes. BMC Bioinformatics 5, 59 (2004).
78. Denoeud, F. et al. Annotating genomes with massive-scale RNA sequencing. Genome Biol. 9, R175 (2008). 79. Krzywinski, M. et al. Circos: an information aesthetic for comparative genomics. Genome Res. 19, 1639–1645 (2009).
Acknowledgements
We thank the commitment of the following people and sponsors who made this expedition possible: CNRS (in particular Groupement de Recherche GDR3280), European Molecular Biology Laboratory (EMBL), Genoscope/ CEA, the French Governement ‘Investissement d’Avenir’ programs Oceanomics (ANR-11-BTBR-0008) and FRANCE GENOMIQUE (ANR-10-INBS-09), Fund for Scientific Research – Flanders, VIB, Stazione Zoologica Anton Dohrn, UNIMIB, ANR (projects POSEIDON/ANR-09-BLAN-0348, PROMETHEUS/ANR-09-PCS-GENM-217, TARA-GIRUS/ANR-09-PCS-GENM-218), EU FP7 MicroB3/No.287589, US NSF grant DEB-1031049 to MES, FWO, BIO5, Biosphere 2, Agnès b., the Veolia Environment Foundation, Region Bretagne, World Courier, Illumina, Cap L’Orient, the EDF Foundation EDF Diversiterre, FRB, the Prince Albert II de Monaco Foundation, Etienne Bourgois, and not least, the Tara schooner and its captain and crew. Tara Oceans would not exist without continuous support from 23 institutes (http://oceans.taraexpeditions.org). We acknowledge Samuel Chaffron, Lionel Guidi and Lars Stemmann for help with the environmental parameters, Claude Scarpelli for support with the high-performance computing. We warmly thank Gwenael Piganeau for reading and suggestions on this manuscript. We thank members of the Tara Oceans consortium, coordinated by Eric Karsenti, for the creative environment and constructive criticism.
Author Contributions
C.d.V., M.S., P.W. and O.J. designed the study. O.J. wrote the paper, with significant inputs from D.V., T.V. and P.W. M.S. managed the single cell isolation; Y.S. and J.M.A. managed the SAG assembly and gene predictions. T.V. and O.J. analyzed the genomic data, with significant input from J.L., Y.S., S.M., E.P., J.M.A., D.V. and P.W. T.V., J.L., D.V., D.I. and O.J. analyzed the oceanographic data. All authors discussed the results and commented on the manuscript.
Additional Information
Accession codes: This article is contribution number 48 of Tara Oceans. Physicochemical parameters
from all Tara Oceans samples are available at Pangea (http://doi.pangaea.de/10.1594/PANGAEA.840721); metagenomics reads can be downloaded at SRA under identification study number PRJEB402 (https://www. ebi.ac.uk/ena/data/view/PRJEB402). The sequences of TOSAG39-1 were deposited and are available at EMBL/ DDBL/GenBank under accession number ERA768231.
Supplementary information accompanies this paper at http://www.nature.com/srep Competing financial interests: The authors declare no competing financial interests.
How to cite this article: Vannier, T. et al. Survey of the green picoalga Bathycoccus genomes in the global ocean.
Sci. Rep. 6, 37900; doi: 10.1038/srep37900 (2016).
Publisher's note: Springer Nature remains neutral with regard to jurisdictional claims in published maps and
This work is licensed under a Creative Commons Attribution 4.0 International License. The images or other third party material in this article are included in the article’s Creative Commons license, unless indicated otherwise in the credit line; if the material is not included under the Creative Commons license, users will need to obtain permission from the license holder to reproduce the material. To view a copy of this license, visit http://creativecommons.org/licenses/by/4.0/