HAL Id: insu-00546161
https://hal-insu.archives-ouvertes.fr/insu-00546161
Submitted on 13 Dec 2010
HAL is a multi-disciplinary open access
archive for the deposit and dissemination of
sci-entific research documents, whether they are
pub-lished or not. The documents may come from
teaching and research institutions in France or
abroad, or from public or private research centers.
L’archive ouverte pluridisciplinaire HAL, est
destinée au dépôt et à la diffusion de documents
scientifiques de niveau recherche, publiés ou non,
émanant des établissements d’enseignement et de
recherche français ou étrangers, des laboratoires
publics ou privés.
Imaging the spinning gas and dust in the disc around
the supergiant A[e] star HD62623
Florentin Millour, Anthony Meilland, Olivier Chesneau, Philippe Stee, Samer
Kanaan, Romain Petrov, Denis Mourard, S. Kraus
To cite this version:
Florentin Millour, Anthony Meilland, Olivier Chesneau, Philippe Stee, Samer Kanaan, et al.. Imaging
the spinning gas and dust in the disc around the supergiant A[e] star HD62623. Astronomy and
Astrophysics - A&A, EDP Sciences, 2010, �10.1051/0004-6361/201016193�. �insu-00546161�
Astronomy & Astrophysicsmanuscript no. 16193paper.hyper2884 c ESO 2010 December 13, 2010
Imaging the spinning gas and dust in the disc around the
supergiant A[e] star HD 62623
⋆
F. Millour
1,2, A. Meilland
2, O. Chesneau
1, Ph. Stee
1, S. Kanaan
1,3, R. Petrov
1, D. Mourard
1, and S.Kraus
2,41 Laboratoire FIZEAU, Universit´e de Nice-Sophia Antipolis, Observatoire de la Cˆote d’Azur, 06108 Nice, France
2 Max-Planck-Institute for Radioastronomy, Auf dem H¨ugel 69, 53121, Bonn, Germany
3 Departamento de F´ısica y Astronom´ıa, Universidad de Valpara´ıso, Errzuriz 1834, Valparaso, Chile.
4 Department of Astronomy, University of Michigan, 500 Church Street, Ann Arbor, Michigan 48109-1090, USA
Received; accepted
ABSTRACT
Context. To progress in the understanding of evolution of massive stars one needs to constrain the mass-loss and determine the phenomenon responsible for the ejection of matter an its reorganization in the circumstellar environment
Aims. In order to test various mass-ejection processes, we probed the geometry and kinematics of the dust and gas surrounding the A[e] supergiant HD 62623.
Methods. We used the combined high spectral and spatial resolution offered by the VLTI/AMBER instrument. Thanks to a new multi-wavelength optical/IR interferometry imaging technique, we reconstructed the first velocity-resolved images with a milliarcsecond resolution in the infrared domain.
Results. We managed to disentangle the dust and gas emission in the HD 62623 circumstellar disc. We measured the dusty disc inner inner rim, i.e. 6 mas, constrained the inclination angle and the position angle of the major-axis of the disc. We also measured the inner gaseous disc extension (2 mas) and probed its velocity field thanks to AMBER high spectral resolution. We find that the expansion velocity is negligible, and that Keplerian rotation is a favoured velocity field. Such a velocity field is unexpected if fast rotation of the central star alone is the main mechanism of matter ejection.
Conclusions. As the star itself seems to rotate below its breakup-up velocity, rotation cannot explain the formation of the dense equatorial disc. Moreover, as the expansion velocity is negligible, radiatively driven wind is also not a suitable explanation to explain the disc formation. Consequently, the most probable hypothesis is that the accumulation of matter in the equatorial plane is due to the presence of the spectroscopic low mass companion.
Key words. Techniques: imaging spectroscopy – Stars: emission-line, Be – Techniques: interferometric – Stars: individual: HD 62623 – Techniques: high angular resolution – Stars: circumstellar matter
1. Introduction
The supergiant A[e] star (Lamers et al. 1998) HD 62623 (HR 2996, 3 Puppis, l Puppis), is a key object for under-standing the processes at the origin of aspherical shells in massive evolved stars (Humphrey & Davidson 1994) and super-novae (Kirshner 1987). Indeed, HD 62623 is surrounded by a dense gaseous and dusty disc (Meilland et al. 2010), a structure more often found in young stellar objects and post-AGB stars (van Winckel et al. 2006). Discs are known to govern accretion or mass-loss in these lower-mass objects, but their origin and structure remain highly debated for massive stars (Porter 2003). Fast rotation of the star leads to an expanding disc-like wind in the case of very massive stars (Zickgraff et al. 1985 ; Lamers & Pauldrach 1991) or, when viscosity becomes dom-inant in less massive stars, it leads to a rotating disc (Lee et al. 1991). The presence of a companion star could also lead to a rotating disc (Plets et al. 1995).
Fast rotation, or the presence of a companion star, could be responsible for the breakup of spherical symmetry of
mass-Send offprint requests to: fmillour@oca.eu
⋆ Based on CNRS Guaranteed Time Observations with ESO
tele-scopes at the Paranal Observatory under program 084.D-0355, and on Director’s Discretionary Time, 284.D-5059. Feasibility was assessed using open time, 083.C-0621.
loss around the massive, hot and luminous object at the core of HD 62623. To test these two hypotheses, one needs to access unprecedented combined spatial and spectral resolutions. Here, we report the first continuum image and velocity-resolved im-ages in a circumstellar disc using a new multi-wavelength opti-cal interferometry imaging method, which allows us to spatially disentangle the dust and gas emissions of HD 62623.
Date Telescope Number Seeing Coherence
Config. of Obs (”) time (ms)
08/01/10 D0-H0-K0 10 0.48 – 1.48 2.5 – 7.3
11/01/10 D0-G1-H0 1 0.84 4.9
17/01/10 E0-G0-H0 13 0.50 – 1.03 2.4 – 5.1
19/01/10 A0-K0-G1 10 0.72 – 1.42 4.3 – 8.4
18/03/10 D0-G1-H0 2 0.55 – 1.68 1.7 – 2.7
Table 1. VLTI/AMBER observing log for HD62623.
2. VLTI/AMBER Observations, and Data Reduction
To unambiguously resolve the close environment of HD 62623, both spatially and spectrally, we acquired data in early 2010 (ta-ble 1) using the VLTI/AMBER instrument (Petrov et al 2007).
2 Millour et al.: Images of the spinning disc around HD 62623
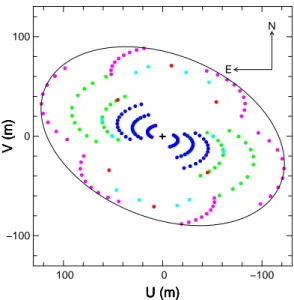
Each AMBER measurement consists of three visibilities, one closure phase, three wavelength-differential phases, and one flux measurement, each of them spectrally dispersed on about 500 narrow-band channels, with a spectral resolution power of 12000 close to the Brγ line. We used the standard AMBER pack-age (Tatulli et al 2007) to reduce the data, complemented with calibration scripts (Millour et al. 2008). The dataset (≈ 54000 visibilities, ≈ 54000 differential phases, and ≈ 18000 closure phases, presented Fig. 2) and resulting UV coverage, presented in Fig 1, are noticeably the largest obtained so far with the VLTI.
N E −100 0 100 −100 0 100 U (m) V (m) U (m) V (m) U (m) V (m) U (m) V (m) U (m) V (m)
Fig. 1. The UV coverage of our observations. Different colours represent different nights. The ellipse has dimensions 82x128m.
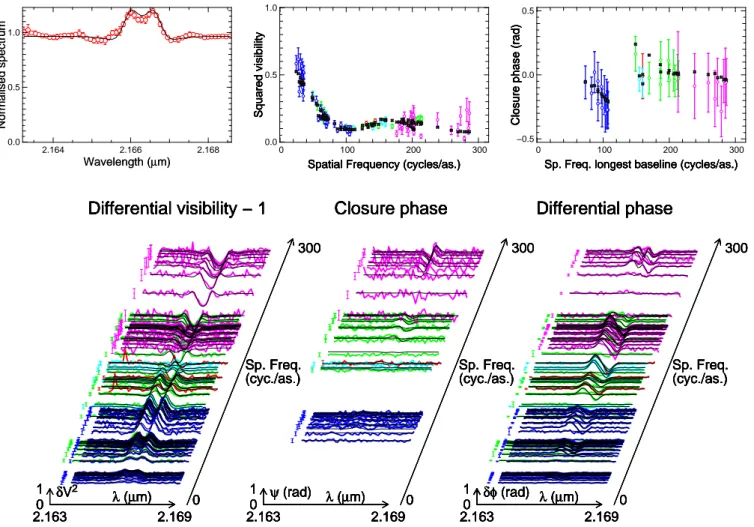
Our HD 62623 squared visibilities (top-middle of Fig 2) decrease with increasing spatial frequencies with values close to 0 at high frequencies, meaning that we resolved the close environment of HD 62623. In addition, we detect non-zero closure phases, indicating asymmetries in the environment of HD 62623 (top-right panel of Fig. 2). In addition, we clearly re-solve changes in the visibilities, closure phases and differential phases in the Brγ line (bottom panels of Fig. 2).
We then used the MIRA software (Thi´ebaut et al 2003) to recover a spectrally dispersed image cube of HD 62623, using in a first attempt squared visibilities and closure phases. We did not try other image reconstruction software, based on the con-clusion of Millour et al. 2009. In addition, we developed a ded-icated self-calibration method (presented in Section 3) to add the wavelength-differential phases to the image recovery pro-cess, MIRA being used this time with squared visibilities, clo-sure phases and phases. This additional step contribute to link the astrometry of all narrow-band images together, allowing us to measure astrometric changes in the emission line compared to the continuum.
To calibrate the phases sign (and, hence, the on-sky orien-tation of the images), we also performed reconstructions using MIRA on the θ Ori C dataset from Kraus et al. 20091
1 kindly provided by the authors at
http://www.mpifr-bonn.mpg.de/staff/skraus/files/amber.htm
3. The Self-Calibration Method
3.1. The Wavelength-Differential Phase
Wavelength-differential phase in optical/infrared stellar interfer-ometry is a partial measure of the object Fourier phase φobject(λ). Indeed, the phase measured on a ground-based long-baseline interferometer is affected by randomly variable perturbations. These perturbations are composed of, by decreasing magnitude (in the near-infrared):
– δ, a variable achromatic Optical Path Difference (OPD) be-tween the two telescopes,
– δdry, a chromatic dry air OPD, – δwet, a chromatic wet air OPD.
The measured phase ϕmeasured takes therefore the following form:
ϕmeasured(t, λ) = φobject(λ) +
2π[δ(t) + δdry(t, λ) + δwet(t, λ)]
λ (1)
The differential phase computation algorithm (see Millour et al. 2006 for the application to AMBER) aims at removing the term 2π[δ(t) + δdry(t, λ) + δwet(t, λ)]/λ from this equation. This term can be described by the following first-order Taylor-expansion:
2π[δ(t) + δdry(t, λ) + δwet(t, λ)]
λ = α(t) + β(t)/λ + ... (2)
A very simple model-fitting to the observed real-time phase data yield α and β time sequences. A subsequent subtraction and averaging is then performed to compute the wavelength-differential phase. In this fitting procedure, any phase term from the object that could mimic an atmospheric OPD will be re-moved. Therefore, at first order, differential phase is the object’s phase where both an offset and a slope have been subtracted:
ϕdiff(λ) = φobject(λ) − α′−β′/λ (3)
In practice, removing this offset and slope from the object phase makes the wavelength-differential phase free of any abso-lute astrometric information from the object. On the other hand, the wavelength-differential phase does give relative astrometry information at one wavelength compared to the one at another wavelength, giving access to spectro-astrometric measurements (see Millour et al. 2007 for a detailed example of application). 3.2. Self-Calibration applied to Optical/Infrared
Interferometry
Compared to the radio-astronomy phase, this optical/infrared wavelength-differential phase bears many similarities. The biggest difference is that its average is set to zero and that its av-erage slope is also set to zero. A previous work (Millour 2006, pp. 63–69, especially Fig. 3.7) demonstrated, in theory, the po-tential of wavelength-differential phase for use in interferomet-ric image synthesis. Inspired by a radio-astronomy review arti-cle by Pearson & Radhead (1984), we realise here the practical application of this development, by implementing an equivalent to the Hybrid Mapping algorithm (also called self-calibration algorithm), using the MIRA software instead of the CLEAN algorithm to produce the hybrid maps, and the wavelength-differential phases instead of radio-phases. The main differences in our case compared to radio-interferometry are:
2.164 2.166 2.168 0.0 0.5 1.0 Wavelength (µm) Normalised spectrum Wavelength (µm) Normalised spectrum 0 100 200 300 0.0 0.5 1.0 0 100 200 300 −0.5 0.0 0.5
Spatial Frequency (cycles/as.)
Squared visibility
Sp. Freq. longest baseline (cycles/as.)
Closure phase (rad)
Spatial Frequency (cycles/as.)
Squared visibility
Sp. Freq. longest baseline (cycles/as.)
Closure phase (rad)
Spatial Frequency (cycles/as.)
Squared visibility
Sp. Freq. longest baseline (cycles/as.)
Closure phase (rad)
Spatial Frequency (cycles/as.)
Squared visibility
Sp. Freq. longest baseline (cycles/as.)
Closure phase (rad)
Spatial Frequency (cycles/as.)
Squared visibility
Sp. Freq. longest baseline (cycles/as.)
Closure phase (rad)
Spatial Frequency (cycles/as.)
Squared visibility
Sp. Freq. longest baseline (cycles/as.)
Closure phase (rad)
δV2 0 1 λ (µm) 2.163 2.169 Sp. Freq. (cyc./as.) 0 300 δV2 0 1 λ (µm) 2.163 2.169 Sp. Freq. (cyc./as.) 0 300 δV2 0 1 λ (µm) 2.163 2.169 Sp. Freq. (cyc./as.) 0 300 δV2 0 1 λ (µm) 2.163 2.169 Sp. Freq. (cyc./as.) 0 300 δV2 0 1 λ (µm) 2.163 2.169 Sp. Freq. (cyc./as.) 0 300 δV2 0 1 λ (µm) 2.163 2.169 Sp. Freq. (cyc./as.) 0 300 ψ (rad) 0 1 λ (µm) 2.163 2.169 Sp. Freq. (cyc./as.) 0 300 ψ (rad) 0 1 λ (µm) 2.163 2.169 Sp. Freq. (cyc./as.) 0 300 ψ (rad) 0 1 λ (µm) 2.163 2.169 Sp. Freq. (cyc./as.) 0 300 ψ (rad) 0 1 λ (µm) 2.163 2.169 Sp. Freq. (cyc./as.) 0 300 ψ (rad) 0 1 λ (µm) 2.163 2.169 Sp. Freq. (cyc./as.) 0 300 ψ (rad) 0 1 λ (µm) 2.163 2.169 Sp. Freq. (cyc./as.) 0 300 δφ (rad) 0 1 λ (µm) 2.163 2.169 Sp. Freq. (cyc./as.) 0 300 δφ (rad) 0 1 λ (µm) 2.163 2.169 Sp. Freq. (cyc./as.) 0 300 δφ (rad) 0 1 λ (µm) 2.163 2.169 Sp. Freq. (cyc./as.) 0 300 δφ (rad) 0 1 λ (µm) 2.163 2.169 Sp. Freq. (cyc./as.) 0 300 δφ (rad) 0 1 λ (µm) 2.163 2.169 Sp. Freq. (cyc./as.) 0 300 δφ (rad) 0 1 λ (µm) 2.163 2.169 Sp. Freq. (cyc./as.) 0 300
Differential visibility − 1
Closure phase
Differential phase
Differential visibility − 1
Closure phase
Differential phase
Differential visibility − 1
Closure phase
Differential phase
Differential visibility − 1
Closure phase
Differential phase
Differential visibility − 1
Closure phase
Differential phase
Differential visibility − 1
Closure phase
Differential phase
Fig. 2. Top-Left: The spectrum. The double-peaked emission line is the Brγ line. Top-Middle: The squared visibilities as a function of spatial frequency, Top-Right: the closure phases as a function of spatial frequency, Bottom-Left: the differential visibilities (visibilities normalized to 1 in the continuum), Bottom-Middle: the closure phase, and Bottom-Right: the differential phase, the three former as a function of wavelength. In all plots, different colours represent different nights, and the black lines (resp. the black dots for the top panels) represent our best-fit model. ”cycles/as.” or ”cyc./as.” means ”cycles per arc-seconds” or ”arc-seconds−1”. For the closure phase plot, the spatial frequencies are the ones of the longest baseline. In the squared visibilities panel, one can see that the disc is clearly resolved at the largest baselines.
– the measured phases are adjusted with a linear-fit to the trial ones instead of just offset. This is due to the way the wavelength-differential phase is obtained.
– the first image-reconstruction step is made using only squared visibilities and closure phases, and each narrow-band image is centred to its brightest point.
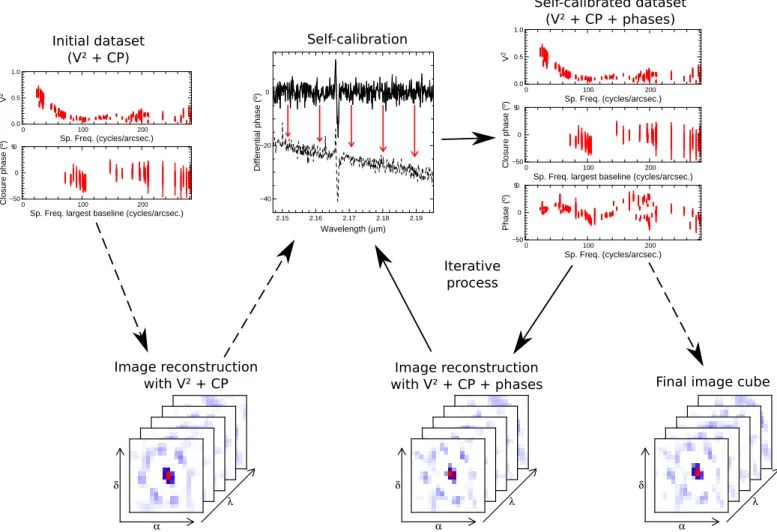
A sketch explaining this method is shown in Fig 3, and a summary of the procedure is described below:
1. We start the image reconstruction process for each wave-length from a set of squared visibilities and closure phases. 2. The images are centered on their brightest point to limit the
astrometric changes between these independent images. 3. Then, the self-calibration process itself is applied, by
com-paring the observed wavelength-differential phases (solid line in the middle-top panel of Fig. 3) to the phase computed from the image cube (hybrid map, dashed line in Fig. 3). The whole dataset is modified so that both the phase offset and slope match the image cube ones.
4. Then, the image reconstruction is performed again, adding the synthetic phases data to the squared visibilities and clo-sure phases.
5. The result of this image reconstruction step can then be input again into the self-calibration process (step 3.) or used as the final image cube.
In our case, we used two of these iterative steps to reach the final result. Using more iteration does not improve image quality, and at some point introduces images artifacts, like would do any other image-recovery process.
In complement to the described self-calibration algorithm, we used the following parameters in MIRA for the image re-construction: a quadratic regularization, and a Gaussian prior (to limit the effective reconstruction field of view to approximately 20-30 mas). These parameters set less constraints on the image reconstruction process than in other works, where a severe lim-itation of the reconstruction field of view (Monnier et al. 2007 ; Zhao et al. 2009) or assumptions on the circular-symmetry of the object (Le Bouquin et al. 2009 ; Chiavassa et al. 2010) were applied to reconstruct the images.
In the last processing steps, we are averaging all the contin-uum images to produce the contincontin-uum map and subtract the con-tinuum image from each spectral channel images to produce the emission-line images. We tried the overall process using random initial images to check the unicity of our solution, and checked
4 Millour et al.: Images of the spinning disc around HD 62623
Image reconstruction with V² + CP
Self-calibration
Image reconstruction
with V² + CP + phases Final image cube Initial dataset (V² + CP) Self-calibrated dataset (V² + CP + phases) Iterative process 2.15 2.16 2.17 2.18 2.19 −40 −20 0 Wavelength (µm) Differentia l phase ( o) α δ λ α δ λ α δ λ 0 100 200 0.0 0.5 1.0 0 100 200 −50 0 50 Sp. Freq. (cycles/arcsec.) V 2
Sp. Freq. largest baseline (cycles/arcsec.)
Closu re phase ( o) 0 100 200 0.0 0.5 1.0 0 100 200 −50 0 50 0 100 200 −50 0 50 Sp. Freq. (cycles/arcsec.) V 2
Sp. Freq. largest baseline (cycles/arcsec.)
Closu re phase ( o) Sp. Freq. (cycles/arcsec.) Phase ( o)
Fig. 3. The principle of the self-calibration algorithm applied to optical/IR interferometry. Solid arrows show processes that may be repeated several times, while dashed arrows show processes carried out once.
also on simulated datasets the consistency of the whole image reconstruction process.
4. Results
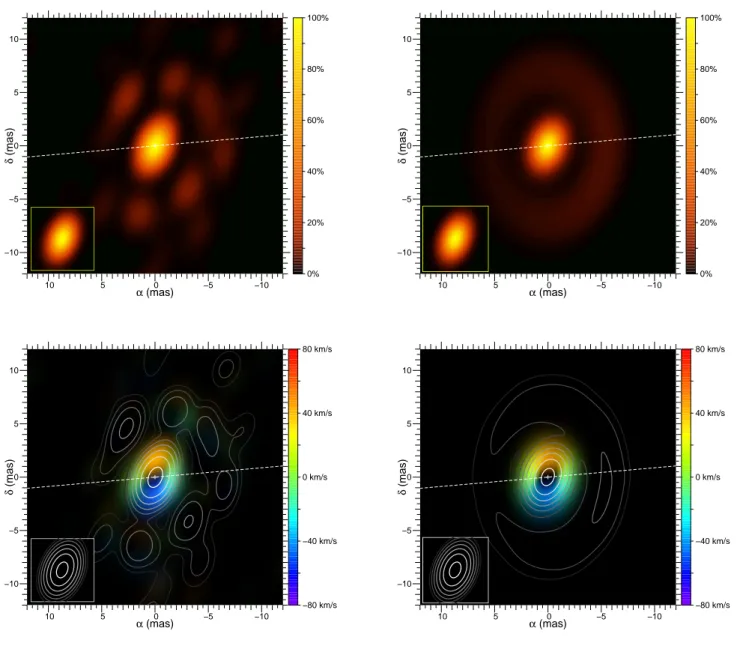
Figure 4 shows the obtained model-free image where we clearly see a ring of material of radius ≈6 mas (4 AU at 650 pc) encir-cling a bright inner spot of radius ≈2 mas (1.3 AU at 650 pc). The ring corresponds to the region of the previously-detected dusty disc by Meilland et al. 2010 where dust is heated at the sublima-tion temperature (inner rim), and the bright spot is a joint contri-bution from the star, and free-free and free-bound emission from an inner gaseous disc.
The continuum image does not show a clear elongation of the ring because of the elongated beam in the N-S direction, but clearly shows that the ring is brighter on the West side, com-pared to the East side. The inclination angle of the dust disc must therefore be intermediate (30 to 60o) and the position
an-gle of the major axis of the disc must be close to zero degrees, as we see a brighter emission zone opposite to the star and a dim-mer, hidden emission zone closer to us. This is compatible with the values predicted from mid-IR observations (position angle of 10±10o, inclination of 60±10o) and also with the measured po-larization angle by Yudin & Evans (1998): 95±5o, perpendicular
to the major axis of the disc.
Confirmation that the inner spot is partly composed of rotat-ing ionized hydrogen (observed here in Brγ) comes from the line
emission images, where we see the red-shifted emission appear-ing on the North side of the star, and the blue-shifted emission on the South side. At the line center, the emission is roughly symmetric and the elongation is directed to the East–West. This signal is a typical signature for a rotating disc. The Brγ emission in the disc vanishes rapidly with increasing radius. We argue that this is not only a consequence of the decreasing gas density, but also of the low (< 10000 K) star temperature, and, thus, of the larger neutral hydrogen fraction with increasing radius. No Brγ emission comes from the ring, which means the gaseous hydro-gen mixed with the dust is not ionized in this region.
The central star is unresolved by the VLTI in the continuum image, but we resolve the central gaseous disc. The lack of line emission in the very central region (see Fig. 6 and Sect. 6) im-plies that the VLTI resolved an apparent “cavity” (radius not ex-ceeding 1mas, i.e 0.65 AU) between the core regions including the A3Ia photospheric stellar source (producing an absorption component) and the emitting disc of plasma. This confirms that the star’s wind do not contribute significantly to the Brγ emis-sion, and provides an upper limit for its radius in accordance to its spectral type, i.e. 65-80 R⊙(for d=650 pc, 0.3 AU).
5. Modelling
To match our dataset in the continuum, we used a simple ge-ometrical model composed of four components: the star (de-scribed by an uniform disc with an absorption spectrum), the
OBSERVATION MODEL −10 −5 0 5 10 −10 −5 0 5 10 0% 20% 40% 60% 80% 100% α (mas) δ (mas) −10 −5 0 5 10 −10 −5 0 5 10 0% 20% 40% 60% 80% 100% α (mas) δ (mas) −10 −5 0 5 10 −10 −5 0 5 10 −80 km/s −40 km/s 0 km/s 40 km/s 80 km/s α (mas) δ (mas) −10 −5 0 5 10 −10 −5 0 5 10 −80 km/s −40 km/s 0 km/s 40 km/s 80 km/s α (mas) δ (mas)
Fig. 4. Top-Left: Composite aperture-synthesis image of HD 62623. The convolving beam of 1.75x2.76 mas is shown in the lower-left box at the same scale. The dashed line represent the polarization measurement from Yudin & Evans (1998). Top-Right: Our best-fit model plot at the same scale and convolved with the same beam. Bottom-left: Line images of HD 62623. The line intensity is plot as colours for different gas velocities. The intensity in the continuum is plot as gray contours (80%, 40%, 20%, 10%, 5%, 2.5% and 1.25% of the peak intensity). Bottom-Right: Our best-fit model line images with the same representation and the same convolving beam.
free-free and free-bound emission from the gas (described by an elliptical Gaussian disc), the inner rim of the dusty disc (de-scribed by an elliptical skewed ring) and the outer regions of the disc (described here by an extended background).
In addition, to match the data in the emission-line re-gion, we add an elliptical Gaussian-brightness component which is assigned the following combination of velocity fields (see Stee et al. 1995 ; Meilland et al. 2007 for typical applications of these velocity fields):
– a radial expansion velocity field of the form:
vr(r) = vr(0) + [vr(∞) − vr(0)][1 − R∗/r]γ
with vr(0) the expansion speed at the smallest radius, vr(∞)
the expansion speed at infinite radius, and γ the exponent of the power law.
– a rotation velocity field of the form:
vθ(r) = vθ(0) × rβ
with vθ(0) the maximum rotation speed of the disc. When β
equals -0.5, the disc is in Keplerian rotation, when β equals 1 the disc is in solid rotation, and when β equals -1, the disc has a constant angular momentum.
Parameters of the whole model range from angular sizes of the components (star, gas disc and dust disc), the system incli-nation angle, flux ratios between the star, the gas disc, and the
6 Millour et al.: Images of the spinning disc around HD 62623
dust disc, and also the rotation and expansion velocity, the expo-nents of the rotation and expansion law, in addition to the on-sky orientation angle.
This model produces intensity maps that are Fourier-transformed, and used to produce synthetic observables (squared visibilities, closure phases and differential phases). These syn-thetic observables are adjusted to the observed data using a com-bination of a gradient descent algorithm and a simulated anneal-ing algorithm. Given the large amount of observed data, we fitted this model having all parameters potentially free.
In addition to our global fit, we tested several typical models (i.e. fixing few parameters and leaving the other ones free in the fitting procedure described above), including: a model with free rotation and/or expansion laws, a pure Keplerian rotation law, and a solid rotation.
Our model-fitting shows that there is no or very little expan-sion in the disc around HD 62623, and that rotation is indeed at the core of the disc velocity law. To check that our best ob-tained model is located in an absolute minimum, we produced a
χ2 curve, starting from our best solution, fixing the β parameter to several values, and fitting the model to the data by using the method described above.
Our final reduced χ2is equal to 1.92 for a Keplerian-rotating disc model (See Fig. 5). We find a slightly lower χ2 for β =
−0.7, i.e. a rotation law between Keplerian rotation and Angular momentum conservation (see Table 2). However, all χ2 values, except for β ≈ 0, lie between 1.9 and 2.2. This basically means that the significance of this result is quite low, probably due to the little number of angular-resolution elements we have in the gas disc.
Parameter Unit Value
Flux∗ % total flux 34
R∗ mas 0.64
Aborption∗ % total flux 0.23
Absorption∗width µm 0.0006
Continuum Fluxgas disc % total flux 11
Continuum FWHMgas disc mas 1.39
Line Fluxgas disc % total flux 25
Line FWHMgas disc mas 1.16
β - -0.7
vθ(0) km·s−1 221
γ - 0.86
vr(0) km·s−1 0
vr(∞) km·s−1 0 Fluxdust rim % total flux 35
FWHMdust rim mas 13.9
Thicknessdust rim mas 4.9
Fluxextended disc % total flux 20
Disc inclination o 38
On-sky PA o 0
Table 2. Best parameters found for the AMBER HD 62623 dataset.
We conclude that, though the lowest χ2 values lie close to Keplerian rotation (i.e., rotation law exponent -0.5), our obser-vation only weakly contrain the rotation law of the gas disc. On the other hand, we can clearly rule-out expansion-dominated ve-locity fields (χ2 >4 for all models), confirming that rotation is indeed the main velocity field in the HD 62623 disc.
Ang. Mom. cons. Kepler Solid
−1 0 1 1.8 1.9 2.0 2.1 2.2 β χ 2
Fig. 5. χ2 curve obtained by fixing the β parameter to different values, and fitting the model to the data. Dashed vertical lines indicate several canonical rotation laws, and arrows represent χ2 values above 2.2.
6. Discussion
The spectrally and spatially resolved AMBER/VLTI observa-tions in the continuum and Brγ line of HD62623 bring unprece-dented information on the disc surrounding an A supergiant.
The central star appears unresolved by the VLTI in the con-tinuum image, providing an upper limit for its radius in accor-dance for its spectral type, i.e. 65-80 R⊙(resp. 130-160)
assum-ing d=650 pc (resp. 1300 pc) solar radii. The decrease of the line emission in the very central region, giving a doughnut-like shape for the integrated line flux (See Fig. 6), implies that the VLTI re-solved an apparent cavity in the innermost region of the emitting disc of plasma (radius not exceeding 1mas, i.e 0.65 AU), which includes the A3Ia photospheric stellar source. This implies that there is not enough emission in the vicinity of the central star to fill-in this lack of flux. This is a new and clear evidence that the star’s wind do not contribute significantly to the Brγ emission, and that the spectral type of the central source is not at odd with a normal member of its class. The disc of plasma is therefore at the origin of most, if not all of the emission lines seen the spectrum of HD62623.
The best conditions in terms of temperature and density to generate a Brγ flux are met close to the star, and the Brγ emission disappears rapidly with increasing radius. We can argue that this is not a only a consequence of the decreasing density, but also of the low (<10000k) star temperature and thus the relatively larger neutral hydrogen fraction with increasing radius.
How was such a dense disc formed? Even in the case the central star would be considered a fast rotator, its rotation rate is lower than the nearby rotating plasma (V sin i ranging from 35 to 80 km.s−1, depending on the work : see for instance Abt & Morell 1995, Levato 1972, Huang 1953, Westage 1933).
Previous work by Plets et al. 1995 provided evidence for a companion star to HD 62623, from radial velocity variations. In our images, no companion is detected to about 1% of the peak intensity (i.e. the typical flux level of image artifacts), an upper limit compatible with the low mass ratio inferred from
−10 −5 0 5 10 −10 −5 0 5 10 −25% 0% 25% 50% 75% 100% α (mas) δ (mas)
Fig. 6. Line-integrated flux from HD 62623, with the same scale and convolution as Fig 4. Solid contours are at 80, 60, 40, 20, 10 and 0% of the peak intensity. Dashed contours represent negative contributions. Note the doughnut-like shape of the line-emission.
the Doppler signal (mass of the companion of about 1-2 M⊙).
The angular momentum transfer from an orbiting companion may explain a Keplerian velocity field. Such an energetic argu-ment is widely used in the context of the lower mass evolved stars (van Winckel 2003). Furthermore, HD 62623 is a relatively cool source among massive stars, exhibiting a radiative wind not strong enough to easily justify the accumulation of such dense material in the orbital plane in its vicinity.
The spectroscopic observations of Plets et al. 1995 provide an orbital period of 131d or 161d. In the light of the VLTI maps, two options can be considered:
– one can place the companion close to the supergiant, in the detected cavity, and the plasma and dusty emission originates from a circumbinary disc,
– one can place the companion further away, perhaps close to the inner rim of the dusty disc. In this case, the disc of plasma is circumprimary, whereas the dust disc can be considered as circumbinary.
On the basis of the third Kepler’s law, one can exclude a sep-aration larger than 3 AU, since it would imply a total mass of the system larger than 100 Msun (for a period of 161 days). For the same reasons one can also exclude a separation much smaller than 1.5 AU, since it would imply a total mass smaller than few solar masses, i.e smaller than the current mass of the pri-mary assuming a supergiant luminosity class. As demonstrated in Plets et al. 1995, the mass-ratio is extreme and the primary harbors most of the mass. Hence, the probable separation has to be found within the smallest separations, in the range 1.2-1.7 AU.
Furthermore, assuming a circular orbit would imply a mini-mum velocity of about 250-350km/s, not compatible with any observational features detected to date. In particular, the low excitation [OI] forbidden line formed close to the dust form-ing region shows a double peak with a separation of 55 km/s, suggesting a continuity of the Keplerian kinematics from the dense regions probed by Hα or Brγ toward the dusty extended
ones. Furthermore, significant disturbances of the circumstel-lar medium would be expected that are not seen in the recon-structed images (which are, however, affected by a limited dy-namic range).
We favor the scenario proposed in Plets et al. 1995, that puts the companion very close to the star, within the Brγ emission-free cavity observed in our reconstructed images. An orbital ra-dius of 1.2-1.7 AU corresponding to a total mass of the sys-tem of about 15-20 solar masses corresponds at a distance of 650 pc (resp. 1300 pc) to 1.8-2.6 mas (resp. 0.9-1.3), and an ef-ficient transfer of angular momentum route may occur via the L2 co-orbiting Lagrange point, moving at a velocity of 130-170 km/s. Accounting for the new constraints on the system in-clination, this value is in accordance to the Hα and Brγ veloci-ties of 120 km/s inferred from the double peaks separation in the emission line, both transitions emitting efficiently from this lo-cation. This scenario also provides a natural explanation for the anomalously large mass-loss of the A3 supergiant, whose exter-nal layers should experience strong tides under the influence of the close companion.
7. Conclusion
These observations represent a new step in our understanding of the formation of flat, dense, Keplerian discs around evolved stars. These excretion discs share many physical characteris-tics with the accretion discs encountered around young stellar sources, and are now also unambiguously detected around binary post-AGBs, i.e. systems in which a low to intermediate mass star expels its remaining envelope, in the process of becoming a hot white dwarf (van Winckel 2003, van Winckel et al. 2006). In these low-mass binary systems, an efficient mass-transfer has oc-curred when one of the star gets giant, leading to the formation of potentially long-lived dusty discs. As such HD 62623 represents a missing link to the massive counterparts of these mass-losing stars, showing that a structured disc can also exist around such a highly luminous evolved star, and that this disc originates from the presence of a companion star.
A different mechanism might lead to the formation of flat-tened dusty structures around other massive stars, but this find-ing definitely opens a promisfind-ing route of interpretation of highly asymmetrical environments around massive stars in the frequent cases in which a low mass companion is suspected, albeit hardly detectable.
Detailed physical modeling of the AMBER and MIDI data and a more complete study of the self-calibration algorithm ap-plied to optical/IR interferometry will be presented in forthcom-ing papers.
The presented self-calibration imaging algorithm practically demonstrates the potential of using the wavelength-differential phase in an image-reconstruction process. This self-calibration method is easily applicable to optical/infrared interferometric data and improves greatly the quality of the reconstructed im-ages (which are now astrometrically linked from wavelength-to-wavelength).
In addition, this imaging method opens a wealth of possi-bilities that were considered as unfeasible before this paper: in-terferometric ”integral-field spectroscopy”, potentially reliable images from 2-Telescopes datasets, etc. This clearly opens new fields of research both in the signal processing domain (image synthesis techniques) and in the astrophysical domain (image-synthesis on ”faint” targets, where the number of combined tele-scopes will always be limited: YSOs and AGNs).
8 Millour et al.: Images of the spinning disc around HD 62623
Acknowledgements. We thank E. Thi´ebaut for providing the
image-reconstruction software MIRA, M. Kishimoto, L. Rolland, K. Ohnaka for fruitful discussions, A. Merand, and S. Stefl for supporting the observations. The Programme National de Physique Stellaire (PNPS), the Institut National en Sciences de l’Univers (INSU), and the Max Planck Institute for Radioastronomy (MPIfR) are acknowledged for their financial and observing time support. This research has made use of services from the Centre de Donn´ees de Strasbourg (CDS), from the Jean-Marie Mariotti Centre (JMMC), and from the NASA Exoplanet Science Institute (NExScI) to prepare and interpret the observations.
References
Abt, H.A. & Morrell, N.I. 1995, ApJ, 99, 135 Chiavassa A et al. 2010, A&A, 511, 51 Huang S., 1953, ApJ, 118, 285
Humphrey, R.M. & Davidson, K. 1994 PASP, 106, 1025
Kirshner, R.P. 2007 IUE and HST. AIP Conference Proceedings, 15 Kraus, s. et al. 2009, A&A, 497, 195
Lamers H.J.G.L.M & Pauldrach A.W.A 1991, A&A, 244, 5 Lamers, H.J.G.L.M. et al. 1998, A&A 340, 117
Le Bouquin J.-B. et al. 2009, A&A, 496, 1 Lee, U. et al. 1991, MNRAS 250, 432 Levato, O. 1972, PASP 84, 584 Maund J.R. et al. 2004, Nature, 427, 129 Meilland A., et al. 2007, A&A, 464, 59 Meilland, A. et al. 2010, A&A, 511, 73
Millour F. 2006, PhD thesis, Universit´e Joseph Fourier, Grenoble Millour F. et al. 2006, EAS, 22. 379
Millour F. et al. 2007, A&A, 464, 107 Millour F. et al. 2008, SPIE, 7013, 132 Millour F. et al. 2009, A&A, 507, 317 Monnier J.D. et al. 2007, Science 317, 342 Pauls T. et al. 2005, PAPSP, 117, 1255
Pearson, T.J. & Radhead, A.C.S. 1984, A&A, 22, 97 Petrov, R.G. et al., 2007, A&A , 464, 1
Plets, H., Waelkens, C. & Trams 1995, A&A, 293, 363 Podsiadlowski, P., & Joss 1989, Nature 338, 401 Porter J. 2002, A&A, 398, 631
Stee Ph. et al 1995, A&A, 300, 219 Tatulli, E. et al. 2007, A&A, 464, 29
Thi´ebaut E., Garcia P. & Foy R. 2003, 286, 171
van Winckel, H. 2003, Annu. Rev. Astron. Astrophys., 41, 391
van Winckel, H. et al. 2006 Memorie della Societa Astronomica Italiana, 77, 943 Westgate, C.A , 1933, ApJ, 78, 46
Yudin & Evans, 1998, A&As 131, 401 Zickgraff, F.J., 1985 A&A 143, 421 Zhao M. et al. 2009, ApJ, 701, 209