HAL Id: insu-01538381
https://hal-insu.archives-ouvertes.fr/insu-01538381
Submitted on 13 Jun 2017
HAL is a multi-disciplinary open access
archive for the deposit and dissemination of
sci-entific research documents, whether they are
pub-lished or not. The documents may come from
teaching and research institutions in France or
abroad, or from public or private research centers.
L’archive ouverte pluridisciplinaire HAL, est
destinée au dépôt et à la diffusion de documents
scientifiques de niveau recherche, publiés ou non,
émanant des établissements d’enseignement et de
recherche français ou étrangers, des laboratoires
publics ou privés.
Latitudinal beaming of Jovian decametric radio
emissions as viewed from Juno and the Nançay
Decameter Array
Masafumi Imai, William S. Kurth, George B. Hospodarsky, Scott J. Bolton,
John E. P. Connerney, Steven M. Levin, Alain Lecacheux, Laurent Lamy,
Philippe Zarka
To cite this version:
Masafumi Imai, William S. Kurth, George B. Hospodarsky, Scott J. Bolton, John E. P. Connerney, et
al.. Latitudinal beaming of Jovian decametric radio emissions as viewed from Juno and the Nançay
Decameter Array. Geophysical Research Letters, American Geophysical Union, 2017, 44 (10),
pp.4455-4462. �10.1002/2016GL072454�. �insu-01538381�
Latitudinal beaming of Jovian decametric radio emissions
as viewed from Juno and the Nançay Decameter Array
Masafumi Imai1 , William S. Kurth1 , George B. Hospodarsky1 , Scott J. Bolton2 ,John E. P. Connerney3 , Steven M. Levin4 , Alain Lecacheux5,
Laurent Lamy5,6 , and Philippe Zarka5,6
1Department of Physics and Astronomy, University of Iowa, Iowa City, Iowa, USA,2Space Science Department, Southwest Research Institute, San Antonio, Texas, USA,3NASA Goddard Space Flight Center, Greenbelt, Maryland, USA, 4Jet Propulsion Laboratory, California Institute of Technology, Pasadena, California, USA,5LESIA, Observatoire de Paris, CNRS, PSL, UPMC/SU, UPD, Place J. Janssen, Meudon, France,6Station de Radioastronomie de Nançay, Obs. Paris, CNRS, PSL, Univ. of Orléans, Nançay, France
Abstract
Two well-defined Jovian decametric radio arcs were observed at latitudinal separations of 11∘ –16∘ from the Juno spacecraft near Jupiter and the Nançay Decameter Array (NDA) at Earth on 17 May and 25 August 2016. These discrete arcs are from the so-called A source covering both Io-related and non-Io-related emissions. By measuring the wave arrival time at two distant observers with propagation time correction, the remaining delay times are 92.8 ± 1.3 min for the first arc and 116.0 ± 1.2 min for the second arc. This implies that both radio sources are not controlled by the orbital motion of Io but Jupiter’s rotation itself. The geometrical information for Juno and NDA and the loss cone-driven electron cyclotron maser instability theory provide these radio sources that are located at about 173∘ ± 10∘ in system III longitude projected onto Jupiter’s north surface and imply resonant electron energy ranges from 0.5 to 11 keV.1. Introduction
Due to complex interactions between Jupiter’s plasma and magnetic field, the planet is a prolific source of plasma and radio waves in a broad range of electromagnetic wavelengths. From the polar region just above Jovian aurora, the most intense radiation in decameter wavelengths (DAM) emanates in the frequency range of 1 to 40 MHz, which is widely observable from Earth-based radio telescopes above 10 MHz depending upon terrestrial ionospheric conditions and radio frequency interference [Carr et al., 1983; Zarka, 1998; Zarka et al., 2001; Clarke et al., 2004, and references therein]. A convenient organization for Jupiter’s DAM sporadic bursts is the probability of detection depending on the central meridian longitude (CML) in the Jovian system III coordinate system and the departure angle of the innermost Galilean moon Io from superior conjunction (Io phase) as seen by the observer. There are four main emission regions based on ground-based radio obser-vations, classified as the Io-related A, A’, B, and C sources [Carr et al., 1983; Garcia, 1996] according to the strong influence from Io [Bigg, 1964]. In the CML-Io phase diagram, these Io-related sources are confined at narrow Io phases around 90∘ and 240∘; the regions not controlled by Io are called non-Io-related B, A, and C in an increasing sequence of Jovian CML (e.g., see Figure 1b).
The first two-point common detections of Jovian DAM emissions were made from the Voyager spacecraft and ground-based radio telescopes in early 1979 [Maeda and Carr, 1984, 1989]. Maeda and Carr [1984] investi-gated the coordinated DAM observations of Voyager 1 and 2 and the Mizuho-cho Radio Observatory in Japan at 22 MHz at Jovicentric latitudes of 0.6∘, 3.1∘, and 7.4∘, respectively. As a result, they found that a number of non-Io-A storms were correlated, showing that the non-Io-A emission is emitted in quasi-continuous beams that are fixed in Jovian system III longitude. Maeda and Carr [1989] expanded this analysis by including more ground-based radio stations at fixed frequencies of 18.0, 20.0, 22.2, and 26.3 MHz and suggested that the width of the beam for non-Io-A storms also depends on frequency. The sparse multichannel analysis at several different stations at Earth includes unfavorable contributions from the terrestrial ionosphere and surround-ing radio interference. Therefore, due to the geometrical constraints of Earth-Jupiter-spacecraft lines and the
RESEARCH LETTER
10.1002/2016GL072454
Special Section:
Early Results: Juno at Jupiter
Key Points:
• Two decametric (DAM) arcs were observed from widely spaced latitudes by Juno and NDA • Direct evidence of long-lasting
DAM arcs corotating with Jupiter is presented
• The loss cone-driven CMI theory of fundamentalX-mode emission provides a constraint of the concurrent arcs Supporting Information: • Supporting Information S1 Correspondence to: M. Imai, masafumi-imai@uiowa.edu Citation:
Imai, M., W. S. Kurth, G. B. Hospodarsky, S. J. Bolton, J. E. P. Connerney, S. M. Levin, A. Lecacheux, L. Lamy, and P. Zarka (2017), Latitudinal beaming of Jovian decametric radio emissions as viewed from Juno and the Nançay Decameter Array, Geophys. Res. Lett., 44, doi:10.1002/2016GL072454.
Received 25 DEC 2016 Accepted 17 MAR 2017
©2017. The Authors.
This is an open access article under the terms of the Creative Commons Attribution-NonCommercial-NoDerivs License, which permits use and distribution in any medium, provided the original work is properly cited, the use is non-commercial and no modifications or adaptations are made.
Geophysical Research Letters
10.1002/2016GL072454
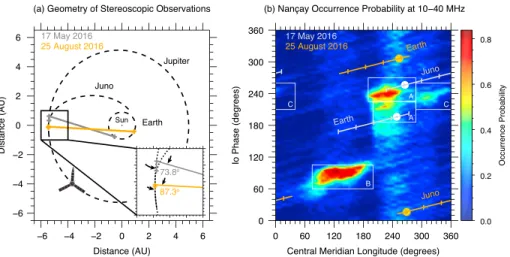
Figure 1. (a) Geometrical positions of Jupiter, Juno, and the Nançay Decameter Array (NDA) at Earth organized for two
occasions on 17 May and 25 August 2016, in which the gray and orange solid lines indicate the Earth-Jupiter-Juno lines. The horizontal and vertical axes are in the Heliocentric Earth Equatorial system, but the stereoscopic angles are computed from the Jupiter Solar Equatorial system. (b) Juno and Earth locations marked as a function of time in an Io phase-CML diagram, for intervals from 18:00 to 22:00 on 17 May and from 10:30 to 14:30 on 25 August (the corresponding dynamic spectra are shown in Figure 2). The circles correspond to the positions where a correlated discrete arc at each observer had a peak intensity at 23.5 MHz for the 17 May event and at 19.5 MHz for the 25 August event. The background occurrence probability map is based on 13 year ground-based radio observations from NDA [Leblanc et al., 1993, and references therein]. The white box regions were designated by Garcia [1996] on the basis of 39 year DAM observations at 18 to 22 MHz at the University of Florida Radio Observatory.
limitation of continuous spectral data obtained during the Voyager 1 and 2 flybys of Jupiter, there is a lack of understanding of the latitudinal beaming structures of Jovian DAM radiation.
The purpose of this paper is to report two concurrent DAM observations from the Juno spacecraft near Jupiter and a ground-based low-frequency radio observatory at Earth that are widely spaced in latitude over a broad frequency range of 10 to 40 MHz. These observations provide new information on the latitudinal beaming structure of the arcs as well as the geometrical location of radio sources in which the resonant electrons reside.
2. Observations
The first detection by the Juno spacecraft of Jovian DAM emission on 5 May 2016 was made at a distance of 515 radii of Jupiter (RJ; 1 RJis equal to 71,492 km) during Juno’s interplanetary cruise prior to the Jupiter orbit insertion on 5 July 2016. Since then, a new opportunity is provided to perform common DAM obser-vations with Juno and Earth-based radio observatories. The concurrent DAM radio emissions were captured by the Juno spacecraft, which is now successfully orbiting Jupiter, and the Nançay Decameter Array (NDA) in Nançay, France. The radio and plasma wave (waves) instrument onboard Juno is composed of one electric dipole antenna, one magnetic search coil sensor, and three onboard receivers that record the electric fields of waves from 50 Hz to 41 MHz and the magnetic fields of waves from 50 Hz to 20 kHz [Kurth et al., 2012]. The three onboard receivers monitoring five different frequency bands are named the low-frequency receiver and two redundant high-frequency receivers (HFRs). For the present study, we utilize only the higher-frequency band of the HFR (HFRH) having 38 linearly spaced channels from 3.5 to 40.5 MHz with a noise bandwidth of 666 kHz. Depending upon the mode operation of the instrument, the temporal resolution is selectable at 1, 10, or 30 s for one complete sweep of the HFRH data, but we use all of such various temporal resolutions in this study.
The NDA comprises 72 right- and 72 left-hand conical spiral antennas, occupying a total area of about 8000 m2 [Boischot et al., 1980; Lecacheux, 2000]. The effective area at 25 MHz corresponds to 4000 m2for each circular array. By means of electrical phasing and delay lines, Jovian radio tracking is available for about 8 h per day in a broad frequency range of 10 to 40 MHz. In the regular routine digital receiver employed in the NDA, a total of 400 linearly spaced channels is provided with a temporal step of 1 s and a noise bandwidth of 30 kHz. In this study, only right-hand polarized power from NDA is used. In short, the overlapping frequency range between Juno and NDA covers from 10 to 40 MHz, which monitors a large fraction of the Jovian DAM spectrum.
Figure 2. Two well-defined discrete Jovian decametric arcs observed from Juno and NDA on (a) 17 May and (b)
25 August 2016. The notations indicate the Jovicentric latitude and distance from Jupiter of the observer. The vertical lines on the NDA dynamic spectra correspond to hourly calibration signals, while the Juno dynamic spectra at 20.5–21.5 MHz were strongly attenuated due to the interference of a crystal oscillator aboard Juno. The orange plus symbols are the representative peak points at 23.5 MHz for the 17 May event and 19.5 MHz for the 25 August event. The simulated spectral arcs are displayed with red-color dotted lines using the loss cone-driven CMI theory and the VIPAL-CS magnetic field model. These arcs originate from the 187∘active magnetic flux tube atRmeq= 8(or at 176∘ system III longitude projected onto the Jovian surface).
3. Analysis and Modeling
In identifying concurrent DAM emissions with Juno and the NDA, a visual survey of Juno and NDA spectral data recorded during Juno’s approach and the two 53.5 day orbits of Jupiter (ranging from 5 May to 18 October 2016) was carried out. As a result, we found two events in which a well-defined discrete arc was measured by Juno and NDA on 17 May and 25 August 2016. Figure 1a shows the relative positions of Jupiter, Juno, and NDA at Earth as viewed from the north pole of the Sun, while Figure 1b summarizes the observational information concerning the Io phase and Jovian CML for the two events. It is obvious that the 17 May event intercepts the Io-A region as seen from Juno location and Io-A’ for Earth’s position. The 25 August event occurs in the non-Io-A source as viewed from both vantage points [Carr et al., 1983; Garcia, 1996].
The two well-defined discrete arcs from the Juno and NDA spectral data are presented in time-frequency diagrams for the 17 May event in Figure 2a and for the 25 August event in Figure 2b. The NDA’s temporal resolution is fixed at 1 s for these two events. The Juno dynamic spectra are sampled with a 10 s interval for the former event and with a 1 s step for the latter event. The maximum frequency of the arcs extends to 30.5 MHz and 27.5 MHz, respectively, as seen by Juno and 27 MHz as seen by the NDA. The absence of the upper frequencies from NDA may be related to the extinction of radio sources at high frequency. For the lower frequencies from NDA, it may be due to the radio wave propagation through the terrestrial ionosphere or the ground-based radio reception. We refer to the arcs in the 17 May and 25 August events as the correlated discrete arcs (CDAs) 1 and 2.
The delay between the arriving wavefronts at two distant stations includes essential information on the prop-agation of the radio waves, the location of the radio source, and the geometry of the three-dimensional beaming structure. By cross-correlating the Juno and NDA spectral data averaged in 30 s steps and 1 MHz steps, we estimate the delay times to be 133.3 ± 1.3 min and 168.7 ± 1.2 min for CDAs 1 and 2, respectively (see Figures S1 and S2 in the supporting information). This method is based on Imai et al. [2016], who mea-sured the beaming of Jovian millisecond bursts from multiple ground-based radio stations. To understand these delays, we first determine the light travel time difference between two receiving stations to be 40.5 min for CDA 1 and 52.7 min for CDA 2. After subtracting the light time delays, the remaining delays must be due to the rotation of the beam from one observer to the other. By taking into account the stereoscopic azimuth
Geophysical Research Letters
10.1002/2016GL072454
angles in Figure 1a, there are two primary candidates responsible for the rotation of the source: either the orbital motion of Io or Jupiter’s rotation itself. If the radio source corotates with the orbital motion of Io at a period of 42.46 h, the computed rotational times are 522.2 min and 617.7 min, which are much larger than the observed delays of 92.8 ± 1.3 min and 116.0 ± 1.2 min. If the radio source is fixed in Jovian system III lon-gitude, the calculated rotational times are 122.0 min and 144.4 min, which are closer to the observed times but still significantly different. In order to reconcile this problem, we introduce a contribution from the cross section of the beaming pattern as viewed from two latitudinally different observers. Nevertheless, both CDAs 1 and 2 should be corotated with the Jupiter’s rotation rather than the orbital motion of Io.
Another interpretation of the observational delay between Juno and NDA could be accounted for by the combination of the light travel time and a corotational lag due to the interaction between the Jovian magne-tosphere and the interplanetary magnetic field (IMF). Hess et al. [2014] showed that non-Io-related DAM arcs subcorotate with Jupiter at velocities ranging from 50% for IMF below 2 nT to 80% for IMF above 2 nT of rigid corotation. This subcorotation rate was determined by comparing dynamic spectra from NDA, Cassini, and Galileo data obtained from October to December 2000 when their observers varied in latitude from −0.9∘ to 3.7∘. However, it is well known that the variation of the Jovicentric latitude controls the appearance of the Jovian dynamic spectra based on the long-term ground-based radio observations at Earth [Carr and Desch, 1976; Barrow, 1981]. Additionally, Panchenko et al. [2010, 2013] studied the occurrence of periodic non-Io-DAM arcs using data from Wind, STEREO, and Cassini, finding that some non-Io-DAM arcs in the CML range of 300∘ to 60∘ show periods 1.5% longer than the system III period. In order to understand the characteristics of the latitudinal beaming for CDAs 1 and 2 (which are different from the periodic non-Io-DAM arcs analyzed in the works of Panchenko et al. [2010, 2013]), we use a fixed hollow cone model in which the observed arcs emanate with a thin axisymmetric hollow emission cone, whose aperture is the angle between the wave vector and the magnetic field. Furthermore, for simplicity, the observational time is converted into a function of CML. It is widely believed that the electron cyclotron maser instability (CMI) effectively leads to the generation of Jovian DAM radio emissions via a wave-particle interaction [Treumann, 2006, and references therein]. In this theory, the resonance condition under the mild relativistic framework and an unstable electron velocity distribution such as a ring shell or loss cone distribution play a key role in determining the wave normal angle (cone half-angle) of Jovian DAM beaming. We adapted the theoretical treatment of a relationship between the cone half-angle and the loss cone electron distributions as proposed by Hess et al. [2008]. By linking between the resonance circle and the loss cone opening angle of an electron loss cone velocity distribution function, the beaming cone half-angle Θ(f ), whose angle is measured from the local magnetic field vector at a radio source, may be given by
Θ(f)= arccos[(ve∕c ) ∕ √ 1 − f ∕fg,max ] , (1)
where veis a velocity of the resonant electron (or the resonant electron energy Ee = meve2∕2 with mebeing the mass of the resonant electron), c is the speed of light, f is the observed frequency equal to the local gyrofrequency at a radio source, and fg,maxis the maximum gyrofrequency on the foot of an active magnetic flux tube.
Modeling the observed discrete arcs of Juno and NDA with the fixed thin hollow cone was performed by tak-ing into account the geometrical configuration of radio sources and observers and a vital recipe of the loss cone-driven CMI theory in the following manner. (1) The radio sources are situated along the active magnetic flux tubes from the Jovian northern pole regions, and the radio wave propagates in a straight line to Juno and NDA from a source location at frequencies very close to the local gyrofrequencies. The former assumption is based on the fact that both CDAs 1 and 2 have the dominant right-hand polarized powers from NDA, which suggests that they originate from the northern pole regions as would be the case under the assumption that the Jovian DAM radiation is predominantly in the right-hand extraordinary (R-X) mode [Carr et al., 1983]. (2) For the determination of the source locations and cone half-angles, the Jovian magnetic field model used in this study is a combination of Jovian internal magnetic field model (either VIP4 [Connerney et al., 1998] or the VIPAL [Hess et al., 2011] model) and the washer-shaped current sheet model [Connerney et al., 1981], we hereafter call VIP4-CS and VIPAL-CS, respectively. (3) The positions of the observers are placed at the actual observed latitude of Juno and NDA but fixed at a radial distance chosen to be 1000 RJ. (4) The magnetic equator crossing distances, Rmeq, of the active magnetic flux tubes (similar to the McIlwan parameter L) are free parameters,
5.9, 8, 10, and 30. (5) The beaming forms a fixed thin hollow cone with 1∘ thickness [Kaiser et al., 2000;
Panchenko and Rucker, 2016]. (6) The fixed cone half-angle at 23.5 MHz for the 17 May event and at 19.5 MHz for
the 27 August event shown with orange plus symbols in Figure 2 provides a constraint on the emission angle once the location of radio sources and observers is fixed. (7) The corresponding resonant electron velocity is solved with the aid of equation (1). (8) Finally, the estimated resonant electron velocity is used for the compu-tation of the cone half-angle for each observed frequency through, again, equation (1), in order to reproduce the simulated spectral arcs, thereby compared with the observed spectral arcs.
Figures 3a and 3b show two-point observations at different latitudes as a function of Jovicentric latitude and Jovian CML. Due to the geometrical constraint and the spectral arc structures compared with the observation and simulation, the best fitting cone half-angles of beaming are about 75∘ ± 7∘ with Rmeqof 8, 10, and 30 for CDA 1 and with Rmeqof 5.9 and 8 for CDA 2. In both cases CDAs 1 and 2, the best fitting cone half-angles are the same or very close for each Rmeq, regardless of the magnetic field models. Furthermore, if we projected the active magnetic field lines that produce the observed arcs, onto the Jovian surface, the projected system III longitudes are confined within 173∘ ± 10∘ for both models. Accordingly, the resonant electron energy ranges from 0.5 to 11 keV.
Our projected 173∘ ± 10∘ system III longitude on Jupiter’s surface covers a distinctive region for Jovian low-frequency radio emissions. Imai et al. [2008], on the basis of all of the Cassini data during the Jupiter flyby, analyzed the occurrence probability of the non-Io-related emission from 4 to 16 MHz, revealing a V-shaped spectral structure between 9 and 16 MHz in the non-Io-B and non-Io-A sources. They proposed an angular beaming model whose cone half-angle diminishes as the observed frequency declines, which accounts for the V-shaped feature. Furthermore, this model demonstrated the possibility of the localized radio sources that were located in a longitude range of 180∘ ± 10∘ on the Jovian surface [Imai et al., 2008, 2011]. This is close to our estimated longitudes for the generation of the concurrent arcs.
Supposing that both arcs originate from the same active region, then Rmeq= 8 is the most likely origin field line. In addition to the observed arc spectral structures in Figure 2, the simulated arcs using the VIPAL-CS model are superimposed with red-color dotted lines. Concerning CDA 1, as the emission frequency varies from 15 to 30 MHz, the cone half-angle gradually changes from 78∘ to 69∘. Likewise for CDA 2, the beaming cone half-angle alters from 77∘ at 15 MHz to 71∘ at 27 MHz. Albeit not exact, they are in reasonably good agreement with the observed arcs. The 187∘ active magnetic field line was projected to 176∘ system III longitude on Jupiter’s northern atmosphere. Additionally, the resonant electron energies are estimated to be 6.4 keV for CDA 1 and 7.6 keV for CDA 2.
The beaming cone half-angle variations from our study and Imai et al. [2008] show opposite trends. This is a consequence of including the effect of the refraction index, a combination of electron plasma frequency and gyrofrequency, in equation (1) proposed by Ray and Hess [2008]. For the component below 10–12 MHz, the electron plasma frequency is a major factor controlling the emission angle. Ray and Hess [2008] modeled the Io-related arcs observed from Voyager, pointing out that the emission angle tends to increase from a few to 10–12 MHz and then decrease to the maximum emission frequency, 27–37 MHz. This tendency may resolve the discrepancy of our beaming variation for the component above 15–16 MHz and Imai et al.’s [2008] beaming variation for the component below 15–16 MHz.
Using the Voyager 1 and 2 data during their flyby of Jupiter, Boischot et al. [1981] initially pointed out the distinct existence of an isolated arc among numerous radio storms of Jupiter based on its strong intensity and the spectral structure of the arc. Most of such isolated arcs emerge from the A source region. Riddle [1983] postulated that such arcs are directly related to a magnetic field line connecting the orbital position of Io and Jovian ionosphere, demonstrating good agreement between the results of observations and computations. Modeling the arc structure is challenging owing to the subordinate functions of Rmeq, active magnetic flux tubes, and cone half-angles. Even for the well-defined Io-related arcs where the radio sources are located at
Rmeq = 5.9, the lead angle of active magnetic flux tubes and the resonant electron energy that is related to the cone half-angle are rarely unique [Hess et al., 2010]. In this study, we attempted to account for common isolated arcs observed at two widely spread observers in latitude by using a combination of the fixed hollow cone model and the loss cone-driven CMI theory. Our estimated radio source locations and resonant electron energy are one of the potential solutions.
Geophysical Research Letters
10.1002/2016GL072454
Figure 3. Modeling arcs as viewed from Juno and NDA at different latitudes and from radio sources mapped onto the
surface of Jupiter. (a, b) The best fitting cases are shown in the visibility of each observer at 23.5 MHz for the 17 May event and at 19.5 MHz for the 25 August event. The colors brown, blue, gray, and orange indicate the magnetic equator crossing distances of source field linesRmeqof 5.9, 8, 10, and 30. The notation in parentheses gives the fixed cone half-angle based on the VIPAL and the VIP4 models with the washer-shaped current sheet model. The center of the black horizontal lines corresponds to the observer position of either Juno or NDA, while the edges of the black horizontal lines are the maximum of the projected area where the 1∘thickness beam intersects the observer. Using the VIPAL and the current sheet model, the inset of Figure 3a shows the schematics of the fixed hollow cone model, whose edge corresponds to the color lines in Figures 3a and 3b. (c, d) The acceptable regions where the simulated and observed arcs are relatively matched in the sense of a spectral feature for the 17 May event and for the 25 August event are plotted as a function of computed resonant electron energy and projected system III longitude on Jupiter’s surface. In the inset of Figure 3d, the white-color projected system III longitudes are traced onto the Jovian surface along red-color magnetic fields lines. The values in parentheses indicate the projected system III longitude corresponding to the plus symbols of the best fitting cases in Figures 3a and 3b.
4. Summary
We have reported two correlated discrete arcs observed from the Juno spacecraft near Jupiter and the Nançay Decameter Array (NDA) at Earth on 17 May and 25 August 2016. The measured delay times at the two receivers are not consistent with the orbital motion of Jupiter’s volcanic moon Io but, instead, Jupiter’s rotation itself. This observational fact leads to the examination of the origin of such arcs by taking into account the geometri-cal configuration of radio sources and observers and the vital recipe of the loss cone-driven electron cyclotron maser instability (CMI) theory. As a result, we found the first arc lines on VIPAL-CS field lines that cross the equator beyond 8 RJand the second arc lines on field lines that cross the equator inside of 8 RJ. If these two arcs have a common origin, the 176∘ projected system III longitude on Jupiter’s surface at Rmeq= 8 is uniquely determined. The corresponding resonant energy is about 6–8 keV. The Rmeq= 8 field line suggests a linkage to the inner magnetosphere.
There are two unknown contributions to further consider the correlated discrete arc (CDA) at two latitudinally different observers. First, Hess et al. [2014] and Panchenko et al. [2010, 2013] found that some non-Io-DAM arcs subcorotate with periods other than system III, which influences the additional unknown parameter of the location of radio source at variable system III longitude for one emission to another. The second contribution is the oblique emission angle [Galopeau and Boudjada, 2016] from a radio source along an active magnetic flux tube, which affects the visibility of the emission at latitudinally different observers. Using only two CDAs from Juno and NDA cannot uniquely constrain these two contributions. From statistical points of view, collecting many CDAs from Juno and ground-based radio stations may aid in the estimation of these additional unknown parameters. Nevertheless, our initial modeling is a first step to understand the characteristics of the CDA. Jupiter’s DAM emissions are considered to be connected to various kinds of Jovian aurora along the same magnetic field line. Most of considerations focus on the Io footprint spot and tails for Io-DAM and the main oval emissions for non-Io-DAM. However, in the polar region connecting to the inner magnetosphere between the main oval emission and Io footprint, there are diffuse auroral emissions equatorward of the main oval [Radioti
et al., 2009] and transient isolated auroral patches [Mauk et al., 2002]. These emissions are attributed to
elec-tron scattering by whistler mode waves into the loss cone, thereby precipitating into the Jovian ionosphere. However, the trigger is differently related to the transition of pitch angle distribution for the equatorward diffuse auroral emissions, and the anisotropic hot plasma injection for the transient isolated auroral patches, which tend to provide the precipitated electron energy higher than 20 keV [Mauk et al., 2002]. Some of this electron energy might contribute to the generation of the isolated arcs studied in this paper.
Combining Juno and the Earth-based radio observatories yields a unique stereoscopic capability for analyz-ing the Jovian auroral radio emissions. Additionally, the CMI theory provides a useful constraint of the origin of the observed arcs. In extending the recent coordinated ground-based LWA1-NDA-URAN2 DAM observa-tions [Imai et al., 2016], more coordinated observaobserva-tions including Juno and ground-based radio observatories are anticipated. Also, by means of the Jovian Auroral Distributions Experiment (JADE) [McComas et al., 2013] onboard Juno, the direct comparison of the estimated electron energy from the coordinated DAM observa-tions and the in situ measured electron energy from JADE should give rise to a clear picture of wave-particle interactions associated with the Jovian auroral radio emission.
References
Barrow, C. H. (1981), Latitudinal beaming and local time effects in the decametre-wave radiation from Jupiter observed at the Earth and from Voyager, Astron. Astrophys., 101, 142–149.
Bigg, E. K. (1964), Influence of the satellite Io on Jupiter’s decametric emission, Nature, 203, 1008–1010, doi:10.1038/2031008a0. Boischot, A., C. Rosolen, M. G. Aubier, G. Daigne, F. Genova, Y. Leblanc, A. Lecacheux, J. de La Noë, and B. Møller-Pedersen (1980), A new
high-gain, broadband, steerable array to study Jovian decametric emission, Icarus, 43(3), 399–407, doi:10.1016/0019-1035(80)90185-2. Boischot, A., A. Lecacheux, M. L. Kaiser, M. D. Desch, J. K. Alexander, and J. W. Warwick (1981), Radio Jupiter after Voyager: An overview of
the planetary radio astronomy observations, J. Geophys. Res., 86(A10), 8213–8226, doi:10.1029/JA086iA10p08213.
Carr, T. D., and M. D. Desch (1976), Recent decametric and hectometric observations of Jupiter, in Jupiter, edited by T. Gehrels, pp. 693–737, Univ. of Ariz. Press, Tucson.
Carr, T. D., M. D. Desch, and J. K. Alexander (1983), Phenomenology of magnetospheric radio emissions, in Physics of the Jovian Magnetosphere, edited by A. J. Dessler, pp. 226–284, Cambridge Univ. Press, New York.
Clarke, J. T., D. Grodent, S. W. H. Cowley, E. J. Bunce, P. Zarka, J. E. P. Connerney, and T. Satoh (2004), Jupiter’s aurora, in Jupiter: The Planet, Satellites and Magnetosphere, edited by F. Bagenal, T. E. Dowling and W. B. McKinnon, chap. 26, pp. 639–670, Cambridge Univ. Press, New York.
Connerney, J. E. P., M. H. Acuña, and N. F. Ness (1981), Modeling the Jovian current sheet and inner magnetosphere, J. Geophys. Res., 86(A10), 8370–8384, doi:10.1029/JA086iA10p08370.
Connerney, J. E. P., M. H. Acuña, N. F. Ness, and T. Satoh (1998), New models of Jupiter’s magnetic field constrained by the Io flux tube footprint, J. Geophys. Res., 103(A6), 11,929–11,939, doi:10.1029/97JA03726.
Galopeau, P. H. M., and M. Y. Boudjada (2016), An oblate beaming cone for Io-controlled Jovian decameter emission, J. Geophys. Res. Space Physics, 121, 3120–3138, doi:10.1002/2015JA021038.
Garcia, L. N. (1996), Long-term periodicities in the Jovian decametric emission, PhD thesis, Univ. of Fla., Gainesville.
Hess, S., B. Cecconi, and P. Zarka (2008), Modeling of Io-Jupiter decameter arcs, emission beaming and energy source, Geophys. Res. Lett., 35, L13107, doi:10.1029/2008GL033656.
Hess, S., E. Echer, P. Zarka, L. Lamy, and P. Delamere (2014), Multi-instrument study of the Jovian radio emissions triggered by solar wind shocks and inferred magnetospheric subcorotation rates, Planet. Space Sci., 99, 136–148, doi:10.1016/j.pss.2014.05.015.
Hess, S. L. G., A. Pétin, P. Zarka, B. Bonfond, and B. Cecconi (2010), Lead angles and emitting electron energies of Io-controlled decameter radio arcs, Planet. Space Sci., 58(10), 1188–1198, doi:10.1016/j.pss.2010.04.011.
Hess, S. L. G., B. Bonfond, P. Zarka, and D. Grodent (2011), Model of the Jovian magnetic field topology constrained by the Io auroral emissions, J. Geophys. Res., 116, A05217, doi:10.1029/2010JA016262.
Imai, M., K. Imai, C. A. Higgins, and J. R. Thieman (2008), Angular beaming model of Jupiter’s decametric radio emissions based on Cassini RPWS data analysis, Geophys. Res. Lett., 35, L17103, doi:10.1029/2008GL034987.
Imai, M., K. Imai, C. A. Higgins, and J. R. Thieman (2011), Comparison between Cassini and Voyager observations of Jupiter’s decametric and hectometric radio emissions, J. Geophys. Res., 116, A12233, doi:10.1029/2011JA016456.
Acknowledgments
The authors are indebted to all members of the Juno mission team, especially the engineers and staff of the Juno Waves instrument. The research at the University of Iowa was supported by NASA through contract 699041X with the Southwest Research Institute and the Theodore Dunham, Jr. grant from the Fund for Astrophysical Research. The NDA is hosted by the Nançay Radio Observatory / Unité Scientifique de Nançay of the Observatoire de Paris (USR 704-CNRS, supported by Université d’Orléans, OSUC, and Région Centre in France). NDA observations are accessible online at http://www.obs-nancay.fr. Juno Waves Data used for this article are available through request to the authors and, subsequently, through the Planetary Data System.
Geophysical Research Letters
10.1002/2016GL072454
Imai, M., A. Lecacheux, T. E. Clarke, C. A. Higgins, M. Panchenko, J. Dowell, K. Imai, A. I. Brazhenko, A. V. Frantsuzenko, and A. A. Konovalenko (2016), The beaming structures of Jupiter’s decametric common S-bursts observed from the LWA1, NDA, and URAN2 radio telescopes, Astrophys. J., 826(2), 176, doi:10.3847/0004-637X/826/2/176.
Kaiser, M. L., P. Zarka, W. S. Kurth, G. B. Hospodarsky, and D. A. Gurnett (2000), Cassini and Wind stereoscopic observations of Jovian nonthermal radio emissions: Measurement of beam widths, J. Geophys. Res., 105(A7), 16,053–16,062, doi:10.1029/1999JA000414. Kurth, W. S., D. L. Kirchner, G. B. Hospodarsky, B. T. Mokrzycki, T. F. Averkamp, W. T. Robsion, C. W. Piker, D. A. Gurnett, M. Sampl, H. O. Rucker,
and P. Zarka (2012), The Juno Waves investigation, European Planetary Science Congress 2012, Madrid, Spain.
Leblanc, Y., A. Gerbault, L. Denis, and A. Lecacheux (1993), A catalogue of Jovian decametric radio observations from January 1988 to December 1990, Astron. Astrophys. Suppl. Ser., 98, 529–546.
Lecacheux, A. (2000), The Nançay decameter array: A useful step towards giant, new generation radio telescopes for long wavelength radio astronomy, in Radio Astronomy at Long Wavelengths, edited by R. G. Stone et al., pp. 321–328, AGU, Washington, D. C., doi:10.1029/GM119p0321.
Maeda, K., and T. D. Carr (1984), Beam structure of Jupiter’s decametric radiation, Nature, 308, 166–169, doi:10.1038/308166a0. Maeda, K., and T. D. Carr (1989), Multifrequency analysis of a decametric storm observed at Voyager 1 and ground-based observatories,
J. Geophys. Res. Space Physics, 94(A1), 115–120, doi:10.1029/JA094iA01p00115.
Mauk, B. H., J. T. Clarke, D. Grodent, J. H. Waite, C. P. Paranicas, and D. J. Williams (2002), Transient aurora on Jupiter from injections of magnetospheric electrons, Nature, 415, 1003–1005, doi:10.1038/4151003a.
McComas, D. J., et al. (2013), The Jovian Auroral Distributions Experiment (JADE) on the Juno mission to Jupiter, Space Sci. Rev.,1–97, doi:10.1007/s11214-013-9990-9.
Panchenko, M., and H. O. Rucker (2016), Estimation of emission cone wall thickness of Jupiter’s decametric radio emission using stereoscopic STEREO/WAVES observations, Astron. Astrophys., 596, A18, doi:10.1051/0004-6361/201527397.
Panchenko, M., H. O. Rucker, M. L. Kaiser, O. C. St. Cyr, J.-L. Bougeret, K. Goetz, and S. D. Bale (2010), New periodicity in Jovian decametric radio emission, Geophys. Res. Lett., 37, L05106, doi:10.1029/2010GL042488.
Panchenko, M., H. O. Rucker, and W. M. Farrell (2013), Periodic bursts of Jovian non-Io decametric radio emission, Planet. Space Sci., 77, 3–11, doi:10.1016/j.pss.2012.08.015.
Radioti, A., A. T. Tomás, D. Grodent, J.-C. Gérard, J. Gustin, B. Bonford, N. Krupp, J. Woch, and J. D. Menietti (2009), Equatorward diffuse auroral emissions at Jupiter: Simultaneous HST and Galileo observations, Geophys. Res. Lett., 36, L07101, doi:10.1029/2009GL037857. Ray, L. C., and S. Hess (2008), Modelling the Io-related DAM emission by modifying the beaming angle, J. Geophys. Res. Space Physics, 113,
A11218, doi:10.1029/2008JA013669.
Riddle, A. C. (1983), Identification of radio emission from the Io flux tube, J. Geophys. Res., 88(A1), 455–458, doi:10.1029/JA088iA01p00455. Treumann, R. A. (2006), The electron-cyclotron maser for astrophysical application, Astron. Astrophys. Rev., 13(4), 229–315,
doi:10.1007/s00159-006-0001-y.
Zarka, P. (1998), Auroral radio emissions at the outer planets: Observations and theories, J. Geophys. Res., 103(E9), 20,159–20,194, doi:10.1029/98JE01323.
Zarka, P., J. Queinnec, and F. J. Crary (2001), Low-frequency limit of Jovian radio emissions and implications on source locations and Io plasma wake, Planet. Space Sci., 49(10-11), 1137–1149, doi:10.1016/S0032-0633(01)00021-6.