HAL Id: hal-00135974
https://hal.archives-ouvertes.fr/hal-00135974v2
Preprint submitted on 30 Mar 2007
HAL is a multi-disciplinary open access
archive for the deposit and dissemination of sci-entific research documents, whether they are pub-lished or not. The documents may come from teaching and research institutions in France or abroad, or from public or private research centers.
L’archive ouverte pluridisciplinaire HAL, est destinée au dépôt et à la diffusion de documents scientifiques de niveau recherche, publiés ou non, émanant des établissements d’enseignement et de recherche français ou étrangers, des laboratoires publics ou privés.
Gamil Cassam-Chenai, John P. Hughes, Jean Ballet, Anne Decourchelle
To cite this version:
Gamil Cassam-Chenai, John P. Hughes, Jean Ballet, Anne Decourchelle. The blast wave of Tycho’s supernova remnant. 2007. �hal-00135974v2�
hal-00135974, version 2 - 30 Mar 2007
THE BLAST WAVE OF TYCHO’S SUPERNOVA REMNANT
Gamil Cassam-Chena¨ı and John P. Hughes
Department of Physics & Astronomy, Rutgers University
136 Frelinghuysen Road, Piscataway, NJ 08854, United States of America chenai@physics.rutgers.edu, jph@physics.rutgers.edu
and
Jean Ballet and Anne Decourchelle
UMR 7158, DSM/DAPNIA/SAp, CEA Saclay, 91191 Gif-sur-Yvette, France jballet@cea.fr, adecourchelle@cea.fr
ABSTRACT
We use the Chandra X-ray Observatory to study the region in the Tycho supernova remnant between the blast wave and the shocked ejecta interface or contact discontinuity. This zone contains all the history of the shock-heated gas and cosmic-ray acceleration in the remnant. We present for the first time evidence for significant spatial variations of the X-ray synchrotron emission in the form of spectral steepening from a photon index of∼ 2.6 right at the blast wave to a value of∼ 3.0 several arcseconds behind. We interpret this result along with the profiles of radio and X-ray intensity using a self-similar hydrodynamical model including cosmic ray backreaction that accounts for the observed ratio of radii between the blast wave and contact discontinuity. Two different assumptions were made about the post-shock magnetic field evolution: one where the magnetic field (amplified at the shock) is simply carried by the plasma flow and remains relatively high in the post-shock region [synchrotron losses limited rim case], and another where the amplified magnetic field is rapidly damped behind the blast wave [magnetic damping case]. Both cases fairly well describe the X-ray data, however both fail to explain the observed radio profile. The projected synchrotron emission leaves little room for the presence of thermal emission from the shocked ambient medium. This can only be explained if the pre-shock ambient medium density in the vicinity of the Tycho supernova remnant is below 0.6 cm−3.
Subject headings: acceleration of particles — cosmic rays — ISM: individual (Tycho, SN 1572) — supernova remnants — X-rays: ISM
1. Introduction
One of the most remarkable discoveries made by the Chandra X-ray Observatory is that most of the X-ray synchrotron emission from young ejecta-dominated supernova remnants (SNRs) is confined to bright and geometrically thin rims at the blast wave behind which there is little to no evidence for thermal X-ray emission from the shocked ambient gas. Such thin X-ray synchrotron emitting rims are now known to be common in young SNRs, having been detected in Cas A (Hughes et al. 2000; Gotthelf et al. 2001), the Kepler SNR (Bamba et al. 2005), the Tycho SNR (Hwang et al. 2002; Warren et al. 2005) and SN 1006 (Bamba et al. 2003; Long et al. 2003; Rothenflug et al. 2004), among others. The presence of X-ray synchrotron emission requires that the SNR blast wave produces extremely high energy electrons (> 1 TeV), thereby providing strong support for efficient particle acceleration at high Mach number shocks. The collisionless shocks in supernova remnants are believed to be the main sites of production and acceleration of Galactic cosmic rays (CRs), at least up to the “knee” (∼ 3000 TeV) of the CR spectrum. However, the new Chandra findings pose two important questions that have not yet been fully answered: (1) what is the underlying physical mechanism for the featureless thin X-ray filaments, and (2) where is the thermal X-ray emission from the shocked ambient medium?
Two interpretations have been proposed to explain the thin nonthermal X-ray filaments seen in young SNRs: synchrotron cooling or magnetic damping. In the first case, relativistic electrons accelerated at the shock lose energy efficiently in the amplified post-shock magnetic field and after advecting or diffusing a certain distance behind the shock their synchrotron emission falls out of the X-ray band (Ballet 2003; Vink & Laming 2003; V¨olk et al. 2005; Ballet 2006; Parizot et al. 2006). The other interpretation posits that the filaments are regions where the magnetic field has been amplified as well but where the rim widths are set by the damping length of the magnetic field behind the shock (Pohl et al. 2005).
Answering the first question posed above requires that we understand the history or temporal evolution of both the distribution of the accelerated particles and magnetic field at the shock and behind. In fact, because the magnetic field strength determines the intensity of the radiative losses and subsequent changes in the energy distribution of the most energetic electrons, it is the most critical ingredient. It is thus necessary to understand how the magnetic field behaves at the shock (is it amplified?) and how it evolves downstream (does it decrease and, if so, at what rate?). While theoretical studies suggest that the magnetic
field (specifically its turbulent component) may be significantly amplified at the shock (Lucek & Bell 2000; Bell & Lucek 2001; Vladimirov et al. 2006), it remains uncertain whether it is quickly damped on a timescale shorter than that of the energy losses of electrons (Pohl et al. 2005) or is simply carried along by the plasma flow in the downstream region. As we show below these two situations lead to different predictions about the spectral variations of the X-ray synchrotron emission and the relative radio and X-ray synchrotron morphology at the blast wave. Our results will be based on a picture in which the upstream magnetic field is a lot stronger than is generally assumed for the interstellar medium. Assuming only compression (by a factor of order 4), this allows us to simply model the above mentioned strong magnetic field amplification.
The other important problem is the absence of thermal X-ray emission from the shocked ambient medium in the region between the blast wave and the contact discontinuity in young ejecta-dominated SNRs. Because the blast wave also heats and compresses the ambient gas to X-ray emitting temperatures, a thermal X-ray component is expected in addition to the observed synchrotron emission. The strength of the thermal component depends on both the density of the ambient medium and the electronic temperature. It is unclear whether the lack of X-ray emission from the shocked ambient medium reflects a density or a temperature effect.
The absence of a complete theory on how collisionless shocks partition their energy into bulk motion, thermal, and relativistic particles does not allow us to calculate the post-shock electronic temperature directly from dynamical quantities. If particle acceleration is very efficient, the shock structure is modified with respect to the case with no acceleration: the interaction region becomes much thinner geometrically as well as cooler, which strongly influ-ences the resulting X-ray emission (Decourchelle et al. 2000; Ellison et al. 2004; Decourchelle 2005). Further, even in the absence of efficient shock acceleration, the electron temperature can vary widely depending on whether the thermal electrons and ions at the shock front share the same temperature value or the same velocity distribution. In the latter case the electronic temperature will be much less (by the mass ratio) than the ion temperature and the different populations will gradually evolve toward equilibrium on the timescale set by the particles exchanging energy through Coulomb collisions. In fact the two cases just mentioned represent the extreme ranges of a continuum of possible values that we parameterize in terms of the electron-to-proton temperature ratio at the blast wave. There is also a spatial varia-tion in the X-ray intensity and spectrum of the thermal emission from the shocked ambient medium. Right at the shock front, the shock-heated gas has a low ionization state, which results in little to no K-shell line emission in the X-ray spectrum. As the gas evolves behind the shock, it becomes increasingly more ionized and emission lines begin to appear. Setting a reliable constraint on the ambient density based on the lack of the thermal X-ray emission
requires careful attention to the physical issues outlined above (i.e., by understanding the history of the thermal particles in the shocked ambient medium).
We have chosen to address the aforementioned questions using the superb Chandra X-ray data of the remnant of the supernova event of 1572 that was observed by the Danish astronomer Tycho Brah´e. Now more than 430 years later, X-ray observations of the Tycho SNR (hereafter, Tycho) show that the matter ejected from the explosion (the ejecta) and heated by the reverse shock is distributed over an almost circular shell with an angular radius of ∼ 240′′. The recent advent of X-ray spectro-imagery has made it possible to identify
the major types of nucleosynthesis products and study their spatial distribution. This, in turn, constrains the temperature distribution in the shocked ejecta, the level of mixing and stratification between the different ejecta layers (Decourchelle et al. 2001; Hwang et al. 2002), the mechanism and energy of the explosion (Badenes et al. 2003, 2006) and allows us to quantify the development of Raleigh-Taylor instabilities (in the X-rays, Warren et al. 2005; Velazquez et al. 1998, in the radio).
In fact, the recent high resolution X-ray observations not only show a thick and clumpy shell of shocked ejecta but reveal the presence of thin (< 5′′) and smooth rims preceding the
ejecta by some ten arcseconds (more or less), with very faint emission in between (Hwang et al. 2002; Bamba et al. 2005; Warren et al. 2005). These sharp rims of X-ray emission demarcating the remnant’s extent are naturally interpreted as tracing the location of the blast wave. Similar rims are observed in other historical SNRs such as Cas A, Kepler or SN 1006, but in Tycho, they are much smoother and less structured which renders Tycho a perfect target for the study of the rims. Their apparently featureless spectra (Hwang et al. 2002) and the failure of thermal models to reproduce the observed radial profile of X-ray continuum emission suggest that most of the X-ray radiation from the blast wave is due to synchrotron emission by ultra-relativistic electrons (Cassam-Chena¨i et al. 2004; Warren et al. 2005; Ballet 2006).
This is supported by radio observations with high angular resolution (∼ 1′′) that show
a morphology comparable to the X-ray image as noted by Achterberg et al. (1994), although the thin radio rims are not as highly contrasted (Dickel et al. 1991; Reynoso et al. 1997). By comparison Tycho has a very different appearance in the optical band. The optical filaments at the rim show only Hα emission from nonradiative shocks (there is no radiative shock emission from either the ambient medium or ejecta) and appear mostly in the east and north (Ghavamian et al. 2000). The study of the most prominent optical knot on the eastern side yields a shock velocity of 1900− 2300 km/s, independent of distance (Smith et al. 1991; Ghavamian et al. 2001). The electron-to-proton temperature ratio associated with this knot was constrained to be less than 0.1 (Ghavamian et al. 2001). The eastern
and northern regions correspond to places where the SNR is possibly interacting with cold and dense clouds as suggested by Hi and CO observations (Reynoso et al. 1999; Lee et al. 2004). Radio (Reynoso et al. 1997) and X-ray (Hughes 2000) measurements indicate an average expansion rate for Tycho of 0.11−0.12 %yr−1, which corresponds to a shock velocity
of ∼ 3300 ± 1200km/s at an estimated, but still debated (Schwarz et al. 1995), distance of ∼ 2.3±0.8 kpc (Chevalier et al. 1980; Albinson et al. 1986; Smith et al. 1991; Ruiz-Lapuente 2004).
In Tycho, the observed closeness of the contact discontinuity to the blast wave (De-courchelle 2005; Warren et al. 2005) and the observed concavity of the synchrotron spec-trum in the radio (Reynolds & Ellison 1992) are suggestive of efficient particle acceleration. Besides, Tycho being the remnant of a thermonuclear explosion, its environment is expected to be uniform in density and magnetic field. This uniformity is supported by the quasi-circularity and regularity of the rims, and by the small separation between the blast wave and the contact discontinuity, as opposed to Cas A where the rims appear broken all around, and far from the contact discontinuity, a result likely due to its expansion in a stellar wind (Decourchelle 2005). These characteristics all together make Tycho a particularly well-suited remnant to investigate the problem of the lack of thermal X-ray emission from the shocked ambient medium in the context of efficient particle acceleration.
The goal of this paper is to address the above two important questions on the origin of the filamentary nonthermal morphology of the blast wave and lack of thermal X-ray emission from the shocked ambient medium. For that purpose we investigate the radial variation of the X-ray spectrum from the blast wave to the contact discontinuity (§3.1 and 3.2) and compare the rim morphology in Tycho in the radio and X-ray bands (§3.3). Results are interpreted and discussed with the use of a cosmic-ray modified hydrodynamic model of SNR evolution (§4).
2. Data
2.1. X-ray
We used the Chandra data of Tycho (obs id 3837) observed on 2003 April 29 with the ACIS-I imaging spectrometer in timed exposure and faint data modes. The X-ray analysis was done using CIAO software (version 3.3). Standard data reduction methods were applied for event filtering, flare rejection, gain correction. The final exposure time amounts to 145 ks.
of the Chandra X-ray Center website1 that we followed for the current analysis. Spectra
were always adaptively grouped so that each bin has a signal-to-noise ratio greater than 5 σ and we used XSPEC2 (version 12.2.1, Dorman et al. 2003) for the spectral modelling.
2.2. Radio
We used the 1.4 GHz VLA data of Tycho observed in 1994 and 1995 (Reynoso et al. 1997). These are the best currently available radio data in terms of spatial resolution (∼ 1′′).
Since the radio observations were done between 8 and 9 years before the X-ray obser-vations, we had to correct for the remnant’s expansion in order to compare both the radio and X-ray morphologies. For radial profiles, we simply shifted the radio emission by a con-stant value of 3′′. This corresponds approximately to an expansion rate of ∼ 0.35′′yr−1 or
∼ 0.14% yr−1 assuming a blast wave radius of 256′′. This is roughly consistent with the
average expansion rates of 0.113% yr−1 in the radio (Reynoso et al. 1997) and 0.124% yr−1
in the X-ray (Hughes 2000). Note that a shift of the radio profile by 4′′ would result in an
even better match of the sharp decline of the X-ray emission in various places around the remnant but this corresponds to a larger expansion rate of ∼ 0.18% yr−1. Recently a second
epoch Chandra observation of Tycho was approved in order to conduct a definitive X-ray expansion study.
3. Results
3.1. Radial variation of the synchrotron spectrum
3.1.1. Procedure
To search for radial spectral variations of the X-ray synchrotron emission, we selected regions where the thin rims at the blast wave are well defined and furthest from the shocked ejecta emission. Regions with large gaps were identified using the results of Warren et al. (2005), while examining the 4-6 keV continuum band image (see Fig. 1) to avoid regions where overlapping filaments occur at the rim. The regions are sectors chosen to have the largest possible extent in azimuth to include as many photons as possible. Radii were chosen
1
See http://cxc.harvard.edu/ciao/threads/.
2
to best follow the local curvature of the rim. Figure 1 shows the three regions that we selected (W, NW and NE). Depending on the flatness of the rim, our approach leads to vastly different sector radii of curvature. Table 1 (see label “Rim”) shows for instance that the resulting radius of curvature is far larger in the NE than in the W or NW, because the rim is nearly straight in the NE. Note that these local radii of curvature bear no relation to the radius of Tycho’s rim, which needs to be determined with respect to the remnant’s global center. The three azimuthally selected regions were divided radially into thin sectors one arcsecond wide from which X-ray spectra were extracted.
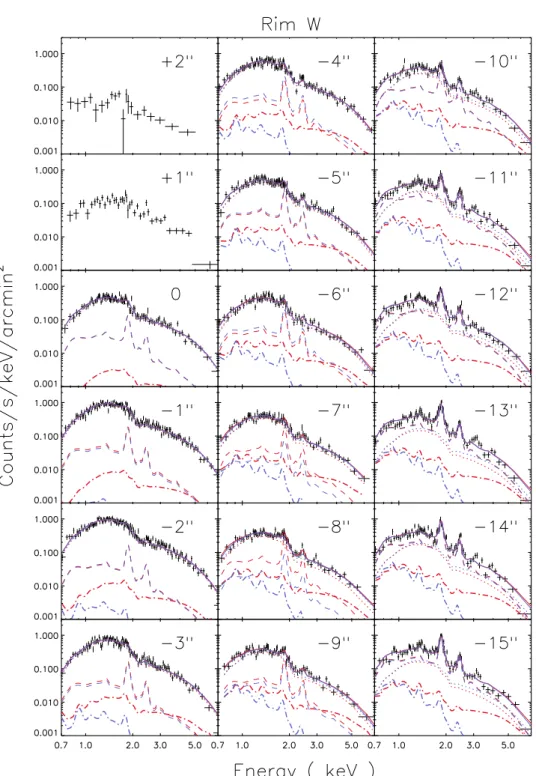
The spectra obtained through this procedure are illustrated in Figure 2, which shows the evolution of the X-ray spectrum for a particular region (rim W) as one moves in radially from the outer boundary of the remnant toward the interior. The first few X-ray spectra are characterized by a well defined continuum which is sometimes associated with very faint K-shell emission lines of silicon and sulfur. Then, as one moves further in, these emission lines become more and more intense, until they clearly stand out above the X-ray continuum. While the strong emission lines can be naturally attributed to the shocked ejecta (see Decourchelle et al. 2001; Warren et al. 2005), it is not clear whether the faint lines or other residual emission also come from the ejecta or whether they arise from shocked ambient medium.
Since we are searching for spectral variations of the X-ray synchrotron emission, we focus our attention on the continuum-dominated regions. There are two possible origins for such continuum: the thermal emission from the shocked ambient medium gas or the nonthermal emission from the accelerated particles. Because the morphology of the X-ray continuum emission and the quasi-featureless nature of the overall rim spectra cannot be explained by a thermal model in which most of the X-ray emission would come from the shocked ambient medium (Cassam-Chena¨i et al. 2004; Warren et al. 2005; Ballet 2006), we associate the continuum with the synchrotron emission from relativistic electrons.
3.1.2. Blast wave and contact discontinuity
Before proceeding to the spectral fits, we first describe how we locate the fluid discon-tinuities. Determining the precise radial position of the blast wave is somewhat delicate. Assuming spherical symmetry, the blast wave radius is given by the position where the emis-sion from the remnant drops to zero (after background subtraction). However, in practice one needs to account for the instrumental point-spread-function (PSF), which causes the region where the emission decreases to zero to broaden.
To take account of the PSF one needs to model the emission. We have fitted a projected shell model with either uniform or exponential emissivity profile convolved with the Chandra PSF (extracted at each particular rim), as done by Warren et al. (2005), to X-ray synchrotron brightness profiles (precisely, those that will be obtained in§3.1.4). This allowed us to derive estimates of both the blast wave position3 and width of the shell in the W, NW and NE rims
(see Table 2). For uniform or exponential emissivity profiles, we found an upper limit on the shell thickness of ∼ 0.6′′ in the W rim with even lower values < 0.4′′ in the NW and NE
rims. We note that the model profile for a thin spherical shell is less peaked than the data in the NW and NE rims, suggesting some deviation from our assumption of pure spherical symmetry. This procedure resulted in an accurate determination of the blast wave location for the three azimuthal regions.
We used the results of Warren et al. (2005) to determine the ratio of blast wave to contact discontinuity radii and their uncertainties in the three azimuthal regions. The numerical values are Rs/Rc ≃ 1.11 in the W rim and Rs/Rc ≃ 1.09 in both rims NW and NE with
uncertainties of order of 3 − 5%. In the numerical results we used Rs/Rc ≃ 1.113 (=
256′′/246′′) for the W rim. All these values are higher than the azimuthally averaged value
of 1.075 quoted by Warren et al. (2005). This is simply because we initially chose portions of the X-ray rims that were farthest from the contact discontinuity. In our analysis below we show how our results change as a function of Rs/Rc. Finally for completeness we note
that the contact discontinuity lies some 26′′, 20′′ and 18′′ behind the blast wave for the W,
NW and NE rims, respectively. In all cases the set of radial spectra we show do not extend this far into the remnant’s interior.
3.1.3. Power-law model
As a first approach to search for radial spectral variations of the synchrotron emission, we used a phenomenological power-law to model the different rim spectra ignoring line emission. While this is not appropriate for the inner regions with strong emission lines (but which may include a certain level of synchrotron emission due to projection effects), it is a very good model for the quasi-featureless outer regions (see Fig. 2).
Figure 3 shows the best-fit parameters derived from a simple power-law model (data points with the symbol
◦
) in the W, NW and NE rims. We show the power-law index (top3Emission from a shock precursor could in principle alter the estimate of the blast wave radius but the
X-ray synchrotron brightness profiles fitted with the convolved projected shell model allow little room for any precursor X-ray emission.
panel), the line-of-sight hydrogen column density4(second panel), the X-ray brightness (from
the fitted normalization of the power-law model at 1 keV) corrected for interstellar absorption (third panel) and the best-fit reduced χ2 (bottom panel) as a function of position behind
the blast wave. Starting from the blast wave, we see that the photon index increases over a few arcseconds where the X-ray synchrotron brightness is high. This is a first indication for radial variations of the synchrotron spectrum in the rims. Then, as we move further in, the photon index profile does not show a clear pattern anymore.
In fact, we note that the photon index and the absorption appear to be highly correlated (see in particular the NW and NE rims). Right at the edge of the remnant where the emission is the brightest, the absorption is highest. This is observed in three different widely-spaced places around the remnant. Since there is no reason for a sudden increase of the interstellar absorption precisely at the position of the bright rims all around Tycho, we believe this spatial variation to be spurious and related to an overly simplified spectral model for the interior emission. We therefore fixed the absorption to a local average value for each azimuthal region determined by averaging the best-fit absorption values between position 0 and position −4′′
where the rims are bright and featureless. This yields NH= 0.73× 1022cm−2 in the rim W,
0.66× 1022cm−2 in the rim NW and 0.65× 1022cm−2 in the rim NE.
Figure 3 shows the best-fit parameters derived from a simple power-law model with a fixed absorption (data points marked with
•
) in the W, NW and NE rims. We observe an even more remarkable increase of the photon index (top panel) over at least ∼ 5′′ behindthe blast wave where the regions have a quasi-featureless spectrum. In the three rims, the photon index starts at ∼ 2.6 − 2.8 at the shock and rises up to ∼ 3.0 − 3.2. The range in photon index variation is about 0.3− 0.4. The photon index profiles then reach a more or less uniform value further in.
In Figure 4, we demonstrate that the gradient of spectral index is robust to column density variations. However, it is important to have a good estimate of the interstellar ab-sorption because it determines the absolute value of the photon index, particularly important for broad-band non-thermal models. The strongest constraint other than that from rim spec-tra comes from the shocked ejecta X-ray emission (there is too much uncertainty associated with converting Hi data or optical extinction values to X-ray column densities). Therefore, we have fitted the ejecta spectra (see§3.1.4) using free neutral hydrogen column density. We found column density values roughly consistent with those quoted above for the featureless rims. Again, we find a slightly larger absorption in the W (NH = 0.72± 0.02 × 1022cm−2)
4
We used the solar abundance values from Anders & Ebihara (1982) for the calculation of absorption (WABS model in XSPEC).
than in the NW (0.66± 0.02 × 1022cm−2) and NE (0.61± 0.02 × 1022cm−2). Considering
these NH values as well as the ones derived from the simple power-law fits (see above), we
chose to fix the column density to an approximate mid-point value of NH= 0.7× 1022cm−2
for the subsequent analyses.
These pure power-law fits are clearly incomplete in that they do not account for obvious emission lines in the spectra. The presence of these lines argues for a thermal component that varies across the radial sequence. Further there is the possibility that the observed steepening in the featureless spectra may be due to this additional thermal component, which, being softer than the power-law component and growing in contribution moving inward, causes an apparent softening of the spectral index. To test this possibility, we study two specific situations where the thermal emission comes either from the shocked ejecta (§3.1.4) or from the shocked ambient medium (§3.1.5).
3.1.4. Power-law + ejecta template
To investigate how the observed steepening may be modified by the introduction of a shocked ejecta thermal component, we take for each sector (i.e., W, NW, and NE) a template model spectrum of the shocked ejecta and see how much of it can be included along with a power-law in the various radial regions. Each azimuthal region has a different template spectrum determined by fitting the data extracted from nearby inner regions of the remnant (see label “Ejecta” in Table 1) to single-component and constant-temperature non-equilibrium ionization (NEI) spectral models.
Figure 3 shows the best-fit parameters derived from a power-law model to which we add an ejecta component (
⋆
data points), with the absorption held fixed, in the W, NW and NE rims. We can see how the profile of the photon index (top panel) is modified by comparing to the single power-law model fits (•
data points). The spatial variations of the photon index profile are unchanged behind the blast wave, although there is some modification in the inner regions dominated by strong emission lines (see Table 3 for the rim W). As shown by the reduced χ2 profile (bottom panel), the introduction of the ejecta template improvesthe fit quality in the regions where emission lines are strong as we would have expected, but sometimes also in regions where the emission lines are faint (see rims W and NE). This latter point strongly suggests that small knots of shocked ejecta have nearly reached the blast wave where they contribute significantly to the X-ray emission. Figures 5 and 6 illustrate the respective contribution of the shocked ejecta and power-law components in the NW and NE regions.
We note, however, that the radial regions where the χ2 difference between models with
and without the ejecta template becomes important (bottom panel of Fig. 3), found at about −9′′ in the rims W and NW and −4′′ in the rim NE with respect to the blast wave,
do not correspond to the mean position of the contact discontinuity position. At these radii the featureless emission from the forward shock is still the dominant broadband spectral component. Rather, these locations likely represent the outermost “fingers” of shocked ejecta resulting from the Rayleigh-Taylor instability at the contact discontinuity. On average, the contact discontinuity lies much further in (see §3.1.2).
3.1.5. Power-law + NEI model
We consider now that the line emission could be entirely due to the shocked ambient gas instead of considering, as we did in the previous section, that such emission is associated with the ejecta material. Therefore we introduce, in addition to the power-law, a thermal component associated with the shocked ambient medium and see how this component affects the steepening of the power-law model found in our previous analysis.
The thermal model that we choose for this spectral analysis is a simple NEI model with solar abundances (here Anders & Grevesse 1989). The parameters of this model are the electronic temperature kTe, the ionization age τ ≡
Rt0
ts ne(t) dt where ne is the post-shock
electronic density and t0 − ts is the flow time (i.e., the time since shock-heating), and the
emission measure EX ∝ n2eV /D2 where V is the emission volume and D the distance to the
remnant.
When fitting the data with a power-law and the above thermal model (the absorption being fixed), spectral fits (not shown here) were, in the radial regions where emission lines are still faint, as good as or sometimes even slightly better than those obtained using the simple power-law model with fixed absorption. However, the model did not place the lines at the observed positions in the spectra of the quasi-featureless regions. In addition, there was no consistent pattern in the radial variation of the ionization age, while the ionization age of the inner regions was far too low to be consistent with the density required to explain the observed brightness.
Considering this last point, we introduce a new NEI model for the shocked ambient medium where both the ionization age and emission measure are consistent with the same post-shock electronic density. We refer to this as the “self-consistent plane shock NEI model” or SCPNEI for short. To use this model, we need to determine the flow time and the volume of each emitting region, which in turn gives the ionization age and the emission measure,
assuming a given value for the post-shock electronic density. To estimate the flow time, we used a semi-analytical hydrodynamical model (to be described in more detail in§3.2.1 below) that is capable of reproducing the observed ratio of the blast wave to contact discontinuity radii. We use the same flow time over the entire volume along the line of sight at a given projected distance from the shock (this is of course imperfect, the true flow time is shorter close to the shock in the front and in the back). The volumes are determined numerically. Each 1′′-wide region has then a single-component NEI model with its own ionization age
(fixed by the post-shock electronic density) and in which the electronic temperature is the only fitting parameter.
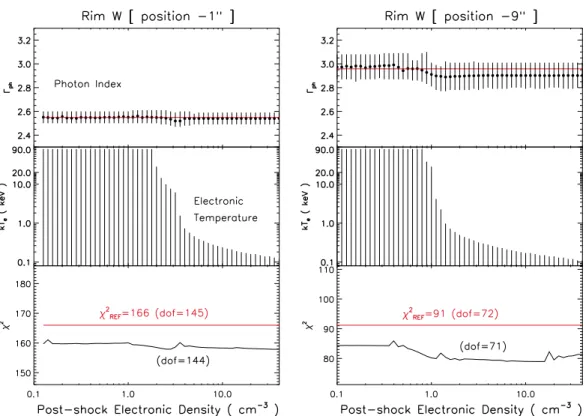
In the following, we restrict the analysis to rim W which has the highest statistics and where the contact discontinuity is the farthest from the blast wave. Volumes and flow times at each radial position behind the blast wave (i.e., 0,−1′′, . . . ,−15′′) are given in Table 4
(see the three first columns). For each position, we looked at the variations of the photon index, electronic temperature and χ2 of our power-law plus SCPNEI model as a function
of the post-shock electronic density. While we varied the post-shock electronic density over more than two orders of magnitude starting from 0.1 cm−3, we found the power-law index
profile to be very stable in the regions of lowest χ2. The largest differences in the spectral
index were about 0.1 which is far too small to affect the observed steepening.
3.1.6. Power-law + NEI model + ejecta template
Because we showed in §3.1.4 that introducing an ejecta template improves the fit very significantly, the previous procedure (§3.1.5) was repeated by introducing the ejecta template along with the power-law and SCPNEI model (see two examples in Fig. 7). For this ultimate case, very similar results were obtained in terms of stability of the power-law index steepening (top panel of Fig. 7). With the introduction of the SCPNEI model, the spectral fits are slightly improved compared to a power-law model plus ejecta template (bottom panel of Fig. 7). This is however only marginally significant (at most ∆χ2 ≡ χ2
REF− χ2 = −12 for
the inclusion of two additional parameters, where χ2
REF is the χ2 of the power-law plus ejecta
template model).
This method allows us, in addition, to constrain the electronic temperature as a function of the post-shock electronic density (middle panel of Fig. 7). Because we do not convincingly detect the shocked ambient medium, we use the power-law plus ejecta model as a reference and define the allowed domain as ∆χ2 < 0 (i.e., we require that the additional SCPNEI
component not degrade the fit). As expected, when the electronic density is low (below ∼ 2 cm−3 at position−1′′ and∼ 1 cm−3 at position−9′′), the range of allowed temperatures
is not constrained but as the density gets larger, a forbidden high-temperature regime appears (above a few keV at position −1′′ and above 1 keV at position −9′′).
3.2. Where is the shocked ambient medium?
The previous analysis has presented solid evidence for a spectral index variation in the synchrotron emission behind the blast wave in Tycho. We have also presented evidence for significant X-ray thermal emission from shocked ejecta far ahead of the contact discontinuity in the blast wave zone. However, evidence for a shocked ambient medium thermal component remains weak. The data are compatible with no such thermal component and provide constraints on its density and temperature. We found, in particular, that a large range of post-shock electronic densities were allowed when fitting the spectra at each individual position behind the blast wave with poor constraints on the electronic temperature for low densities. Even rather large density values were allowed as long as the electronic temperature was quite low. However there are constraints on the allowed post-shock temperatures that come from the hydrodynamic evolution of the remnant, as we utilize here.
3.2.1. CR-hydro NEI model
To better constrain the pre-shock ambient density, we use self-consistent temperature and hydrodynamical profiles whose parameters are determined from a semi-analytical model of cosmic-ray modified SNR hydrodynamics which borrows a 1-D similarity solution for the hydrodynamic variables. Our simulations based on this self-similar hydrodynamical calcula-tion are coupled with a nonlinear diffusive shock acceleracalcula-tion model, so that the backreaccalcula-tion of the particles accelerated at the blast wave is taken into account (see Decourchelle et al. 2000). This is important because these simulations, unlike those that treat the accelerated particles as test-particles, are able to reproduce the observed blast wave to contact discon-tinuity radii ratio of ∼ 1.11 that we found in rim W (see §3.1.2). This constraint results in an overall compression ratio, rtot, close to 6.
For a given ambient medium density, the hydrodynamic model provides radial profiles of the flow time, electronic density, ionization age and mean shock temperature from the blast wave to the contact discontinuity (Fig. 8). Assuming a given electron-to-proton temperature ratio at the blast wave, the electron temperature profile resulting from Coulomb collisional heating can be calculated from the mean shocked gas temperature and density profiles (Itoh 1977; Cox & Anderson 1982). The self-consistent NEI model that we introduce and will
use here (hereafter the “CR-hydro NEI” model) is based on these profiles, which we divided into several shells to match the number of zones in rim W (see Fig. 8). Each shell can be characterized by a set of average spectral parameters.
Because of projection effects, the NEI model of a given observed zone (i.e., here a 1′′-wide
sector region) is not the NEI model of the corresponding simulated shell. Indeed, each zone seen in projection onto the sky includes the contribution from a specific number of shells. Our CR-hydro NEI model in one zone is then the combination of several single-component constant-temperature NEI model from the shells. The volume contributions of the different shells to a given projected zone are computed numerically. These volumes and the post-shock electronic density, together with the distance (corresponding to the simulated blast wave radius, see Table 5) allow us to derive the emission measure of each single NEI model.
3.2.2. Initial parameters of the CR-hydro model
Cosmic-ray modified hydrodynamics models were run for different values of the ambient medium density (see Table 5). There are two different ways to match the observed radii ratio between the blast wave and contact discontinuity in the model. We could vary either the in-jection efficiency, ηinj, which is the fraction of total particles which end up with suprathermal
energies, or the unshocked upstream magnetic field, B0 (Berezhko & Ellison 1999; Ellison
et al. 2000). An increase in the injection efficiency increases the cosmic-ray pressure and then the overall compression ratio, while an increase in the upstream magnetic field increases the heating of the gas by the Alfv´en waves in the precursor region and then tends to reduce the overall compression ratio (see Berezhko & Ellison 1999). Since the closeness of the blast wave and contact discontinuity (radii ratio of ∼ 1.1) is suggestive of efficient particle accel-eration, we choose to set the injection parameter (ηinj) to a high value of 10−3 and adjust the
upstream magnetic field for each run (see Table 5). This case leads to lower post-shock gas temperatures than those derived from models with lower injection efficiency and hence more conservative limits on the value of the ambient density. Increasing ηinj to an even higher
value of 10−2 would in fact reduce further the post-shock pressure of the thermal particles
albeit only by something like 15%, which would not significantly increase our density limits. We fixed the ejected mass and kinetic energy of the ejecta to 1.4 M⊙and ESN= 1051ergs,
respectively, which are standard values for thermonuclear SNe. The age of the SNR was fixed to 430 years, approximately the age of Tycho. We choose a power-law index of the initial power-law density profile in the ejecta, n, equal to 7 so that the expansion parameter in the model (m = 1− 3/n = 4/7 ≃ 0.57) is consistent with the mean expansion parameter derived from the X-ray observations (0.54± 0.05, Hughes 2000). A slightly higher index n would
produce a narrower gap between the blast wave and contact discontinuity (in the test-particle limit, we have for instance Rs/Rc = 1.14 for n = 9 compared to Rs/Rc = 1.18 for n = 7)
but would clearly overestimate the remnant’s expansion rate (m≃ 0.67 for n = 9) compared to the observations. Below, we discuss the difference between the use of a power-law and exponential distributions for the initial density profile in the ejecta (see §4.1). We assume that the SNR evolves into an interstellar medium that is uniform in density and magnetic field and whose pressure is 2300 K cm−3.
The self-similar model is in principle not valid as soon as the reverse shock reaches the core (flat density profile) of the ejecta. For n = 7 and Mej = 1.4 M⊙, the mass in the ramp is
3
nMej = 0.6 M⊙. The mass swept-up by the blast wave, Msw, when the reverse shock reaches
that point is twice that for n = 7 (for no CRs), so the model is good for Msw < 1.2 M⊙.
This is reached somewhere between n0 = 0.1 cm−3 and 0.2 cm−3 in Table 5. This means
that the self-similar model does not apply to higher densities. In particular, to get the same blast wave to contact discontinuity radii ratio when the reverse shock is inside the ejecta core already would presumably require a larger compression ratio to begin with. Addressing that goes beyond the scope of this paper and would require use of a numerical hydrodynamical code.
3.2.3. Constraints on the ambient medium density
Figure 9 shows the results obtained from the modelling and spectral fitting of several radial regions in rim W. We plot the χ2 difference between a power-law + ejecta template +
our CR-hydro NEI model and a power-law + ejecta template as a function of the ambient medium density. We start from the blast wave (top panel, position 0) to the inner regions (bottom panel, position −9′′). The different curves correspond to different initial values of
the electron-to-proton temperature ratio at the blast wave (βs = 1 in solid lines and βs = 0.01
in dashed lines). Note that the introduction of the CR-hydro NEI model whose parameters are all fixed will not necessarily always improve the fit. We only show a few regions in Figure 9 where the ∆χ2 curve goes negative below a certain density.
The points where the χ2 difference is null correspond to strong upper limits on the
ambient medium density n0. For a given electron-to-proton temperature ratio βs at the
shock, these upper limits are more and more refined as we probe the innermost regions. The most stringent limits obtained at position−9′′ are n
0 .0.2cm−3 for βs = 1 and n0 .0.3cm−3
for βs= 0.01. We note that the case βs = 0.01 is not very different from the case of minimum
equilibration βs= βmin (where βmin is the minimum electron-to-proton temperature ratio at
(below ∼ 1 cm−3) as long as we stay near the blast wave (i.e., roughly between position 0
and position −15′′ in Fig. 8).
In Figure 10, we illustrate for the best-fit model the respective contributions of the power-law, shocked ejecta and shocked ambient medium for two extreme values of the electron-to-proton temperature ratio at the shock (βs = 0.01 and βs = 1) and an
ambi-ent density of n0 = 0.2 cm−3 favored by the X-ray data. Table 4 gives the associated photon
index values.
Our conclusion of this spectral analysis is that the ambient medium density must be less than 0.3 cm−3. This corresponds to a lower limit on the distance to the remnant of∼ 2.8 kpc
(Table 5) which is consistent with the upper limit range derived from optical observations (Chevalier et al. 1980; Smith et al. 1991) and in good agreement with the value derived from analysis of the historical light curve (Ruiz-Lapuente 2004).
3.3. Radio and X-ray radial profiles
3.3.1. Radio to X-ray comparison
The first observational test to determine whether the nonthermal X-ray rims are limited by the magnetic field or by the energy losses of the radiating electrons consisted of searching for radial variations of the X-ray synchrotron spectrum and particularly for radial variations of its slope (see §3.1). A second observational test, which also allows us to gain some insight into the spatial distribution of the magnetic field and accelerated electrons, consists of comparing radio and X-ray maps of the non-thermal emission at the rim (see §4.2). If the X-ray rims are limited by the synchrotron losses, the radio synchrotron emission should be much broader than the X-ray synchrotron emission because the radio-emitting electrons are not affected by radiative losses. If the X-ray rims are magnetically limited, one expects radio rims as well, but wider and with a smaller brightness contrast between the rim and far behind the rim (Pohl et al. 2005).
Figure 11 shows the radio and X-ray radial profiles of rims W, NW and NE. The X-ray radial profiles (data points marked with
•
, scale on the left) were obtained from the 2003 Chandra image in the 4-6 keV continuum energy bands which emphasize the thin rims at the blast wave. The radio profiles (solid lines, scale on the right) were obtained from the 1995 VLA image and were shifted by 3′′ to compensate for the remnant’s expansion. The samespatial regions were averaged in the radio image, using the X-ray-derived radii of curvature (Table 1). In this comparison, we implicitly assume that the radio flux did not change over 8 years. We note that the radio profiles from the NW and NE rims are similar in peak intensity,
while the W rim is about a factor of three fainter. The comparison between the radio and the X-ray profiles clearly shows that the X-ray rims have a radio counterpart characterized by a larger width and a smaller brightness contrast between the rim and the center in the NW and NE rims (but not in the W rim). This does not imply however that the X-ray rims are magnetically limited because the most critical constraints are the absolute radio flux and the ratio of X-ray to radio fluxes (see§4.2.6).
3.3.2. Confidence in the radio data
There is a contradiction between the radio profile presented in this paper (see Fig. 11), which were based on the data taken in 1994-1995 and presented by Reynoso et al. (1997), and the one obtained by Dickel et al. (1991) in the late 1980’s (see their Fig. 2). The profile presented by Dickel et al. (1991), a slice across the remnant that goes from S-SW to N-NE, shows a clear highly peaked outer filament on the N-NE side with a factor of four drop from this peak to the next valley. On the other hand, our attempt5 to reproduce the profile of
Dickel et al. (1991) with the radio data of Reynoso et al. (1997) shows at best a drop of only a factor of two. This difference is larger than what we would expect to obtain by changing the method to reconstruct the radio image. We did verify that profiles extracted from the radio data we have in hand match closely the profiles published by Reynoso et al. (1997).
This difference suggests a possible problem in either the radio data of Dickel et al. (1991) or those of Reynoso et al. (1997). In this paper, we chose to use the data presented by Reynoso et al. (1997) because they are the most recent. In addition, in the following analysis, because of the above uncertainties, we will try not to use local flux values extracted from the radio image as inputs for models. A careful study of the relative radio and X-ray nonthermal emissions needs better, and better characterized, radio data.
4. Discussion
The two astrophysical questions that we address in this paper can be simply expressed as follows: (1) why is the X-ray emission so bright at the blast wave and (2) why does the X-ray emission fall so rapidly to faint values behind the bright rim?
The first question aims to understand the origin of the rim morphology. Is the bright
5
Note that the declination value quoted in the caption to figure 2 of Dickel et al. (1991) is not given in proper sexigesimal notation and therefore may be in error.
X-ray synchrotron emission caused by a magnetic field locally very high at the blast wave or by the fact that the highest energy electrons cannot travel far from their acceleration site without losing energy so that their emission is concentrated to very thin regions just behind the blast wave (§4.2)?
The second question aims to understand the origin of the absence of thermal X-ray emission from the shocked ambient medium. Is this absence caused by a low ambient medium density so that the thermal X-ray emission is overwhelmed by the X-ray synchrotron emission or by a low temperature plasma presumably resulting from efficient particle acceleration so that the thermal emission is hidden by interstellar absorption or shifted below the X-ray domain (§4.1)?
4.1. The dark side of the rim
In light of the results we present in §3.2, we conclude that the lack of thermal X-ray emission from the shocked ambient medium between the blast wave and the contact discontinuity essentially reflects a low density in the ambient medium around Tycho.
At the blast wave, we found that the most stringent upper limit on the ambient medium density is about 0.9 cm−3 if electrons and protons are in temperature equilibrium and 1 cm−3
if there is no equilibrium (§3.2.3 and top panel of Fig. 9). With these values, the thermal contribution from the shocked ambient medium increases far too much in the inner regions to be hidden by the interstellar absorption. Therefore the inner zones provide even tighter constraints: the ambient medium density must in fact be lower than 0.3 cm−3.
Our results were obtained from a spectral analysis based on different components to model the emission from the shock-accelerated particles, the shocked ejecta and the shocked ambient medium. In particular the characteristics of the shocked ambient medium were derived from CR-hydrodynamic models able to match the observed radii ratio between the blast wave and contact discontinuity as well as the observed expansion measurements. This is only possible if particle acceleration is efficient (Decourchelle 2005; Warren et al. 2005).
In that case and for any ambient density, we found from our model that the range of electronic temperatures allowed in the radial regions free from strong line emission is between 5 keV and 20 keV if electron and proton temperatures are equal at the shock, and between 0.2 keV and 2 keV if not (see Fig. 8). This eliminates the possibility that CR hydro models, which satisfy the observed radii ratio, could lead to a temperature sufficiently low that the emission of the shocked ambient medium gets shifted to the extreme UV range. This does not seem to be a viable explanation for the lack of thermal X-ray emission from the shocked
ambient medium.
We note that our derived upper limit value of 0.3 cm−3, which does not depend on the
details of the shocked ejecta emission, is inconsistent (lower by a factor∼ 3−4) with the value found by comparing the observed global thermal X-ray properties of the shocked ejecta with predictions from various models of thermonuclear explosions (Badenes et al. 2006). There are a number of differences between this published study and the one we present here (e.g., the density profile of the ejecta, whether or not efficient shock acceleration is included, whether or not similarity solutions are used for the hydrodynamics) and both are based on only one-dimensional hydrodynamics.
If we have underestimated the observed size of the gap between the blast wave and the contact discontinuity by a factor of two, i.e., if the ratio of radii were in reality∼1.2 (which is roughly the value expected in the test particle case for n = 7, then a higher ambient medium density would be possible since this would result in a smaller compression ratio (rtot ∼ 4),
the ionization age would increase less rapidly behind the blast wave and the volume of our regions would slightly decrease (because the distance would be reduced). But this would be no more than a factor of 2 leading to an ambient density of n0 ∼ 0.4 − 0.6 cm−3. An
overestimate of the gap by a factor 2 (i.e., a ratio of radii of ∼ 1.06 resulting in rtot ∼ 10)
would reduce the estimate on the ambient medium density by the same factor making n0
of order 0.1− 0.2 cm−3. A factor of more than two error in our estimate of the size of the
gap in either direction is unlikely. A case of lower injection efficiency (e.g., ηinj = 2× 10⁻⁴)
would lead to a higher mean shock temperature compared to the case with ηinj= 10−3; this
can only lower the density estimate (see second panel of Fig. 7).
Our use of a power-law initial ejecta density profile is also a possible source of un-certainty. By examining density profiles generated by thermonuclear SN explosion models (e.g., Hoeflich & Khokhlov 1996), Dwarkadas & Chevalier (1998) conclude that an exponen-tial profile is a reasonably good simple representation for the iniexponen-tial ejecta density profile. When evolving these profiles to the remnant stage in a uniform density environment, they find that the power-law and exponential profiles produce similar density and temperature structures in the shocked ambient medium (while they find large differences for the profiles in the shock heated ejecta, which we do not study here). The largest difference between the density profiles in the shocked ambient medium (see Fig. 3 in Dwarkadas & Chevalier 1998) is no more than a factor of two (with the exponential case falling below the power-law case). Both temperature profiles are basically flat right behind the blast wave (i.e., where we extracted the spectra) and increase more or less rapidly only very close to the contact discontinuity (again, a region that we do not study). Although these calculations do not include the effect of efficient diffuse shock acceleration, they should be indicating roughly the
level of difference between the power-law and exponential density profiles. Ellison & Cassam-Chena¨ı (2005) have generated radio surface brightness profiles for thermonuclear remnants assuming power-law and exponential profiles when shock acceleration is efficient (see their Fig. 11) from which it is possible to estimate how the ratio Rs/Rc differs. Extrapolating
their n = 9 power-law results to the n = 7 power-law ejecta case we used here suggests that there is little difference in the ratio of radii compared to the exponential case. In summary, based on admittedly limited published results, we estimate that using an exponential ejecta density profile could result in an increase in the inferred ambient medium density of up to a factor of 2.
4.2. Origin of the rim morphology
The objective of the present discussion is to understand why most of the X-ray syn-chrotron emission is confined in narrow rims at the blast wave.
4.2.1. The two interpretations
There are currently two alternatives to explain such morphology. The first one stipulates that the highest energy electrons cannot travel (by advection or diffusion) far from their acceleration site - presumably the blast wave - without suffering from efficient energy losses due to synchrotron radiation so that their emission is concentrated to very thin regions (Ballet 2003; Vink & Laming 2003). To produce enough radiative losses this interpretation requires a rather high magnetic field within the rims, which presupposes that the field must have been amplified at the blast wave (V¨olk et al. 2005; Ballet 2006; Parizot et al. 2006). Such turbulent amplification of the magnetic field in collisionless shock waves was already suggested on the basis of theoretical investigations (Bell & Lucek 2001) and simulations (Lucek & Bell 2000). The second possibility recently suggested by Pohl et al. (2005) is that the observed X-ray rims may in fact reflect the spatial distribution of the magnetic field rather than the spatial distribution of the high-energy electrons. This interpretation assumes also a certain level of amplification of the magnetic field at the blast wave (or in the precursor) and imposes its decrease behind, resulting from the relaxation or damping of the turbulence, on a timescale shorter than the characteristic time for electrons to lose energy by synchrotron radiation.
The fundamental difference between these two interpretations lies in the post-shock evo-lution of the magnetic field (advected or damped) or equivalently in its ability to modify the
energy of the X-ray-emitting electrons through synchrotron losses and thereby modify their spatial distribution. Hence, our initial problem on the origin of the rim morphology is noth-ing more than a problem related to the evolution of the magnetic field behind the blast wave. In the following, we will attempt to determine the magnetic field characteristics/properties (i.e., its intensity at the shock and behind) and the parameters of the acceleration (i.e., the injection efficiency, the maximum energy of the shock-accelerated electrons, and the density ratio between the relativistic electrons and protons), by comparing the associated modelled synchrotron emission properties (i.e., brightness and photon index) with those derived from the observations. There are a large number of observational constraints which allow us to strongly constrain the previous parameters: the ratio of radii between the blast wave and contact discontinuity, the width of the X-ray rims, the X-ray spectral variations behind the blast wave (§3.1), the radio and X-ray brightness (§3.3), and the upper limit on the ambient medium density (§3.2).
4.2.2. CR-hydro model and particle spectra
To compute the properties of the synchrotron emission, we take advantage of the CR-modified hydrodynamic model of SNR evolution that we used previously to estimate the density in the ambient medium (see §3.2).
For a given CR injection efficiency, ηinj, and ambient density, n0, the CR-hydro model
provides the CR proton spectrum at the blast wave at any time. It is a piece-wise power-law model with an exponential cutoff at high energies:
fp(E) = a E−Γ(E) exp (−E/Ep,max) , (1)
where a is the normalization, Γ is the power-law index which depends on the energy E, and Ep,max is the maximum energy reached by the protons. Typically three distinct energy
regimes with different Γ values are assumed (Berezhko & Ellison 1999). The normalization, a, is proportional to ηinj and n0. The CR electron spectrum is determined by assuming a
certain electron-to-proton density ratio at relativistic energies, Kep, which is defined as the
ratio between the electron and proton distributions at a regime in energy where the protons are already relativistic but the electrons have not yet cooled radiatively (e.g., Ellison et al. 2000). In the appropriate energy range, the CR electron spectrum is then:
fe(E) = a KepE−Γ(E) exp (−E/Ee,max) , (2)
where Ee,maxis the maximum energy reached by the electrons. Kepis left as a free parameter
(e.g., Ellison et al. 2000; V¨olk et al. 2002) and will be adjusted using the X-ray data (see §4.2.5). We will obtain typically Kep ∼ 10−3 (see §4.2.6).
The maximum energies Ep,max and Ee,max contain information on the limits of the
ac-celeration. They are set by matching either the acceleration time to the shock age or to the characteristic time for synchrotron losses, or by matching the upstream diffusive length to some fraction ξs of the shock radius (i.e., escape limitation), whichever gives the lowest
value. We took ξs= 0.05. When the maximum energy of the electrons is limited by radiative
losses, we have: Ee,max = 3 m2 ec3 2 e3/2 s (r− 1)/r r + 1/rB k0−1/2B2−1/2Vs, (3)
where r and rBare the overall density and magnetic field compression ratios, B2the
immedi-ate post-shock value of the magnetic field, Vsthe shock speed, and k0 ≡ D(Ee,max)/DB(Ee,max)
the ratio between the diffusion coefficient, D, and its Bohm value, DB, both at Ee,max (see
Parizot et al. 2006). With typically r≃ 6 and rB≃ 5 (see §4.2.3), we obtain:
Ee,max≃ 7.3 k0−1/2B−1/2100 Vs,3TeV, (4)
where B100 is B2 in units of 100 µG, and Vs,3 is Vs in units of 1000 km/s. In Eq. (2), Ee,maxis
left as a free parameter (via k0) and will be adjusted using the X-ray data (see §4.2.5). We
will obtain typically k0 ∼ 10 making Ee,max ∼ 10 TeV. Finally, for simplicity, we assumed
the Bohm value and regime for the diffusion coefficient of relativistic protons. Because the protons affect the modelling only via their total energy density, our results are not very sensitive to Ep,max.
Once the particle distributions associated with their respective fluid elements are pro-duced, they evolve downstream experiencing adiabatic and eventually synchrotron losses (as described in Appendix B). Then, using the electron distributions, the synchrotron emission within the remnant can be calculated, provided that the magnetic field structure is known within the remnant.
4.2.3. Magnetic field profiles
We present four configurations of the downstream magnetic field as a function of radius (normalized to the contact discontinuity) as illustrated in Figure 12: two where the magnetic field is damped (left panels), and two where the magnetic field is simply advected behind the shock, i.e., it is passively carried by the plasma flow (right panels). Appendix A explains how we evolve the magnetic field associated with each fluid element and then how the magnetic field profiles were obtained. Anticipating the results we obtain below, for each magnetic field behavior (damped or advected), we show a case with an injection efficiency, ηinj, of 10−3 and pre-shock magnetic field, B0, of ∼ 45 µG, and one with a lower injection
efficiency of 1.4× 10⁻⁴ and lower but still high pre-shock magnetic field of ∼ 25 µG. Unless
explicitly stated, these two cases are always given for an ambient density, n0, of 0.2 cm−3
and a kinetic energy of the explosion, ESN, of 1051ergs. The case with ηinj= 10−3 produces
very efficient diffusive shock acceleration, and the case with ηinj = 1.4× 10⁻⁴ yields a less
efficient acceleration but still with some fraction of the energy flux crossing the shock going into relativistic particles and where the back reaction of shock-accelerated protons on the hydrodynamics is still important.
The values obtained for the unshocked magnetic field, B0, are clearly several times
higher than the typical interstellar magnetic field of a few µG. We implicitly assume that B0
has been already significantly amplified by some instabilities provided, for example, by the streaming of accelerated CRs in the precursor (see Bell & Lucek 2001; Pelletier et al. 2006; Marcowith et al. 2006). Assuming the magnetic turbulence to be isotropic ahead of the shock, the magnetic field downstream is then larger than upstream by a factor rB =p(1 + 2 r2tot)/3.
Since the ratio of radii between the blast wave and contact discontinuity in the W rim constrains the overall compression ratio, rtot, to a value of 6 (see §3.2.1), we have rB ≃ 5.
This leads to an immediate post-shock magnetic field, B2, equal to∼ 215µG when ηinj= 10−3
and ∼ 130 µG when ηinj = 1.4× 10⁻⁴. These two sets of (ηinj, B2) will allow us to describe
fairly well the X-ray data, i.e., the intensity of the X-ray rims (assuming a reasonable Kep
ratio), their width and the spatial variations of the X-ray photon index.
Figure 12 shows that, when the magnetic field is damped behind the shock (left panels), the final profile obtained at an age of 430 years is roughly exponentially decreasing, producing a magnetic filament at the blast wave. The higher the injection efficiency and immediate post-shock magnetic field, the sharper the filament (see Appendix A.1). When the magnetic field is advected behind the shock (right panels), the final magnetic field profile is also decreasing but far less so than in the damped case. These differences in the magnetic field profile/evolution will lead to different characteristics of the synchrotron emission.
4.2.4. Synchrotron spectra
Figure 13 shows the synchrotron spectrum generated at the blast wave and those pro-duced by several fluid elements corresponding to different observed zones (whose flow times are given in Table 5) at the remnant’s age of 430 years. Note that the calculated synchrotron emissivity, ǫν, was averaged over viewing angles. Our study does not include the effect of
magnetic field orientation. The different panels correspond to our different assumptions about the magnetic field evolution (damped in the left panels, advected in the right panels)
and energy losses (only adiabatic expansion losses6 in the top panels, adiabatic expansion
plus radiative losses in the bottom panels). In those examples, the injection efficiency and immediate post-shock magnetic field were fixed to 1.4× 10⁻⁴ and 130 µG, and K
ep to 10−3
and k0 to 10 (left panels) or 7 (right panels).
We illustrate the crucial role of the magnetic field (both its strength and evolution) on the production of the synchrotron emission. When the magnetic field is damped (left panels), the spectral variations of the different photon spectra come from variations in the strength of the magnetic field which shift the emission in frequency/energy as illustrated by the case with only adiabatic losses included (top-left panel). In the case of efficient particle acceleration considered here (ηinj= 1.4× 10⁻⁴ and B2 = 130 µG), the magnetic field
strength diminishes rapidly as we move in from the blast wave to the interior. However, because the magnetic field is very large at the blast wave, its cumulative effect over time leads to substantial synchrotron losses and then clear changes in the synchrotron spectrum slope (bottom-left panel).
On the other hand, when the magnetic field is carried by the plasma flow (right panel of Fig. 13), differences between the case with only adiabatic losses and the one with adiabatic plus synchrotron losses are even more important. Because the magnetic field strength stays approximately constant behind the blast wave, the different spectra are almost unshifted in energy and therefore very similar, but in turn this produces very strong synchrotron losses and therefore significant spectral variations. These spectral variations are much more pronounced than those obtained for a decreasing magnetic field (compare the bottom panels).
4.2.5. Methodology
Now that the details of how we calculate the magnetic field profiles and synchrotron spectra are established, here we outline our methodology for relating relevant model parame-ters to observational constraints. The starting point is the ratio of radii, Rs/Rc, between the
contact discontinuity and the blast wave, equal to 1.113 here in the W rim (see 3.1.2). This provides a relation between the injection efficiency, ηinj, the post-shock magnetic field, B2,
and the ambient density, n0. The kinetic energy of the explosion, ESN, should be considered
as a free parameter that also influences Rs/Rc. However, we freeze ESN at 1051 ergs, for
simplicity. Figure 14 shows for instance how the ratio of radii, Rs/Rc, varies as a function
of B2 for several values of ηinjat fixed n0 (left panel) or how it varies as a function of n0 for
6In that case, the slope of the synchrotron spectrum reflects directly the slope of the electron spectrum
several values of ηinj at fixed B2 (right panel).
We select a value of n0 = 0.2 cm−3 which is fully consistent with the lack of shocked
thermal ambient medium and derive the injection value consistent with the ratio of radii for a given value of magnetic field (left panel of Fig 14). Then we calculate the projected profiles of the X-ray synchrotron brightness and spectral index, and verify that these model profiles are consistent with the observations. At this point, we are not making a comparison to the surface brightness data in flux units, but rather only to the normalized profile. The process is iterated using different values of B2 in order to bracket the range of X-ray profile
widths. We obtain reasonable fits for each magnetic field configuration (damped or advected) and this effectively results in a constraint on B2. At the same time, we can calculate the
normalized radio profile as well as the ratio of X-ray to radio fluxes. The most important parameter which governs that ratio is the maximum energy reached by the electrons, Ee,max.
We set Ee,max (via k0) in order to get the right average X-ray spectral slope. This is done for
each magnetic field configuration and, as we will see below, the modelled radio profiles are quite different. Finally we determine the electron-to-proton density ratio, Kep, by scaling
the modelled X-ray profile to the peak values of the Chandra data at the rim. Reasonable values of order 10−3 for K
ep will be obtained.
4.2.6. Radial profiles of the synchrotron emission
In Figure 15, we plot the expected line-of-sight projections of the synchrotron brightness7
(with both adiabatic and synchrotron losses included) in one radio (blue dotted lines) and one X-ray band (black solid lines) corresponding to the four magnetic field configurations shown in Figure 12. In addition, we show the X-ray profiles convolved with a gaussian that matches the Chandra PSF at 1 keV (red solid lines) which allows us a direct comparison with the X-ray data (points marked with
•
). The X-ray data points correspond to the power-law normalization obtained by fitting the Chandra spectra in the W rim with a power-law plus an ejecta template and a fixed absorption of 0.7× 1022cm−2 (see §3.1.4), and divided by thesolid angle of each radial bin. The predicted radio profiles can be compared with the radio data points (marked with
◦
in blue) which differs from those of Figure 11 (top panel) as they account for the beam size. For projection we assume the blast wave curvature in the out-of-sky-plane direction to be equal to the sky-plane curvature.When the magnetic field is damped behind the blast wave (left panels of Fig. 15), the
7That is (4 π)−1 R ǫ
ν(r) dl performed along the line-of-sight and where ǫν is the synchrotron emissivity
modelled radio (dotted lines) and X-ray (red solid lines) morphologies are very similar. Both radio and X-ray profiles are peaked at the blast wave, with the radio profile wider and with a smaller brightness contrast between the rim and far behind the rim. The limb-brightening of the modelled radio profiles comes closer to matching what we observe in the radio rims in terms of morphology (see the NW and NE rims in Fig. 11), but clearly not in terms of intensity. When either ηinj = 10−3 and B2 = 215 µG (top-left panel) or ηinj = 1.4× 10⁻⁴
and B2 = 130 µG (bottom-left panel), the predicted radio brightness is far too low compared
to the radio data. In the magnetic damping case, once Ee,max (or equivalently k0) has been
fixed in order to be consistent with the observed average X-ray slope, it is difficult to increase the radio intensity while keeping the same level of X-ray intensity because the ratio of X-ray to radio fluxes (independent of Kep) does not depend strongly on the injection efficiency.
However, a slight variation in k0 can increase the radio emission while keeping the same level
of X-ray emission (provided that we adjust Kep) and without changing the average X-ray
slope too much. For instance, when ηinj = 10−3 and B2 = 215 µG (top-left panel), changing
k0 to 14 (instead of 7) and adjusting Kep to 2.5× 10⁻³ (instead of 2.0× 10⁻³) increases the
radio emission by a factor 1.25 (which corresponds to the ratio of Kep) without modifying
the X-ray intensity and only increases the averaged X-ray photon index by 0.1 (index of 2.9 instead of 2.8). Note however that in the case ηinj= 1.4× 10⁻⁴ and B2 = 130 µG
(bottom-left panel), it is not possible to make the absolute radio and X-ray fluxes at the rim and the average X-ray photon index all consistent with the observations just by varying k0. It
requires us to change the shape of the electron cutoff. We investigate this possibility below (see §4.2.8).
When the magnetic field is advected behind the blast wave (right panels of Fig. 15), the modelled radio (dotted lines) and X-ray (red solid lines) morphologies are very different. Contrary to the X-ray profile which is strongly peaked just behind the blast wave, the radio profile rises slowly to a maximum near the contact discontinuity (assuming no additional contribution from the ejecta). The case ηinj = 1.4× 10⁻⁴ and B2 = 130 µG with Kep =
1.3× 10⁻³ (bottom-right panel) predicts a lower radio intensity compared to the radio data
while the case ηinj= 10−3 and B2 = 215 µG with Kep= 1.1× 10⁻³ (top-right panel) predicts
a larger radio intensity. This suggests, however, that there is an intermediate value for the injection efficiency that can account for the observed level of radio emission. We found that ηinj = 3× 10⁻⁴ with B2 ≃ 175 µG and Kep = 1.2× 10⁻³ would provide such a good fit
(not shown). Nevertheless, even with these best-fit parameters, we note that the observed rapid rise of the radio emission at the blast blast can not be reproduced accurately by the models. Finally, for completeness, we note that other studies based only on the integrated synchrotron spectrum of Tycho from the radio to the X-ray suggest a Kep value of 4× 10⁻³,