HAL Id: hal-02352573
https://hal.archives-ouvertes.fr/hal-02352573
Submitted on 6 Nov 2019
HAL is a multi-disciplinary open access
archive for the deposit and dissemination of
sci-entific research documents, whether they are
pub-lished or not. The documents may come from
teaching and research institutions in France or
abroad, or from public or private research centers.
L’archive ouverte pluridisciplinaire HAL, est
destinée au dépôt et à la diffusion de documents
scientifiques de niveau recherche, publiés ou non,
émanant des établissements d’enseignement et de
recherche français ou étrangers, des laboratoires
publics ou privés.
by source region at the Lampedusa island in the central
Mediterranean Sea
Marc Mallet, Barbara d’Anna, Aurélie Même, Maria Chiara Bove, Federico
Cassola, Giandomenico Pace, Karine Desboeufs, Claudia Di Biagio,
Jean-Francois Doussin, Michel Maillé, et al.
To cite this version:
Marc Mallet, Barbara d’Anna, Aurélie Même, Maria Chiara Bove, Federico Cassola, et al..
Sum-mertime surface PM 1 aerosol composition and size by source region at the Lampedusa island in the
central Mediterranean Sea. Atmospheric Chemistry and Physics, European Geosciences Union, 2019,
19 (17), pp.11123-11142. �10.5194/acp-19-11123-2019�. �hal-02352573�
Atmos. Chem. Phys., 19, 11123–11142, 2019 https://doi.org/10.5194/acp-19-11123-2019 © Author(s) 2019. This work is distributed under the Creative Commons Attribution 4.0 License.
Summertime surface PM
1
aerosol composition and size by source
region at the Lampedusa island in the central Mediterranean Sea
Marc D. Mallet1,2,3, Barbara D’Anna2,4, Aurélie Même2,a, Maria Chiara Bove5,6, Federico Cassola5,b,Giandomenico Pace7, Karine Desboeufs1, Claudia Di Biagio1, Jean-Francois Doussin1, Michel Maille1, Dario Massabò5, Jean Sciare8, Pascal Zapf1, Alcide Giorgio di Sarra7, and Paola Formenti1
1LISA, CNRS UMR7583, Université Paris Est Créteil (UPEC), Université de Paris,
Institut Pierre Simon Laplace (IPSL), Créteil, France
2IRCELYON, CNRS UMR 5652, Univ. Lyon1, Lyon, France 3Centre National d’Etudes Spatiales (CNES), Toulouse, France 4LCE, CNRS UMR 7376, Aix-Marseille Université, Marseille, France 5Department of Physics & INFN, University of Genoa, Genoa, Italy 6ARPAL Physical Agents and Air Pollution Sector, La Spezia, Italy
7Laboratory for Observations and Analyses of Earth and Climate, ENEA, Rome, Italy 8The Cyprus Institute, Energy, Environment and Water Research Center, Nicosia, Cyprus anow at: Bruker, Lyon, France
bcurrently at: ARPAL CFMI-PC, Genoa, Italy
Correspondence: Paola Formenti (paola.formenti@lisa.u-pec.fr) Received: 26 February 2019 – Discussion started: 12 March 2019
Revised: 3 July 2019 – Accepted: 24 July 2019 – Published: 3 September 2019
Abstract. Measurements of aerosol composition and size distributions were taken during the summer of 2013 at the remote island of Lampedusa in the southern central Mediterranean Sea. These measurements were part of the ChArMEx/ADRIMED (Chemistry and Aerosol Mediter-ranean Experiment/Aerosol Direct Radiative Forcing on the Mediterranean Climate) framework and took place during Special Observation Period 1a (SOP-1a) from 11 June to 5 July 2013.
From compact time-of-flight aerosol mass spectrometer (cToF-AMS) measurements in the size range below 1 µm in aerodynamic diameter (PM1), particles were predominately
comprised of ammonium and sulfate. On average, ammo-nium sulfate contributed 63 % to the non-refractory PM1
mass, followed by organics (33 %). The organic aerosol was generally very highly oxidized (f44values were typically
be-tween 0.25 and 0.26). The contribution of ammonium sulfate was generally higher than organic aerosol in comparison to measurements taken in the western Mediterranean but is con-sistent with studies undertaken in the eastern basin.
Source apportionment of organics using a statistical (pos-itive matrix factorization) model revealed four factors: a hydrocarbon-like organic aerosol (HOA), a methanesulfonic-acid-related oxygenated organic aerosol (MSA-OOA), a more oxidized oxygenated organic aerosol (MO-OOA) and a less oxidized oxygenated organic aerosol (LO-OOA). The MO-OOA was the dominant factor for most of the campaign (53 % of the PM1 OA mass). It was well correlated with
SO2−4 , highly oxidized and generally more dominant dur-ing easterly air masses originatdur-ing from the eastern Mediter-ranean and central Europe. The LO-OOA factor had a very similar composition to the MO-OOA factor but was more prevalent during westerly winds, with air masses originating from the Atlantic Ocean, the western Mediterranean and at high altitudes over France and Spain from mistral winds. The MSA-OOA factor contributed an average 12 % to the PM1
OA and was more dominant during the mistral winds. The HOA, representing observed primary organic aerosol, only contributed 8 % of the average PM1OA during the campaign.
Even though Lampedusa is one of the most remote sites in the Mediterranean, PM1 concentrations (10 ± 5 µg m−3)
were comparable to those observed in coastal cities and sites closer to continental Europe. Cleaner conditions cor-responded to higher wind speeds. Nucleation and growth of new aerosol particles was observed during periods of north-westerly winds. From a climatology analysis from 1999 to 2012, these periods were much more prevalent during the measurement campaign than during the preceding 13 years. These results support previous findings that highlight the im-portance of different large-scale synoptic conditions in deter-mining the regional and local aerosol composition and oxida-tion and also suggest that a non-polluted surface atmosphere over the Mediterranean is rare.
1 Introduction
The Mediterranean Sea is a unique marine environment, sur-rounded by mountain ranges and high coastal human pop-ulations from Africa, Europe and Asia, and the two largest deserts in the world: the Sahara to the south and Arabian Desert to the east. It presents a diverse and dynamic atmo-spheric composition and is projected to undergo significant changes in the contribution of freshwater (Sanchez-Gomez et al., 2009), sea surface temperature and precipitation (Mariotti et al., 2015) over the coming decades. The burning of fossil fuels, including shipping pollution, in southern Europe and in large Mediterranean cities, as well as natural sources of aerosol such as sea salt, forest fires and mineral dust, provide a highly complex and dynamic mixture of organic and inor-ganic aerosol and aerosol precursors in this region (Lelieveld et al., 2002). Elevated aerosol loadings over the Mediter-ranean basin have been attributed to the long-range transport of continental anthropogenic aerosols (Perrone et al., 2013; Sciare et al., 2003, 2008) and mineral dust transported from Africa (Querol et al., 2009b; Koçak et al., 2007). Boundary layer observations in the eastern Mediterranean have shown a significant influence of long-range-transported continental pollution from southern and central Europe (Sciare et al., 2003). Furthermore, biomass burning aerosol has frequently been observed over the basin, in particular during the dry sea-son in summer when forest fires are more common (Bougia-tioti et al., 2014; Minguillon et al., 2015; Pace et al., 2005). Long-range plumes from North American fires have also been observed at high altitudes (Formenti et al., 2002; Ortiz-Amezcua et al., 2014; Brocchi et al., 2018; Ancellet et al., 2016).
Previous long-term observations of the chemical com-position of aerosol in the Mediterranean have shown that PM10(particulate mass with aerodynamic diameter less than
10 µm) is composed of secondary ammonium sulfate, pri-mary and secondary organic aerosol from fossil fuels or bio-genic origins, with contributions from natural aerosols from the Sahara and sea spray (Bove et al., 2016; Koulouri et al., 2008; Schembari et al., 2014; Calzolai et al., 2015). Mineral
and sea salt contributions are significantly lower in PM2.5
particle fraction (Querol et al., 2009a). Coarse-mode parti-cles contribute to the direct radiative effect over the Mediter-ranean (Perrone and Bergamo, 2011; Meloni et al., 2006) and can also act as condensation sinks for pollutants (Pikridas et al., 2012). Smaller (submicron) aerosol particles, while also contributing efficiently to the total aerosol optical depth in this region (Formenti et al., 2018), can also act as efficient cloud condensation nuclei and therefore have an influence on cloud formation, lifetime and precipitation (Haywood and Boucher, 2000). Understanding the impact of different natu-ral and anthropogenic sources on the regional composition of the atmosphere is therefore important in our understanding of the influences they have on the climate over the Mediter-ranean basin and surrounding regions. It is also now widely recognized that aerosols contribute to adverse health effects in humans (World Health Organization, 2016).
Consideration of both the local and regional meteorol-ogy is needed to characterize the sources and ageing of aerosols (Petit et al., 2017). The National Oceanic and At-mospheric Administration (NOAA)’s Hybrid Single-Particle Lagrangian Integrated Trajectory model (HYSPLIT; Stein et al., 2015) and other trajectory models (e.g. FLEXPART; Stohl et al., 2005) have become widely used resources in at-mospheric studies to compute the backward or forward tra-jectories of air masses at any point on Earth. They can be use-ful for identifying the possible origin of a particular episode associated with elevated concentrations of aerosols or gases. Combined with in situ measurements over longer time peri-ods, they provide a more holistic approach in understand-ing the link between local or region meteorology and at-mospheric composition (Schmale et al., 2013; Tadros et al., 2018; Zhou et al., 2016). This is particularly useful for re-mote sites where local emissions are insignificant or infre-quent.
Investigation of the aerosol physical and chemical proper-ties can also help distinguish their respective sources. Posi-tive matrix factorization (PMF; Paatero, 1997; Paatero and Tapper, 1994) has proved to be a useful statistical tool in identifying aerosol sources or ageing processes of organ-ics. The source apportionment of PM2.5 and PM10 over the
Mediterranean, from the PMF method, has been investigated in recent works and showed a large spatial variability in source contributions (Becagli et al., 2012, 2017; Calzolai et al., 2015; Amato et al., 2016; Diapouli et al., 2017). The PMF approach was also used to study the aerosol source and ageing processes by utilizing the complex nature of organic aerosol in the Mediterranean (e.g. Hildebrandt et al., 2010, 2011; Bougiatioti et al., 2014; Minguillón et al., 2016; Arndt et al., 2017; Michoud et al., 2017). This approach has be-come increasingly feasible, with the recent widespread im-plementation of instruments capable of providing real-time, high time- and mass-resolved non-refractory aerosol com-position, such as aerosol mass spectrometers (Ulbrich et al., 2009). PMF models have shown to successfully resolve the
M. D. Mallet et al.: Summertime PM1composition and size in the remote Mediterranean 11125
bulk composition of submicron organic aerosol into the con-tributions from various primary sources (e.g. biomass burn-ing, fossil fuel burnburn-ing, cooking aerosol) but can also re-veal the contributions and characteristics of secondary or-ganic aerosol (SOA) (Zhang et al., 2011). Factors with sim-ilar mass spectra are consistently observed, albeit with dif-ferent contributions at measuring sites all around the world. The most commonly observed primary organic aerosol fac-tors are hydrocarbon-like OA (HOA), usually from fossil fuel burning as well as biomass burning (BBOA), while SOA can be usually separated into at least two factors, with low-volatility oxygenated OA (LV-OOA) and semi-volatile OOA (SV-OOA) as common examples (Zhang et al., 2011; Crippa et al., 2014). Other types of OOA have also been observed, such as marine-OOA (Schmale et al., 2013), although these are more difficult to resolve given the shift towards more uni-form OA composition with ageing.
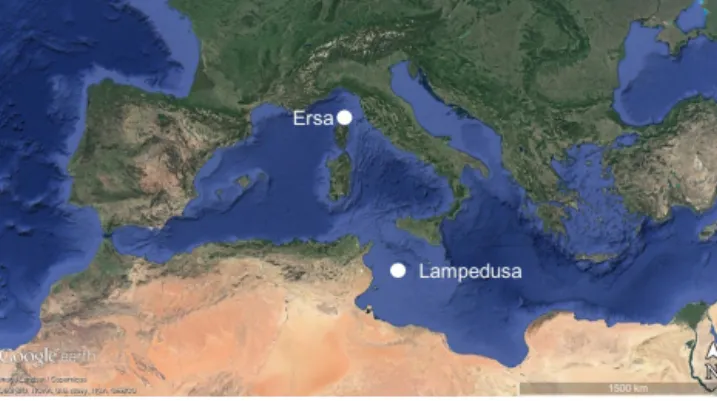
The Chemistry-Aerosol Mediterranean Experiment (ChArMEx) collaborative research programme, and the Aerosol Direct Radiative Impact on the regional climate in the MEDiterranean region (ADRIMED) project within, were undertaken to investigate the chemistry and climate interac-tions within the Mediterranean (Mallet et al., 2016). From 11 June to 5 July 2013, numerous experimental setups were deployed across the western and central Mediterranean in what is called “Special Observation Period – 1a” (SOP-1a), including intensive airborne measurements (Denjean et al., 2016). Two supersites were set up at Ersa (at the northern tip of Corsica island, France) and at the Lampedusa island (Italy), approximately 1000 km apart on a north-to-south axis in order to characterize surface aerosol chemical, phys-ical and optphys-ical properties (Mallet et al., 2016). Numerous secondary sites established along the Mediterranean coasts in Spain, Italy and Corsica beyond SOP-1a have also pro-vided valuable knowledge of the atmospheric composition in the western and central Mediterranean regions (Chrit et al., 2017, 2018; Becagli et al., 2017).
In this paper, we present the first detailed characterization of PM1 in the central remote Mediterranean region, using
measurements of size-resolved chemical composition on the island site of Lampedusa during ChArMex/ADRIMED SOP-1a. We investigate the source apportionment of PM1by
con-sidering their chemical and microphysical properties along with ancillary PM10, gaseous and meteorological data,
air-mass back trajectories as well as complementary data col-lected at the Ersa site in Corsica.
2 Experimental 2.1 Sampling sites
Observations took place at the Roberto Sarao station on the island of Lampedusa (35◦310500N, 12◦3705100E; 20 m a.s.l.) from 11 June to 5 July 2013. Ancillary measurements for
Figure 1. The Mediterranean basin. The two sites considered in this study, Lampedusa and Ersa, are indicated in white dots. Image is courtesy of © Google Earth 2019.
this study taken at Ersa at the northern tip of Cap Corse (42◦580500N, 9◦2204900E; 560 m a.s.l.) are also considered. The positions of the stations are shown in Fig. 1.
2.2 Instrumentation, measurements and data
Instruments at the Lampedusa supersite were housed in the PEGASUS (Portable Gas Field and Aerosol Sampling Unit) station, a portable observatory initiated by LISA, described in Mallet et al. (2016). Relevant to this study, a cToF-AMS (Aerodyne Inc., Billerica, USA) was used to mea-sure the size-resolved composition of non-refractory partic-ulate matter below 1 µm (NF-PM1) (Drewnick et al., 2005).
Data were collected with a 3 min time resolution. The cToF-AMS was operated from a certified total suspended partic-ulate (TSP) sampling head (Rupprecht and Patashnick, Al-bany, NY, USA), followed by a cyclone impactor cutting off aerosol particles larger than 1 µm in aerodynamic diam-eter (using a flow rate of 16 lpm). A Nafion drier was used; however, the relative humidity at the inlet of the cToF-AMS was checked throughout the campaign and was always below 55 %.
A particle-into-liquid sampler (Metrohm PILS; Orsini et al., 2003) was installed on a TSP inlet and collected samples approximately every hour. Denuders to remove acid/base gases were not used. Samples were analysed for major in-organic and in-organic anions (F−, Cl−, NO−3, SO2−4 , PO3−4 , HCOO−, CH3COO−, (COO−)2) and cations (Na+, NH+4,
K+, Ca2+, Mg2+) using ion chromatography (Metrohm, model 850 Professional IC) equipped with Metrosep A Supp 7 pre-column and column for anions measurements and Met-rosep C4-250 mm pre-column and column for cation mea-surements and a 500 µL injection loop. The device was oper-ated with a 1 h time resolution.
A 13-stage rotating cascade impactor (NanoMOUDI model 125B; Marple et al., 1991) was used to measure the size-segregated inorganic elemental composition. The NanoMOUDI impactor, also operated from the TSP inlet,
al-lows the separation of the particles into 13 size classes from 10 nm to 10 µm diameters with a backup stage. Each sam-ple was collected for 3 d with a flow rate of 10 lpm to en-sure enough material was collected on each impactor stage. The 47 mm diameter polytetrafluoroethylene filters (2 µm pore size) were used and coated with high-quality vacuum grease (Dekati DS-515) to avoid bouncing. They were then analysed using X-ray fluorescence (PW-2404 spectrometer by PANalytical™) for the particulate elemental concentra-tions for elements from Na to Pb as described in Denjean et al. (2016).
A scanning mobility particle sizer (SMPS) measured the mobility number size distribution of aerosols every 3 min from 14.6 to 661.2 nm diameter. The instrument is com-posed by an X-ray electrostatic classifier (TSI Inc., model 3080) and a differential mobility analyser (DMA; TSI Inc., model 3081) and a condensation particle counter (CPC; TSI Inc., model 3775) operated at 1.5/0.3 L min−1aerosol/sheath flows. Data were corrected to take into account the particle electrical charging probabilities, the CPC counting efficiency and diffusion losses. Each scan was recorded with a 5 min time resolution. A drier was not used on the SMPS inlet, and therefore the size distributions reported are for ambient con-ditions.
A GRIMM optical particle counter (OPC; GRIMM Inc., model 1.109) was used to measure the number size distribu-tion over 31 size classes ranging from 0.26 up to 32 µm (nom-inal diameter range assuming the aerosol refractive index of latex spheres in the calibration protocol). The instrument was operated at a 6 s resolution and data were acquired as 3 min averages.
The equivalent black carbon mass concentration (eBC) was determined by the measurement of light attenuation at 880 nm performed by a spectral aethalometer (Magee Sci. model AE31) operated at a 2 min time resolution and equipped with a TSP particle inlet. As the evaluation of eBC is used as a qualitative tracer of pollution, the factory mass conversion factor of 16.6 m2g−1was applied to the raw mea-surement of attenuation without further corrections.
The meteorological measurements (air pressure, tempera-ture, relative humidity, wind direction and speed and precip-itation) were collected by a Vaisala Milos 500 station with a sampling rate of 10 min. The wind sensor was installed on a 10 m meteorological tower, while the air temperature and humidity were measured at a height of 2 m.
2.3 Data analysis
2.3.1 Analysis of the cToF-AMS data
The cToF-AMS data set was processed using two differ-ent software analysis tools. The first makes use of the widely used and standard Igor Pro package, Squirrel (ver-sion 1.57G). This software processes the raw data and analy-ses the unit-mass resolution (UMR) output with a
fragmenta-tion table reported in Aiken et al. (2008). The second method uses a cumulative peak-fitting analysis and residual analysis and allows the separation of multiple isobaric peaks not taken into account in the traditional analysis of unit mass resolution Squirrel data treatment (Muller et al., 2011). Uncertainties in the major chemical species from the cToF-AMS are typically of the order of ±20 % (Drewnick et al., 2005).
The ionization efficiency (IE) with respect to nitrate anions was calculated every 5–6 d using nebulized 350 nm mobility diameter ammonium nitrate particles (values varied between 1.42 × 10⁻⁷and 1.53 × 10⁻⁷). The relative IE (RIE) of am-monium was slightly higher than the default value and was 4.3 based on the mass spectrum of ammonium nitrate data from IE calibrations. The RIE of sulfate was determined by comparing the theoretical and the measured concentration of a solution of ammonium nitrate and ammonium sulfate and was determined to be the default value of 1.2. For the or-ganic fraction, the default value of 1.4 was used. For each of the major species, a composition-dependent collection effi-ciency was applied as proposed by Middlebrook et al. (2012) and was on average 0.549, very similar to the default value of 0.55.
The PM1sea salt concentration was estimated in the
cToF-AMS by applying a scaling factor of 102 to the ion frag-ment (using the cumulative peak-fitting analysis described in Muller et al., 2011) at 57.98 assigned to NaCl as pro-posed by Ovadnevaite et al. (2012). This scaling factor was determined by nebulizing monodisperse 300 nm (mobility diameter) NaCl particles into the cToF-AMS and compar-ing the NaCl+ signal to the total mass calculated using the number concentration from a CPC-3010. This calibra-tion was done after the campaign but with similar tuning conditions. The sea salt SO2−4 (ss-SO2−4 ) was calculated as 0.252 · 0.3 · [seasalt], where 0.252 is the mass ratio of SO2−4 to Na+in sea salt and 0.3 is the mass ratio of Na+to sea salt (Ghahremaninezhad et al., 2016). Given these assumptions, the uncertainty in the sea salt concentrations is likely to be significantly higher than the typical 20 %, although the total contribution of sea salt to the PM1 fraction was very small
(0.30 µg m−3; <4 %).
Unconstrained positive matrix factorization was per-formed on both the unit-mass resolution spectra of organic aerosol as well as the peak-fitted peaks identified as organ-ics using PMF2 v2.08D. This method requires a matrix for both the organic signals as well as the errors associated with the organics. For the peak-fitted signals, errors for each mass were estimated as
1I /I = q
α2t + (β +1), (1)
where I is the ion signal, 1I is the absolute uncertainty in the ion signal, α and β are constants (1.2 and 0.001, respec-tively), and t is the instrumental sampling time in seconds (Drewnick et al., 2009; Allan et al., 2003). For both UMR and peak-fitted inputs, up to eight factors were investigated
M. D. Mallet et al.: Summertime PM1composition and size in the remote Mediterranean 11127
by altering the seeds from 0 to 50 in increments of 1 and the fpeaks from −1 to 1 in increments of 0.1. This approach is explained in Ulbrich et al. (2009).
2.3.2 Air-mass back-trajectory calculation and cluster analysis
In order to determine potential source regions for aerosols measured at Lampedusa during the SOP-1a, a series of clus-ter analyses was performed on HYSPLIT air-mass back tra-jectories as per the following. Weekly GDAS1 (Global Data Assimilation System; 1◦resolution) analysis trajectory files were downloaded from the Air Resources Laboratory (ARL) of the NOAA archive. The 144 h air-mass back trajectories were then calculated every hour over the measurement pe-riod with an ending point at Lampedusa (height of 45 m) us-ing HYSPLIT (Stein et al., 2015) from within the R package, SplitR. Cluster analyses were then performed on these calcu-lated trajectories using a trajectory clustering function within the R package, OpenAir (Carslaw and Ropkins, 2012). Clus-tering was done using two different methods to calculate the similarity between different trajectories. The first uses the Euclidean distance between the latitude and longitude of each trajectory point (a total of 144 in this case, repre-senting each hour prior to the arrival at the receptor site). The second uses the similarity of the angles of each trajec-tory from the origin. These two methods are described in Sirois and Bottenheim (1995). For each clustering method, the number of clusters was altered from 2 up to 10. A total of six clusters identified using the Euclidean-distance method were selected, producing a realistic separation of the air-mass back trajectories and distinct and physically meaningful dif-ferences in aerosol composition and size. An additional clus-tering analysis was also performed over 3 and 6 h intervals and using 96 h back trajectories and yielded similar results.
3 Results and discussion
3.1 Analysis of local and synoptic meteorology
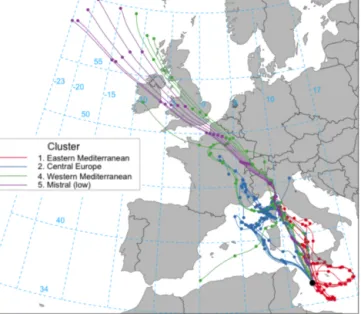
The analysis of the hourly resolved 144 h air-mass back trajectories provides an indication of the origin of the air masses sampled at Lampedusa during the field campaign. Six distinct clusters are identified (Fig. 2). Cluster 1 (eastern Mediterranean) is representative of air masses that circulate around the eastern–central Mediterranean basin before arriv-ing at the Lampedusa site (average altitude of 400 m). Clus-ter 2 (central Europe) is representative of air masses arriving from central Europe (average altitude of 800 m). Cluster 3 (Atlantic) is representative of more marine-like air masses that predominately originate over the Atlantic Ocean, pass over the Strait of Gibraltar between Spain and Morocco, and cross the western Mediterranean basin (average altitude of 500 m). Cluster 4, western Europe, cluster 5, mistral (low), and cluster 6, mistral (high), all have similar angular
trajec-tories but are distinguishable by their different wind speeds and altitudes (although the Euclidian method of cluster anal-ysis only considers differences in horizontal distances). The two mistral clusters typically originate over the northern At-lantic Ocean, travel over France at a high altitude before de-scending over the western Mediterranean and travelling with relatively higher wind speeds towards Lampedusa. The alti-tude of mistral (high) was, on average, higher than mistral (low) (1400 and 1000 m, respectively) and also coincided with higher wind speeds at Lampedusa (13 and 9 m s−1, re-spectively). In comparison, the trajectories of the western Eu-rope cluster spent much more time circulating at lower alti-tudes (700 m, on average) over the western Mediterranean basin and, to a certain extent, east of the Lampedusa site.
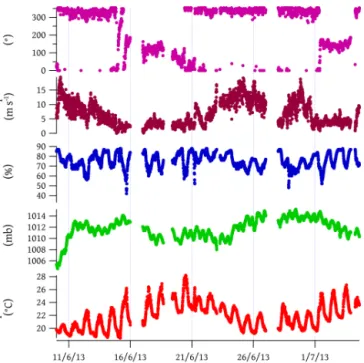
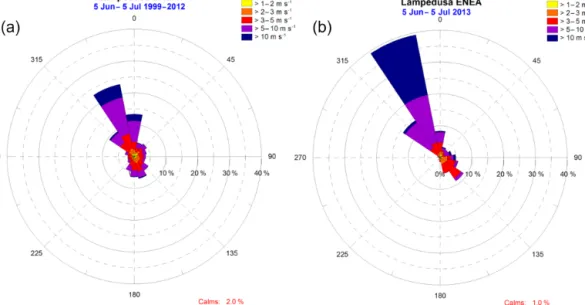
As a complement, the pressure, temperature, relative hu-midity, wind speed and direction time series recorded at the station are shown in Fig. 3. Two main weather regimes are observed: the former characterized by intense (up to nearly 20 m s−1) north-westerly winds, persisting for several days (10–13 and 22–30 June) and cool temperatures, whereas the latter associated with low-gradient anticyclonic conditions and light winds from the east or south-east, also favouring warmer temperatures (14–21 June and 1–3 July). Tempera-tures were relatively stable over the sampling period, fluctu-ating between approximately 18.5 and 28.2◦C. The relative humidity typically ranged between 70 % and 82 % with very few and very brief episodes of drier air masses (relative hu-midity close to or below 50 %). The wind speed and direc-tion distribudirec-tions during the campaign can be compared to the June–July climatology from 1999 to 2012 (Fig. 4). Dur-ing the samplDur-ing period of this study, the frequency of winds from the north-westerly sectors was nearly double the aver-age when compared to normal conditions, approaching 40 % with high winds speeds exceeding 10 m s−1observed during more than 20 % of the time.
Data of sea level pressure and 1000 mbar meridional wind component composite anomalies obtained from the National Centers for Environmental Prediction (NCEP)/National Cen-ter for Atmospheric Research (NCAR) reanalysis (Kalnay et al., 1996) indicate that this particular situation was in-duced by a dipolar pattern, characterized by positive pres-sure anomalies in the western Mediterranean and negative ones in the eastern part of the basin (see Fig. S1 in the Sup-plement). This produced a persisting, stronger-than-normal gradient over southern Italy. As a consequence, surface dust episodes typically driven by strong south or south-easterly winds, associated to cyclonic systems moving along northern African coasts, were basically absent during the campaign. 3.2 Aerosol composition
The dry NR-PM1concentrations measured at Lampedusa by
the cToF-AMS ranged from 1.9 to 33.4 µg m−3, with a mean of 10.2 µg m−3over the sampling period. Sulfate contributed the most to the measured NR-PM1mass (41 % ± 9 % on
av-Figure 2. (a) Hourly 144 h (6 d) back trajectories from Lampedusa from 10 June to 5 July 2013, cut off at 120 h (5 d). Colours represent the assigned cluster. (b) The same as panel (a) but cut off at 24 h.
Figure 3. Meteorological conditions (wind direction and speed, rel-ative humidity, pressure and temperature) measured at the Lampe-dusa site during SOP-1a.
erage), followed by significant contributions from organics (31 % ± 8 %) and ammonium (17 % ± 3 %). The eBC, nitrate and sea salt (scaled from the NaCl component of m/z 58) contributed 6 % (±4 %), 1 % (±0.4 %) and 3 % (±2 %), re-spectively. Figure 5 shows the total PM1concentration
(cal-culated as the sum of the individually measured species), with contribution from each of the species, as well as the calculated PM1mass concentration from the SMPS
(assum-ing an average density based on the composition data). There was reasonable agreement (slope of 0.62; R2=0.67) be-tween the PM1mass concentration calculated from
compo-sition measurements and the SMPS, with discrepancy ob-served during periods of high sulfate concentrations from the eastern Mediterranean. This could be due to a combination of a broader accumulation mode exceeding the upper size limits of the cToF-AMS inlet, differences in sampling line relative humidity or unaccounted-for variations in the collection effi-ciency. This figure also contains an indication of the air-mass origin over the sampling period.
During most of the campaign there was reasonable agree-ment (slope of 1; R2=0.6) between the PM1SO2−4
(cToF-AMS) and the TSP SO2−4 (PILS) concentration, with the exception of periods of high sea salt concentrations when the TSP SO2−4 were significantly higher (slope of 0.5; R2= 0.2 for TSP Cl concentrations >10 µg m−3; see Fig. S2). Supporting measurements of the size-segregated composi-tion from the cascade impactor corroborate this, indicating a higher contribution of elemental sulfur in the coarse mode during periods of higher sea salt (Fig. S3). These periods cor-responded to the mistral air masses, characterized by higher wind speeds and indicated the role of coarse sea salt parti-cles in acting as a condensation sink for sulfate species. If these events are frequent, this could have important implica-tions for the radiative properties of these aerosols by altering the scattering properties and potentially cloud condensation nuclei concentrations and composition.
Figure 6 shows the organic mass, split according to dif-ferent OA factors from the PMF of the OA peaks. From the unconstrained PMF of the UMR and peak-fitted organic mass spectra, the most meaningful solution was found from a four-factor solution of the UMR analysis (see Figs. S4 and S5 for the mass reconstruction and time series’ residuals). This has
M. D. Mallet et al.: Summertime PM1composition and size in the remote Mediterranean 11129
Figure 4. Wind speed and direction at Lampedusa during the period from 5 June to 5 July during the years 1999–2012 (a) and during this campaign (b).
Figure 5. The time series of PM1mass concentration, coloured by
the relative contribution from each species. The top bar is coloured according to the air-mass origin.
resulted in one factor resembling a primary organic aerosol and three oxygenated organic aerosol (OOA) factors. Herein, we label these factors HOA (hydrocarbon-like OA), MO-OOA (more oxidized MO-OOA), LO-MO-OOA (less oxidized MO-OOA) and MSA-OOA (methanesulfonic-acid-related OOA).
These factors were compared with ambient organic mass spectra listed in the AMS Spectral Database (Ulbrich et al., 2009). The spectra for the OOA factors (see Fig. 7) were strongly correlated with each other (R>0.97) and all three were similar to a continental OOA factor observed in a ship campaign in the Arctic (Chang et al., 2011), as well as a
low-Figure 6. The time series of the PM1 more oxidized OOA
(MO-OOA), less oxidized (LO-OOA) and sulfate (a) and methanesulfonic-acid-related OOA (MSA-OOA), hydrocarbon-like OA (HOA) and eBC (b).
volatility OOA factor identified in Paris (Crippa et al., 2013). Despite the similarities in their mass spectra, they exhibited different diurnal trends (Fig. 7) and time series that were as-sociated with different wind directions and air masses and were therefore not recombined into a single OOA factor.
The MO-OOA factor was the most dominant factor dur-ing the field campaign (∼ 53 % of the total OA mass) and was typical of low-volatility/highly oxidized OOA observed in many other studies, in the Mediterranean, with high con-tributions of m/z 44 (f44=0.31) (e.g. Hildebrandt et al.,
2010, 2011). This factor was the most prominent during air masses from the eastern Mediterranean, central Europe and Atlantic (contributing to 71 %, 58 % and 55 % to OA, respec-tively) and was strongly correlated with ammonium sulfate
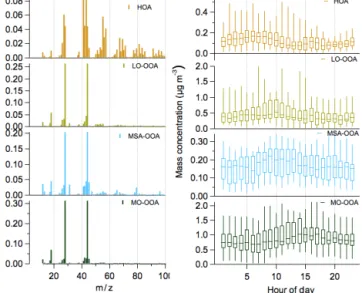
Figure 7. The mass spectra for the four PMF factors (HOA: hydrocarbon-like organic aerosol, LO-OOA: less oxidized OOA, MO-OOA: more oxidized OOA, MSA-OOA: methanesulfonic-acid-related OOA) retrieved from the PMF analysis of unit-mass resolution data.
(R2=0.68) over the whole campaign. It also had a distinct diurnal trend, with concentrations increasing during daylight hours, indicative of photochemical processing. The LO-OOA factor was slightly less oxygenated (f44=0.26) and
exhib-ited a different time series (R2=0.04), related to different air masses, than the MO-OOA. The less oxygenated OOA factor has also been associated with semi-volatile species and is often labelled as SV-OOA (Jimenez et al., 2009). Despite a distinct diurnal profile similar to previously reported SV-OOA factors (with a peak in the early morning), we refrain from labelling our LO-OOA this way because the mass spec-trum was generally much more oxygenated and contained less f43than typically reported SV-OOA (see Fig. 9).
The MSA-OOA factor contributed approximately 12 % of the total OA during the campaign and is likely related to the biogenic emission and processing of dimethyl sulfide (DMS) from phytoplankton in the Mediterranean. This factor was also highly oxygenated (f44=0.20) but contains key peaks
related to the fragmentation of MSA from the electron im-pact of the cToF-AMS. The most prominent of these peaks were m/z 96 (CH4SO+3), 79 (CH3SO+2), 78 (CH2SO+2), 65
(HSO+2) and 45 (CHS+). A similar factor was observed at Bird Island in the south Atlantic Ocean (Schmale et al., 2013), albeit without the contribution of significant m/z 44, suggesting a more aged or mixed aerosol during this cam-paign. A distinct diurnal pattern for the MSA-OOA was not observed.
While the MO-OOA, LO-OOA and MSA-OOA factors represent secondary organic aerosol and were the most dom-inant contribution of OA during the campaign (92 % on av-erage), a primary organic aerosol factor was observed and
identified here as HOA. The mass spectrum of the HOA fac-tor was characteristic of spectra observed in other studies, with prominent peaks at m/z 95, 91, 83, 81, 71, 69, 57, 55, 43 and 41. Although HOA is typically associated with emis-sions from incomplete combustion (Zhang et al., 2005), it was not well correlated with other expected tracers such as eBC, CO and NOx. This HOA was typically associated with
south-westerly winds of low speed (<5 m s−1; see Fig. 10) and peaked at approximately 06:00 LT each morning. The poor correlation between the HOA factor and eBC could have been due to a variety of local sources with different HOA and eBC emission factors, a mixing of the PMF fac-tor with some small peaks not associated with combustion processes or from regional HOA that has undergone some transport without significant oxidation. The signal fraction of each m/z of the mass spectrum of the HOA factor how-ever had strong correlations (0.69<R<0.89) with numerous HOA factors from other studies (Hersey et al., 2011; Ulbrich et al., 2009; Ng et al., 2011; Lanz et al., 2007; Zhang et al., 2005).
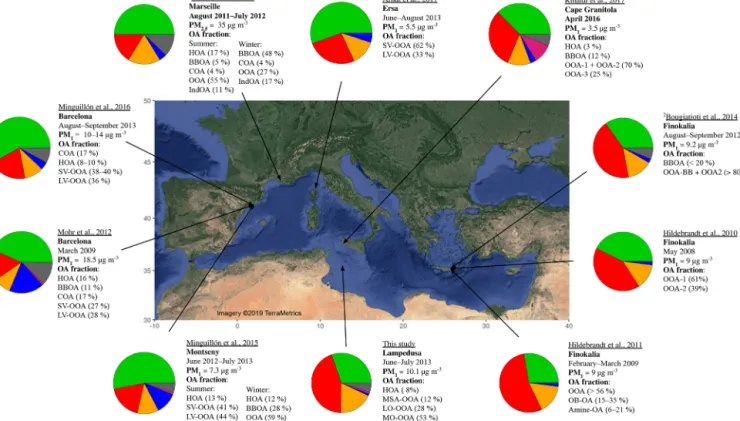
3.3 Comparison with other observations around the Mediterranean
There are many factors that could influence the compo-sition, the concentration and oxidation level of different aerosol species over the Mediterranean. These include dif-ferent aerosol sources which can follow difdif-ferent seasonal or yearly trends (e.g. biogenic emissions) as well as the exist-ing aerosol load and the meteorological conditions that drive transport, dilution and ageing processes. The majority of pre-vious studies of detailed PM1aerosol composition have been
taken at coastal sites around the Mediterranean (Mohr et al., 2012; Minguillón et al., 2015, 2016; El Haddad et al., 2013; Bozzetti et al., 2017) which could be expected to observe higher concentrations than at Lampedusa due to proximity to sources (e.g. traffic, fossil fuel use, heating, biomass burning, industrial activities). Aside from Lampedusa and the obser-vations presented in this study, measurements at Finokalia and Cap Corse could be considered the most remote sites where these measurements have been taken. Similar to the comparison of NR-PM1measurements from Europe, North
America and east Asia made by Zhang et al. (2007), Fig. 8 summarizes the recent observations of NR-PM1composition
from measurements in and around the Mediterranean basin (see Tables S1 and S2 for more details that are displayed in Fig. 8).
The PM1mass loading observed at Lampedusa is
compa-rable to most of these other studies performed at both re-mote marine sites and coastal sites in the Mediterranean. With the exception of sites in the eastern Mediterranean, OA was the dominant NR-PM1constituent and summertime
OA was generally considered mostly secondary, comprised of SV-OOA and LV-OOA with small contributions of HOA. For remote sites, the results are consistent with a
predomi-M. D. Mallet et al.: Summertime PM1composition and size in the remote Mediterranean 11131
Figure 8. A summary of studies that have investigated NR-PM1composition (including PMF of OA) around the Mediterranean basin. Only
studies that have investigated PMF-based OA source apportionment are reported. Pie charts display the average concentration during each study, where green corresponds to organics, red to sulfates, orange to ammonium, blue to nitrate, pink to either chlorides or sea salt and black to elemental or black carbon. The OA fraction acronyms correspond to the following: HOA: hydrocarbon-like organic aerosol, SV-OOA: semi-volatile oxygenated organic aerosol, LV-OOA: low-volatility oxygenated organic aerosol, BBOA: biomass burning organic aerosol, COA: cooking organic aerosol, OOA: oxygenated organic aerosol, F4: factor 4 (unidentified PMF factor), IndOA: industry-related organic aerosol, OB-OA: olive-branch organic aerosol. See Tables S1 and S2 for further details about the sampling locations, instruments used and pie chart values.1This study collected on PM2.5filters and nebulized into an HR-ToF-AMS.2Excludes fire periods.
Figure 9. f43(the ratio of m/z 43 to the total OA) against f44(ratio
of m/z 44 to the total OA). The triangle is considered to encapsulate typical atmospheric values of OA according to Ng et al. (2010). The values for the various PMF factors from this study and other studies conducted in the remote Mediterranean are also displayed.
nance of OA in PM1 fraction in summer. PMF analysis of
Q-AMS measurements at the Finokalia remote site in the eastern Mediterranean in the summer of 2008 showed two OOA factors and a distinct lack of HOA (Hildebrandt et al., 2010). A more recent study during the late 2012 summer at Finokalia observed periods influenced by biomass burn-ing but otherwise also observed mostly oxygenated organic aerosol (Bougiatioti et al., 2014). Measurements undertaken in the western Mediterranean at Cap Corse from 11 June to 6 August 2013 encompassed the sampling period of this study. For the period from 15 July to 5 August, PMF anal-ysis showed 55 %, 27 % and 13 % contributions of organic matter, sulfate and ammonium to non-refractory PM1
(Mi-choud et al., 2017). Secondary oxygenated volatile organic compounds (VOCs) dominated the VOC spectrum during the campaign and were very well correlated with submicron organic aerosol. PMF analysis on the OA revealed a three-factor solution where SV-OOA and LV-OOA were dominant, contributing by 44 % and 53 %, respectively, with a 4 % HOA contribution. From the same measurements but reported over the extended period from 11 June to 5 August, there was
a higher LV-OOA contribution (62 %) (Arndt et al., 2017) which is in agreement with our observations of MO-OOA at Lampedusa. The OA was mostly portioned into MO-OOA and LO-OOA (81 %), indicative of well-aged or oxidized secondary organic aerosol from long-range transport of pol-lutants.
Figure 9 displays the behaviour of the f44 and f43
frag-ments obtained during the field campaign. f44, a proxy for
OA oxidation (Jimenez et al., 2009), is calculated as the ratio of the mass at m/z 44 (mostly CO+2) to the total OA, while f43, equal to the ratio of m/z 43 (mostly C2H3O+) to the
to-tal OA, typically represents less-aged OA. f44 was ∼ 0.26
for the majority of the sampling period (Q1: 0.25; Q3: 0.27), while f43 was 0.036 (Q1: 0.028; Q3: 0.041). The campaign
values are compared to values from the spectra for the four PMF factors and those observed in other field campaigns in the remote Mediterranean. The dotted lines (the so-called Ng triangle) encapsulate the f44 and f43 values of atmospheric
OA from a vast number of studies (Ng et al., 2010), with the most aged OA in the top left corner and the most fresh in the bottom right. The high f44values and the dominance of the
highly oxygenated MO-OOA and LO-OOA factors show that the organic aerosol was extremely aged compared to other measurements.
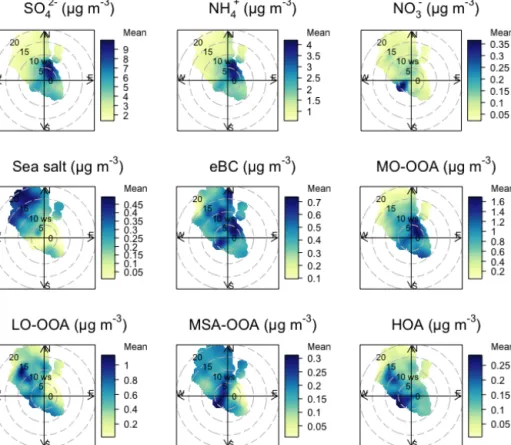
3.4 Links to meteorology
The contribution of the major submicron chemical species and OA sources is further explained in the following by link-ing the measured and apportioned concentrations to the local meteorology (i.e. wind speed and wind direction) and to the air-mass back trajectories to account for the long-range trans-port of aerosol as well as more distant sources. The bivariate polar plots of these PM1 species and f44 as a function of
wind speed and direction are shown in Fig. 10.
Considering that the sampling site on Lampedusa is on the north-east tip of the island, it is evident that the SO2−4 and NH+4 were likely a result of north-easterly marine air masses, in agreement with previous results (e.g. Bove et al., 2016). Sea salt concentrations were highest during high north-westerly wind speeds. Higher concentrations of NO−3, HOA and some of the periods with elevated eBC concentra-tions were observed during low-speed south-westerly winds, likely a result of the human settlements and activity on the island of Lampedusa (population of ∼ 6000 located to the south-west of the sampling site). Besides, the polar plot for eBC showed a patchier pattern, indicative of more local or point sources, and the elevated signals were likely due to air masses passing over ship plumes. Although the mass spec-tra for the LO-OOA and MO-OOA factors were very sim-ilar, their bivariate polar plots indicate different sources or photochemical processes. The MO-OOA was more promi-nent during north-easterly winds, indicating the most aged organics were influenced by air masses from the eastern Mediterranean, either from long-range transport or from
cir-culation of closer pollution sources, while the LO-OOA was more dominant during north-westerly wind directions and air masses from over the western Mediterranean. Figure 11 shows the average contribution of each species during differ-ent air-mass periods (see Table S2 for the mean concdiffer-entra- concentra-tions and standard deviaconcentra-tions).
The highest concentrations of PM1were observed during
eastern Mediterranean and central Europe air-mass periods, when significant lifetime over the lower-altitude marine en-vironment and/or higher SO2emissions allowed the
conver-sion and condensation of sulfate. These aged aerosols are corroborated by the high number concentrations within the accumulation mode during these periods relative to other pe-riods, measured by the SMPS as well as the size-resolved sulfate composition, as discussed in the next section. In con-trast to the eastern Mediterranean and central European air masses, sulfate concentrations were relatively low during the two mistral air masses. This behaviour has been found also in PM10, with elevated values of sea salt aerosol and
low non-sea-salt sulfate during mistral events (Becagli et al., 2017). The organic mass concentration was relatively uni-form across the periods of different air-mass origins, with the exception of the high mistral winds which yielded OA concentrations approximately half the rest of the campaign and a higher contribution of MSA-OOA in comparison with other periods. The higher contribution of MO-OOA com-pared with LO-OOA from eastern air masses, and vice versa during western air masses, could be indicative of different OA sources prior to oxidation or due to different photochem-ical ageing between the two directions.
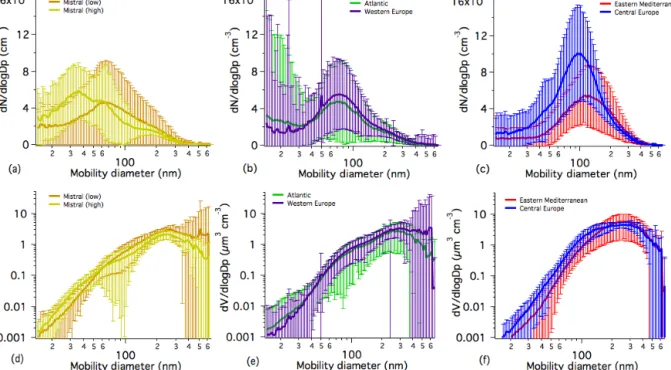
3.5 Aerosol size distributions
There are distinctions between the measured PM1size
distri-butions during periods of different air-mass origins (Fig. 12). It should be noted that these size distributions are under am-bient conditions without an inlet drier which could shift the size distribution to larger sizes if water is present. The ambi-ent relative humidity for each air-mass back-trajectory clus-ter was easclus-tern Mediclus-terranean (53 %), central Europe (61 %), Atlantic (74 %), western Mediterranean (70 %), mistral (low) (67 %) and mistral (high) (74 %). Although the higher tem-perature inside the PEGASUS mobile laboratory could lower the relative humidity at the sampling point of the SMPS with respect to the ambient relative humidity, this was not mea-sured or logged during the campaign.
Consistent with the higher concentrations of sulfate and ammonium species, the eastern Mediterranean and central Europe had the most pronounced accumulation modes with respect to those from other clusters due to the presence of accumulation-mode sulfate (see Fig. S6 for the size-resolved chemical composition). In contrast, the mistral (high) air masses had very few particles in the accumulation mode and were mostly dominated by nucleation-mode (>14 nm obser-vations only) and Aitken-mode particles, in terms of number.
M. D. Mallet et al.: Summertime PM1composition and size in the remote Mediterranean 11133
Figure 10. Bivariate polar plots of mean concentrations of PM1 species and f44 at Lampedusa. The angle represents the arrival wind direction, the radius represents the wind speed, and the colours represent the mean concentrations for the respective wind directions and winds.
Figure 11. The 144 h air-mass back trajectories (top) assigned to each cluster; (middle) the PM1composition for each air-mass cluster and
(bottom) the contribution of OA factors for each air-mass cluster. The diameters for the PM1composition pie graphs are proportional to the
total PM1concentration for each air-mass cluster period, and the radius for the OA factor pie graphs is proportional to the total PM1organic
Figure 12. The number size distribution of PM1aerosol, coloured by averages for different air-mass origins: (a) mistral (high) and mistral (low); (b) Atlantic and western Europe; (c) eastern Mediterranean and central Europe; and the volume size distribution of PM1aerosol,
coloured by averages for different air-mass origins: (d) mistral (high) and mistral (low); (e) Atlantic and western Europe; (f) eastern Mediter-ranean and central Europe.
There was only one period of mistral (high) air masses, span-ning 38 h between 09:00 UTC on 24 June and 23:00 UTC on 25 June.
The most pronounced new particle formation (NPF) events and subsequent growth were observed during the two mis-tral air masses, particularly between 25 and 27 June. Very high number concentrations in the nucleation mode were also observed in very brief periods during the Atlantic and, to an extent, the western Europe air masses. There was no trend (R2=0.03) over the whole campaign between the ra-tio of the particle number concentrara-tion between 14–25 nm and 14–600 nm and the fraction of CH3SO+2 (a fragment of
MSA, measured by the cToF-AMS) to total PM1 organics
(see Fig. S7). There was a weak positive trend during periods of the mistral (high) air mass (R2=0.39). No trends were observed between the ratio of sub-25 nm and sub-600 nm particle number concentrations and the occurrence of other cToF-AMS fragments such as amines that could be linked with biogenic gas-to-particle conversion. Furthermore, there was a weak negative trend between the ratio of sub-25 nm and sub-600 nm particle number concentrations and the cal-culated f44(R2=0.12). Without instrumentation to measure
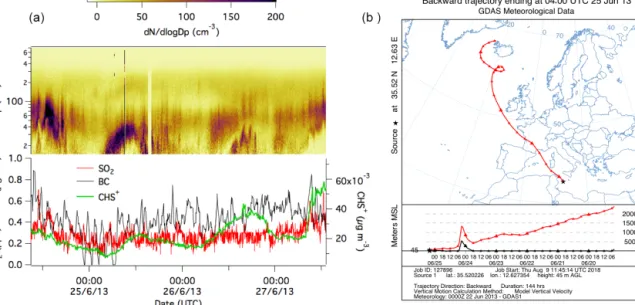
the concentration of clusters and smaller aerosols (<14 nm) in conjunction with organic vapours over a longer time pe-riod, it is difficult to isolate and conclude the origin of these nucleation particles in a general sense, and we will limit our analysis to the most pronounced event during the campaign.
Figure 13 shows the size distribution over this period as well as SO2, eBC and CH3SO+2, as well as the back trajectory
ending at 04:00 UTC on 25 June at Lampedusa. This NPF event occurred during the night and therefore in the absence of photochemistry. There was no discernible increase in eBC or SO2during these events and the 3 d cascade impactor
sam-ple from 25 to 28 June was characterized by the lowest con-centrations of vanadium and nickel (released from heavy oil combustion events due to ship emissions) of the whole cam-paign. The air-mass back trajectory during this event was characteristic of the mistral (high) cluster. These are high-altitude air masses that descended over the Atlantic Ocean before having undergone a hydraulic jump over the south-ern France region and then a rapid descent over the west-ern Mediterranean basin at high speed before arriving at the Lampedusa site. It is interesting to note that these air masses were anomalous for the typical June/July period at Lampe-dusa. Although the detected mass of CH3SO+2 is likely due
to the condensation of MSA on accumulation-mode par-ticles, and considering that the cToF-AMS collection effi-ciency below ∼ 100 nm is poor, the increasing concentration of CH3SO+2 did coincide with the nucleation events during
this period, suggesting a possible nucleation and condensa-tion of marine biogenic vapours. Different studies indicate that NPF events may be triggered by atmospheric mixing processes (Kulmala et al., 2004; Hellmuth, 2006; Lauros et al., 2007, 2011) due to different phenomena like the
enhance-M. D. Mallet et al.: Summertime PM1composition and size in the remote Mediterranean 11135
ment of turbulence in elevated layers (Wehner et al., 2010), the break-up of the nocturnal inversion (Stratmann et al., 2003) or the turbulence associated with the nocturnal low-level jet (Siebert et al., 2007). Nighttime NPF events have also been observed in the eastern Mediterranean (Kalivitis et al., 2012).
Furthermore, the intrusion of descending mid-tropospheric air masses in the boundary layer (Pace et al., 2015) has been linked to the occurrence of NPF events and would be consistent with the absence of high concen-trations of BC, SO2, vanadium and nickel which could be
expected from ship emissions (Healy et al., 2009; Isakson et al., 2001) in the boundary layer over the Mediterranean. Pace et al. (2006) have shown that clean marine aerosol conditions are rare at Lampedusa and generally associated with north-westerly progressively descending trajectories, in agreement with the findings of this study. The relative ab-sence of pre-existing particles acting as a condensation sink favours NPF events as observed during the field campaign. 3.6 Accumulation of sulfates across the Mediterranean In order to investigate the ageing of aerosols across the north–south trajectory of European continental air masses, we compare the average NR-PM1 composition
measure-ments at Lampedusa to the concurrent measuremeasure-ments con-ducted at the Ersa site during summer 2013 (Michoud et al., 2017; Arndt et al., 2017). This is shown in Table 1.
On average, the PM1non-refractory organic mass
concen-trations at both sites were similar, with ∼ 3 µg m−3. NO−3 concentrations were relatively small at both sites but higher at Ersa (0.28 µg m−3) than at Lampedusa (0.09 µg m−3). Sul-fate concentrations were a factor of 3.2 times higher at Lampedusa (4.5 µg m−3) than at Ersa (1.4 µg m−3), while the ammonium concentrations were a factor of 2.7.
To investigate the possible accumulation of ammonium sulfate during the transport of air masses from Europe, the hourly air-mass back trajectories from Lampedusa were fil-tered so that only those that passed within ±1◦latitude and longitude and within ±200 m altitude of the station height of Ersa (550 m) were selected. These thresholds were chosen arbitrarily since there is no clear distinction in horizontal or vertical distance from the site that would necessarily consti-tute a representative air mass. This resulted in a total of 192 hourly observations at the Ersa site over 32 unique air-mass back-trajectory runs (see Fig. 14).
These trajectories were grouped mainly into the central Europe cluster (n = 12). The median trajectory duration be-tween the Ersa and Lampedusa sites was 53 h, with a min-imum of 33 h and a maxmin-imum of 144 h (corresponding to the total duration of the HYSPLIT model runs in this case). Those air masses grouped in the eastern Mediterranean clus-ter had the longest duration time between the sites of 127 h (while coincident with the Ersa site, these air masses still spent a significant amount of time over the eastern
Mediter-ranean), followed by central Europe (83 h), western Europe (45 h) and then the mistral (low) (38 h). In general, between the two sites, there was a 40 % enhancement in the organic mass concentration but an increase in sulfate and ammonium by a factor of 6 and 4, respectively (Table 1).
The accumulation of (NH4)2SO4 between Ersa and
Lampedusa appeared to be dependent on the travel time of the air mass; however, different relationships were observed during different air-mass clusters. The total sulfate concen-tration at Lampedusa minus the total sulfate concenconcen-tration at Ersa for the same air mass and accounting for the travel time as a function of the travel time is shown in Fig. 15.
There was a good positive correlation between the differ-ence in sulfate concentrations between the two sites and the travel time for the central Europe and eastern Mediterranean air masses, while weak positive correlations were observed for the western Europe and mistral (low) clusters. It should be pointed out that the travel time was more than 110 h for the eastern Mediterranean air masses, while it was only be-tween 33 and 58 h for the other three air-mass clusters. It is expected that the accumulation of sulfate would increase as the total travel time increases due to the opportunity for SO2
conversion or from the addition of sulfate from separate air masses which are not accounted for in the HYSPLIT model. Although this relationship is somewhat demonstrated here, there are other factors that would influence the SO2−4 accu-mulation. The sulfate concentrations presented here are mea-sured by an Aerosol Chemical Speciation Monitor (ACSM) and cToF-AMS at the Ersa and Lampedusa sites, respec-tively. Both of these instruments have a 100 % inlet effi-ciency between ∼ 100 and 800 nm. The conversion of SO2
to SO2−4 via nucleation and condensation is dependent on the pre-existing aerosol size distribution and condensation sink. Therefore, the use of PM1 composition can be
mis-leading if the sulfate is condensing on coarse particles. This is demonstrated in Fig. S2, which shows the size-resolved mass distribution of sulfur and sodium collected every 3 d on multi-stage cascade impactor filters; the relative contribu-tion of sulfur in the PM1is higher than that of PM10 in the
absence of sodium (a tracer for sea salt). Furthermore, the concentrations of SO2−4 measured by the PILS in the PM10
fraction and cToF-AMS in the PM1are approximately equal
with low sea salt concentrations (Na + <2 µg m−3) but are nearly a factor of 2 higher with the PILS for higher sea salt concentrations (Fig. S3). Furthermore, the emission of SO2,
typically from ships in the Mediterranean, is not necessarily constant over time and is likely not uniformly spread over the basin and within the vertical column (e.g. Becagli et al., 2017). This could possibly explain the discrepancy between the accumulation rate of sulfate between the eastern Mediter-ranean and central European air-mass origins. Moreover, the sample size for this analysis is relatively small and poten-tially not representative of the general accumulation of SO2−4 but nonetheless they highlight the magnitude of accumula-tion under different air-mass trajectories.
Figure 13. (a) The number size distribution during a new particle formation event on 25 June 2013 and the corresponding concentrations of SO2, eBC and MSA fragment, CH3SO+2 and (b) the HYSPLIT air-mass back trajectory during the event.
Table 1. Campaign average PM1concentration for the major aerosol species measured at the Ersa and Lampedusa sites during the SOP-1a period and for periods of coincident air-mass back trajectories between Ersa and Lampedusa.
Site SO2−4 Organic NH+4 NO−3 Ersa 1.4 ± 2.6 3.0 ± 1.1 0.7 ± 1 0.3 ± 0.1 Lampedusa 4.5 ± 0.9 3.0 ± 1.6 1.9 ± 0.5 0.1 ± 0.2 Ersa (coincident 0.9 ± 0.5 2.7 ± 1.1 0.5 ± 0.3 0.4 ± 0.3 with Lampedusa) Lampedusa (coincident 5.3 ± 2.0 3.8 ± 0.8 2.0 ± 0.6 0.1 ± 0.1 with Ersa) 4 Concluding remarks
The measurements carried out at Lampedusa during the ChArMEx/ADRIMED SOP-1a field campaign have pro-vided a unique insight into the surface layer aerosols in the remote central Mediterranean. Air masses were influenced by transport from the eastern Mediterranean, central Europe, the western Europe, the Atlantic Ocean as well as western Europe. Air-mass clustering has been performed to explain observed differences in the aerosol composition and size at Lampedusa.
Hourly PM1 mass ranged from 1.9 to 33.4 µg m−3, with
an average of 10.2 µg m−3. It was composed on average of 41 % ± 9 % sulfate, 31 % ± 8 % organics, 17 % ± 3 % am-monium, 6 % ± 4 % black carbon, 1 % ± 0.4 % nitrate and 3 % ± 2 % sea salt. OA was highly oxidized (f44∼0.26)
and was apportioned to more oxidized oxygenated OA fac-tor (MO-OOA, 53 %), less oxidized OOA facfac-tor (LO-OOA, 28 %), methanesulfonic acid OOA (MSA-OOA, 12 %) and
hydrogen-like OA (HOA, 8 %). The highest PM1mass
load-ings were observed for air masses from the eastern Mediter-ranean and central Europe, mostly due to the accumulation of ammonium and sulfate. Ancillary data from a remote site at the northern point of Cap Corse in the western Mediterranean showed increases of SO2−4 concentrations between 2 and 12 µg m−3 when both sites (Corsica and Lampedusa) were connected. Apart from the dominance of ammonium sulfate on the PM1composition, the mass concentration and sources
of OA have shown to be comparable to previous observations at European coastal and remote sites in the Mediterranean. The most pristine air masses, in terms of PM1, were observed
during periods with north-westerly winds which originated from the western Mediterranean or at high altitudes over the western European continent. Several nucleation and growth events, as well as large sea salt concentrations, were observed during these pristine periods. The largest concentrations of PM1 were observed from air masses from central Europe
M. D. Mallet et al.: Summertime PM1composition and size in the remote Mediterranean 11137
Figure 14. Hourly 120 h (5 d) back trajectories from Lampedusa that passed within ±1◦in latitude and longitude and ±200 m in al-titude of the Ersa station. The colours represent the assigned cluster (performed on 144 h trajectories).
Figure 15. The difference in the PM1 SO2−4 mass concentration at Lampedusa and Ersa as a function of the travel time of the air masses from Ersa to Lampedusa. Colours represent the air-mass ori-gin cluster.
In contrast to previous measurements of column-integrated aerosol optical properties (Pace et al., 2006; Meloni et al., 2006), we did not observe the presence of dust or biomass burning in the PM1range at the surface.
Our results also indicate a clear dichotomy of PM1aerosol
composition from different source regions. Air masses from central Europe were characterized by a higher organic frac-tion than those from the eastern Mediterranean, which were enriched in sulfates. This difference could have potential im-plications on the optical properties and particularly the cloud condensation nuclei capabilities of those air masses. The
rel-ative occurrence of easterly air masses is not evident in the climatological wind roses nor in a previous study by Pace et al. (2006) that took a climatological approach of the air-mass back trajectories arriving at Lampedusa from 2001 to 2003. Nonetheless, a re-evaluation of the relative importance and occurrence of different air masses and aerosol properties should be undertaken.
Data availability. Open access to the data used for this publica-tion is provided to registered users following the data and publi-cation policy of the ChArMEx programme (http://mistrals.sedoo.fr/ ChArMEx/Data-Policy/ChArMEx_DataPolicy.pdf; Sedoo, 2019). Additional code used in the analysis of data can be obtained upon request from the corresponding or first author. Weekly GDAS1 (Global Data Assimilation System; 1◦ resolution) analysis tra-jectory files were downloaded from the Air Resources Labora-tory (ARL) of the National Oceanic and Atmospheric Administra-tion (NOAA) archive (ftp://arlftp.arlhq.noaa.gov/archives/gdas1/; NOAA, 2018). The 144 h air-mass back trajectories were calcu-lated using the R package, SplitR (https://github.com/rich-iannone/ SplitR; Iannone, 2018). Cluster analyses were performed on these calculated trajectories, using the R package, OpenAir (Carslaw and Ropkins, 2012; data available at: https://github.com/cran/openair). Spectra used for comparison of PMF OA factors from those ob-served in other studies can be found at http://cires.colorado.edu/ jimenez-group/AMSsd/ (Ulbrich et al., 2018).
Supplement. The supplement related to this article is available on-line at: https://doi.org/10.5194/acp-19-11123-2019-supplement.
Author contributions. PF, BD, KD, JFD, AGdS designed the ex-periment in Lampedusa; JS designed the exex-periment in Ersa with contributions from coworkers. BD, AM, MCB, FC, GP, KD, CDB, JFD, MM, DM, JS, PZ, AGdS and PF performed the experiments. MDM, BD, AM, GP, KD, JS and PF analysed data, and all authors contributed to data interpretation. MDM, BD, GP, KD and PF wrote the manuscript with contributions and/or comments from all coau-thors.
Competing interests. The authors declare that they have no conflict of interest.
Special issue statement. This article is part of the special is-sue “CHemistry and AeRosols Mediterranean EXperiments (ChArMEx) (ACP/AMT inter-journal SI)”. It is not associated with a conference.
Acknowledgements. This work is part of the ChArMEx project supported by CNRS-INSU, ADEME, Météo-France and CEA in the framework of the multidisciplinary programme MISTRALS (Mediterranean Integrated Studies aT Regional And Local Scales; http://mistrals-home.org/, last access: 15 February 2019).
Measure-ments at Lampedusa were also supported by the Italian Ministry for University and Research through the NextData and RITMARE projects. The AERIS national data infrastructure is acknowledged for maintaining the ChArMEx database. Observations took place at the Roberto Sarao station (http://www.lampedusa.enea.it/, last ac-cess: 19 December 2018).
Financial support. This research has been supported by the French National Research Agency (grant no. ANR-11-BS56-0006).
Review statement. This paper was edited by Evangelos Gerasopou-los and reviewed by two anonymous referees.
References
Aiken, A. C., Decarlo, P. F., Kroll, J. H., Worsnop, D. R., Huff-man, J. A., Docherty, K. S., Ulbrich, I. M., Mohr, C., Kimmel, J. R., and Sueper, D.: O/C and OM / OC ratios of primary, sec-ondary, and ambient organic aerosols with high-resolution time-of-flight aerosol mass spectrometry, Environ. Sci. Technol., 42, 4478–4485, 2008.
Allan, J. D., Jimenez, J. L., Williams, P. I., Alfarra, M. R., Bower, K. N., Jayne, J. T., Coe, H., and Worsnop, D. R.: Quantitative sampling using an Aerodyne aerosol mass spectrometer 1. Tech-niques of data interpretation and error analysis, J. Geophys. Res.-Atmos., 108, 4090, https://doi.org/10.1029/2002JD002358, 2003.
Amato, F., Alastuey, A., Karanasiou, A., Lucarelli, F., Nava, S., Calzolai, G., Severi, M., Becagli, S., Gianelle, V. L., Colombi, C., Alves, C., Custódio, D., Nunes, T., Cerqueira, M., Pio, C., Eleftheriadis, K., Diapouli, E., Reche, C., Minguillón, M. C., Manousakas, M.-I., Maggos, T., Vratolis, S., Harrison, R. M., and Querol, X.: AIRUSE-LIFE+: a harmonized PM speciation and source apportionment in five southern European cities, At-mos. Chem. Phys., 16, 3289–3309, https://doi.org/10.5194/acp-16-3289-2016, 2016.
Ancellet, G., Pelon, J., Totems, J., Chazette, P., Bazureau, A., Sicard, M., Di Iorio, T., Dulac, F., and Mallet, M.: Long-range transport and mixing of aerosol sources during the 2013 North American biomass burning episode: analysis of multi-ple lidar observations in the western Mediterranean basin, At-mos. Chem. Phys., 16, 4725–4742, https://doi.org/10.5194/acp-16-4725-2016, 2016.
Arndt, J., Sciare, J., Mallet, M., Roberts, G. C., Marchand, N., Sartelet, K., Sellegri, K., Dulac, F., Healy, R. M., and Wenger, J. C.: Sources and mixing state of summertime back-ground aerosol in the north-western Mediterranean basin, At-mos. Chem. Phys., 17, 6975–7001, https://doi.org/10.5194/acp-17-6975-2017, 2017.
Becagli, S., Sferlazzo, D. M., Pace, G., di Sarra, A., Bommarito, C., Calzolai, G., Ghedini, C., Lucarelli, F., Meloni, D., Mon-teleone, F., Severi, M., Traversi, R., and Udisti, R.: Evidence for heavy fuel oil combustion aerosols from chemical analyses at the island of Lampedusa: a possible large role of ships emis-sions in the Mediterranean, Atmos. Chem. Phys., 12, 3479–3492, https://doi.org/10.5194/acp-12-3479-2012, 2012.
Becagli, S., Anello, F., Bommarito, C., Cassola, F., Calzolai, G., Di Iorio, T., di Sarra, A., Gómez-Amo, J.-L., Lucarelli, F., Marconi, M., Meloni, D., Monteleone, F., Nava, S., Pace, G., Severi, M., Sferlazzo, D. M., Traversi, R., and Udisti, R.: Constraining the ship contribution to the aerosol of the central Mediterranean, At-mos. Chem. Phys., 17, 2067–2084, https://doi.org/10.5194/acp-17-2067-2017, 2017.
Bougiatioti, A., Stavroulas, I., Kostenidou, E., Zarmpas, P., Theo-dosi, C., Kouvarakis, G., Canonaco, F., Prévôt, A. S. H., Nenes, A., Pandis, S. N., and Mihalopoulos, N.: Process-ing of biomass-burnProcess-ing aerosol in the eastern Mediterranean during summertime, Atmos. Chem. Phys., 14, 4793–4807, https://doi.org/10.5194/acp-14-4793-2014, 2014.
Bove, M., Brotto, P., Calzolai, G., Cassola, F., Cavalli, F., Fermo, P., Hjorth, J., Massabò, D., Nava, S., and Piazzalunga, A.: PM10
source apportionment applying PMF and chemical tracer anal-ysis to ship-borne measurements in the Western Mediterranean, Atmos. Environ., 125, 140–151, 2016.
Bozzetti, C., El Haddad, I., Salameh, D., Daellenbach, K. R., Fermo, P., Gonzalez, R., Minguillón, M. C., Iinuma, Y., Poulain, L., Elser, M., Müller, E., Slowik, J. G., Jaffrezo, J.-L., Bal-tensperger, U., Marchand, N., and Prévôt, A. S. H.: Or-ganic aerosol source apportionment by offline-AMS over a full year in Marseille, Atmos. Chem. Phys., 17, 8247–8268, https://doi.org/10.5194/acp-17-8247-2017, 2017.
Brocchi, V., Krysztofiak, G., Catoire, V., Guth, J., Marécal, V., Zbinden, R., El Amraoui, L., Dulac, F., and Ricaud, P.: In-tercontinental transport of biomass burning pollutants over the Mediterranean Basin during the summer 2014 ChArMEx-GLAM airborne campaign, Atmos. Chem. Phys., 18, 6887–6906, https://doi.org/10.5194/acp-18-6887-2018, 2018.
Calzolai, G., Nava, S., Lucarelli, F., Chiari, M., Giannoni, M., Becagli, S., Traversi, R., Marconi, M., Frosini, D., Severi, M., Udisti, R., di Sarra, A., Pace, G., Meloni, D., Bommarito, C., Monteleone, F., Anello, F., and Sferlazzo, D. M.: Characteri-zation of PM10 sources in the central Mediterranean, Atmos.
Chem. Phys., 15, 13939–13955, https://doi.org/10.5194/acp-15-13939-2015, 2015.
Carslaw, D. C. and Ropkins, K.: Openair – an R package for air quality data analysis, Environ. Modell. Softw., 27, 52–61, https://doi.org/10.1016/j.envsoft.2011.09.008, 2012 (data avail-able at: https://github.com/cran/openair, last access: 30 May 2018).
Chang, R. Y.-W., Leck, C., Graus, M., Müller, M., Paatero, J., Burkhart, J. F., Stohl, A., Orr, L. H., Hayden, K., Li, S.-M., Hansel, A., Tjernström, M., Leaitch, W. R., and Abbatt, J. P. D.: Aerosol composition and sources in the central Arctic Ocean during ASCOS, Atmos. Chem. Phys., 11, 10619–10636, https://doi.org/10.5194/acp-11-10619-2011, 2011.
Chrit, M., Sartelet, K., Sciare, J., Pey, J., Marchand, N., Cou-vidat, F., Sellegri, K., and Beekmann, M.: Modelling or-ganic aerosol concentrations and properties during ChArMEx summer campaigns of 2012 and 2013 in the western Mediterranean region, Atmos. Chem. Phys., 17, 12509–12531, https://doi.org/10.5194/acp-17-12509-2017, 2017.
Chrit, M., Sartelet, K., Sciare, J., Pey, J., Nicolas, J. B., Marc-hand, N., Freney, E., Sellegri, K., Beekmann, M., and Dulac, F.: Aerosol sources in the western Mediterranean during