HAL Id: insu-02188473
https://hal-insu.archives-ouvertes.fr/insu-02188473
Submitted on 18 Jul 2019
HAL is a multi-disciplinary open access
archive for the deposit and dissemination of
sci-entific research documents, whether they are
pub-lished or not. The documents may come from
teaching and research institutions in France or
abroad, or from public or private research centers.
L’archive ouverte pluridisciplinaire HAL, est
destinée au dépôt et à la diffusion de documents
scientifiques de niveau recherche, publiés ou non,
émanant des établissements d’enseignement et de
recherche français ou étrangers, des laboratoires
publics ou privés.
Lustrement, Emmanuel Bertran, Christophe Montaron, Gabriel Guignan,
Aurélie Reberac, Eric Quémerais, P. Zuppella, et al.
To cite this version:
Jean-François Mariscal, Nicolas Rouanet, Jean-Luc Maria, Benjamin Lustrement, Emmanuel Bertran,
et al.. PHEBUS UV spectrometer on board ESA-BepiColombo Mission: Instrument design &
perfor-mance results. International Conference on Space Optics - ICSO 2018, Oct 2018, Chania, Greece. 16
p., �10.1117/12.2536020�. �insu-02188473�
9–12 October 2018
Edited by Zoran Sodnik, Nikos Karafolas, and Bruno Cugny
PHEBUS UV spectrometer on board ESA-BepiColombo
Mission: Instrument design & performance results
J.-F. Mariscal
N. Rouanet
J.-L. Maria
B. Lustrement
et al.
International Conference on Space Optics — ICSO 2018, edited by Zoran Sodnik, Nikos Karafolas, Bruno Cugny, Proc. of SPIE Vol. 11180, 111802T · © 2018 ESA
and CNES · CCC code: 0277-786X/18/$18 · doi: 10.1117/12.2536020
Proc. of SPIE Vol. 11180 111802T-1
Downloaded From: https://www.spiedigitallibrary.org/conference-proceedings-of-spie on 18 Jul 2019 Terms of Use: https://www.spiedigitallibrary.org/terms-of-use
PHEBUS UV spectrometer on board ESA-BepiColombo mission
Instrument design & performance results
J.-F. Mariscal
*a, N. Rouanet
a, J.-L. Maria
a, B. Lustrement
a, E. Bertran
a, C. Montaron
a, G. Guignan
a,
A. Reberac
a, E. Quemerais
a, P. Zuppella
b, M. G. Pelizzo
b, A.J. Corso
b, I. Yoshikawa
c, K. Yoshioka
c,
G. Murakami
d, and the PHEBUS Team
a
LATMOS, CNRS, UVSQ Univ. Versailles St-Quentin, UPMC Univ. Paris 06, Guyancourt, France.
bCNR – IFN LUXOR Lab., Via Trasea 7, 35131 Padova, Italy
cThe University of Tokyo, 7-3-1
Hongo, Bunkyo-ku, Tokyo 113-0033, Japan
dJAXA - ISAS, 3-1-1 Yoshinodai, Chuo, Sagamihara,
Kanagawa, Japan
ABSTRACT
BepiColombo, a cornerstone mission of European Space Agency (ESA) in cooperation with the Japan Aerospace Exploration Agency (JAXA), will explore Mercury the planet closest to the Sun. This first European mission toward Mercury will be launched in October 2018 from the Guiana Space Centre, on a journey lasting up to six and a half years. The data that will be brought back from the two orbiters will tell us about Mercury’s surface, the atmospheric composition, and the magnetospheric dynamics; it will also contribute to understanding the history and formation of terrestrial planets. Probing of Hermean Exosphere by Ultraviolet Spectroscopy (PHEBUS) is a double spectrometer that will be flown on the Mercury Planetary Orbiter (MPO) one of the two BepiColombo orbiters. This French-led instrument was developed with the purpose of detecting emission lines from Mercury’s exosphere to reveal its composition and distribution, in the wide UV range 55 nm - 315 nm and by recording full spectra. In this paper, we present the instrument design by focusing on the optical subsystems and giving a technical feedback of the major challenges we had to face. We also introduce the calibration philosophy and the main performance results of the instrument.
Keywords: PHEBUS, Mercury, Exosphere, Spectroscopy, Ultraviolet, BepiColombo, Calibration
1. INTRODUCTION
There is a considerable interest in studying the planet Mercury because of the valuable information it can provide to enhance our understanding of the planet formation as well as the formation of our solar system; information that cannot be obtained with observations made from Earth [1]. The atmosphere of Mercury is very tenuous, with a pressure of a fraction of picobarn, this is the reason why we use the term of exosphere. It results from a complex interplay of the solar wind, the planetary magnetic field and the rocky surface. The study of Mercury’s exosphere is among the main scientific objectives of the mission and it will also allow to have a better understanding of the chemical composition of its surface. It will include the detection of new species, the measurement of an average exosphere composition with, as much as possible, species monitored simultaneously during the orbit of the planet around the Sun and the determination of sharp local and temporal variations of the exosphere physical characteristics.
Probing of Hermean Exosphere by Ultraviolet Spectroscopy (PHEBUS) is a double spectrometer working in the Extreme Ultraviolet range (EUV: 55nm - 155 nm) and the Far Ultraviolet (FUV: 145 nm - 315 nm), with two additional visible lines at 404.7 nm and 422.8 nm. It is devoted to the characterization of the composition and dynamics of Mercury’s exosphere and the surface-exosphere relationships [2]. One of the main distinctive features of PHEBUS is its ability to probe Mercury’s exosphere in the 55 nm – 110 nm region of EUV for the first time, in order to extend the working range
*
Corresponding author: jean-francois.mariscal@latmos.ipsl.fr
Proc. of SPIE Vol. 11180 111802T-2
Downloaded From: https://www.spiedigitallibrary.org/conference-proceedings-of-spie on 18 Jul 2019 Terms of Use: https://www.spiedigitallibrary.org/terms-of-use
PHEBUS Specifications
Parameter Value
Spectral range EUV channel: 55 nm – 155 nm FUV channel: 145 nm – 315 nm NUV channels: 404.7 nm and 422.8 nm Spectral resolution (required) EUV: 1 nm FWHM
FUV: 1.5 nm FWHM f-number 6.7
Paraxial FOV 2° x 0.1° Detection mode Photon counting
Sensitivity 0.1 count. second-1. Rayleigh-1 Straylight rejection angle +/- 8.3° (attenuation > 106) Dimensions ~ 500 x 400 x 400 mm3 Weight 7.5 kg
Electric consumption 25 W max
with respect to the UV spectrometer onboard MESSENGER. This will allow the detection of additional species, including metals (Si, Mg, Fe) and noble gases (Ar, Ne), while the scanning mechanism of the spectrometer will allow to perform simultaneous measurements of all detectable species with significant space and time coverage, by providing four-dimensional maps (altitude, latitude, longitude, time) of Mercury’s exosphere.
Science lead and project management of PHEBUS instrument are under the responsibility of the LATMOS French laboratory while the French Space Agency (CNES) acts as prime contractor of all French contributions to the mission. The instrument was implemented in a strong cooperative scheme involving three other countries. University of Tokyo in Japan has provided the two main detectors, the Space Research Institute (IKI) in Russia has implemented the scanning mechanism and the CNR-IFN LUXOR laboratory (Italy) took charge of part of ground calibrations. The design, manufacture, integration, calibration and management of a space instrument dedicated to such a mission represent a major challenge, marked by many technical issues to overcome. After a precise description of the instrument design and key technical challenges, we will present the general calibration philosophy as well as original optical ground system equipment (OGSE), imposed by the spectral working range of the instrument. The most important performance results will also be presented.
2. INSTRUMENT DESIGN
2.1 Instrumental concept
PHEBUS is a double spectrometer for the Extreme Ultraviolet range (55 nm - 155 nm) and the Far Ultraviolet range (145 nm - 315 nm) with an extension for two extra emission lines in the Near Ultraviolet (NUV): Potassium line and Calcium line at 404.7 nm and 422.8 nm respectively. Figure 1 shows a view of the different subsystems of PHEBUS and table 1 summarizes the main specifications.
The spectrum detection is based on the photon counting method and is realized using Micro-Channel Plate (MCP) detectors coupled with Resistive Anode Encoder (RAE). Photocathodes are Cesium Iodide (CsI) for the EUV range, and Cesium Telluride (CsTe) for the FUV range. The size of the detectors active area is 4025 mm² equivalent to a matrix of 1024512 virtual pixels (spectral spatial). Furthermore, Calcium and Potassium lines are selected by the FUV grating. These extra visible lines are monitored using two photomultiplier tubes (PMT Hamamatsu R3550P) with bialkali photocathode also used in photon counting mode. The main advantage of the MCP + RAE detectors is their very high sensitivity mainly due to a very low dark current. Thus, photon counting is easily achievable at typical experiment temperature range (-20°C/ + 40°C), avoiding mass and power expensive devices to cool the detectors. Five to six orders of magnitude for the detection are then a typical value and offer the monitoring of a wide range of emission.
Table 1. Main specifications of PHEBUS spectrometer.
Proc. of SPIE Vol. 11180 111802T-3
Downloaded From: https://www.spiedigitallibrary.org/conference-proceedings-of-spie on 18 Jul 2019 Terms of Use: https://www.spiedigitallibrary.org/terms-of-use
In order to prevent sensitivity losses, which are critical in UV range, a minimum number of reflections is guaranteed inside the instrument using only an off-axis parabola and a set of holographic gratings. The parabola is accommodated inside a rotating mechanism and collects the light coming from the exosphere above the limb and focuses it onto the entrance slit of the spectrometer. This makes the instrument very flexible and quite independent from the spacecraft on an observation point of view, avoiding spacecraft slew for specific pointing requests. This scanning mirror is also very helpful to maintain the line of sight (LOS) close to the limb during long integrations, to make the search and monitoring geometry less dependent on orbit and to extend the vertical range of scanning. The main advantage of this concept is the optimization of the optical layout which allows, on one hand a compact and relatively light instrument, on the other hand a very versatile instrument due to the rotating entrance mirror.
Limitations however exist. Due to the very high sensitivity of the MCP + RAE detectors, the instrument is only devoted to the very faint emissions. A big effort must be then taken to avoid direct illumination of the detectors by strong light sources such as Sun or the reflective surface of the observed planet or its lower atmosphere. This effort induces at instrument level the need of several baffles which increase the mass. Another point is the high sensitivity of the instrument to the dust contamination during the integration which can induce straylight, but also to the molecular contamination which can induce absorption especially in UV. Finally, due to the degrading effect of the moisture and the air on the UV photocathodes, especially EUV ones, and because UV light does not propagate through windows below 115 nm, the EUV detector needs a mechanism to open its window once in space and its sensitive area (photocathode + MCP + RAE) has to be maintained under vacuum during the whole integration life of the instrument on ground (vacuum level around 10-4
mbar). A specific pumping device is then permanently needed for the EUV detector and has to be removed as late as possible before the launch. It means also that adjustments and calibration of the EUV part of the instrument must be realized under vacuum only, with windowless sources.
Figure 1: Exploded view of PHEBUS spectrometer with identification of the main subsystems.
2.2 Optical design
The optical configuration of PHEBUS (Fig. 2) can be divided into two independent parts. The collecting part consists of a straylight rejection baffle (whose exit diaphragm is in fact the entrance pupil of the instrument), an off-axis parabolic mirror and an entrance slit. This part determines the characteristics of the field of view (FOV), the LOS and the point source image quality. The spectrometer part determines the spectral resolution of the instrument and is composed by the entrance slit, two holographic gratings and the detectors (including NUV paths). The key of the optimization lies in the
Proc. of SPIE Vol. 11180 111802T-4
Downloaded From: https://www.spiedigitallibrary.org/conference-proceedings-of-spie on 18 Jul 2019 Terms of Use: https://www.spiedigitallibrary.org/terms-of-use
gratings, characterized by the position of their construction points. The goal of the optical optimization was to obtain the best balance between spectral resolution and photometric performances, according to the scientific requirements. The spectral resolution is defined in terms of Full Width at Half Maximum (FWHM) and Full Width at 1% of maximum (FW1%). The required spectral resolution in terms of FWHM is 1 nm for EUV and 1.5 nm for FUV. These values are to be compared with the result of the optical design optimization giving a FWHM about 0.5 nm on EUV and 0.8 nm on FUV. These calculated values do not include any spreading effects due to scattering by gratings.
Figure 2. 2d view (left) and 3d view (right) of the PHEBUS optical layout.
3. SUBSYSTEMS DESCRIPTION
3.1 Entrance baffle
The entrance baffle has the difficult task to avoid direct illumination of the entrance mirror due to bright sources located outside a rejection angle of +/- 8.3°. In addition, the diffused straylight induced inside the baffle must be attenuate as much as possible before reaching the entrance mirror thanks to multi-reflections. In order to perform exospheric observation as close as the rejection angle value from Mercury’s illuminated surface, the requested value of attenuation must be a factor of 106. To meet such specifications the baffle design must satisfy the following guideline: no inner baffle surface must be
seen form the entrance slit of the spectrometer or, if the surface is visible, it must not be illuminated by direct light. To fill these optical constraints, we designed a cylindrical body composed of four stages and five diaphragms (Fig. 3) including the entrance pupil of 25.4 mm. The total length is 210 mm and the external diameter is about 60 mm.
Figure 3. Left: mechanical drawing of the entrance baffle, with its four stages and its five diaphragms (the leftmost being the entrance pupil). Right: image of only one baffle stage before assembling.
Proc. of SPIE Vol. 11180 111802T-5
Downloaded From: https://www.spiedigitallibrary.org/conference-proceedings-of-spie on 18 Jul 2019 Terms of Use: https://www.spiedigitallibrary.org/terms-of-use
For light coming from outside the rejection angle, this geometry enforces a minimum of two diffuse reflections on the surfaces before entering the instrument and only one diffuse reflection on the edges (Fig. 4). The high level of attenuation is reached thanks to the high quality of the inner surfaces. Two parameters have to be considered: the TIS (Total Integrated Scatter) factor for flat surfaces and the edges size for the diaphragms. Black coating with very low TIS has been selected (typical value ~1%), and the edges of diaphragms are optically polished before the black treatment to obtain typical values of radius of curvature less than 5 µm.
Figure 4: Illustration of the geometrical properties of the entrance baffle: rejection angle and minimum number of reflections on surfaces and edges.
Last constraints for this subsystem are mechanical and thermal ones. Because the baffle is mounted on a rotating mechanism, its mass has to be as low as possible to avoid excessive load. On a thermal point of view, and even if the main part of the baffle will be protected by multi-layer insulation (HT-MLI) due to IR and Albedo fluxes coming from the planet, the baffle will be able to reach very high temperatures (~200°C). In summary, this subsystem had to integrate a complex internal geometry, while ensuring a high thermal conduction and a low mass.
To save mass and avoid thermal constraints, the baffle is made of aluminum alloy. We first thought to perform a laser welding assembly of the stages, but the multiple tests we made did not guarantee neither an acceptable shape tolerance nor a correct straylight-tightness. Finally, the solution of a screwed assembly was chosen and the total mass reached is 170g (without HT-MLI).
3.2 Entrance mirror
The entrance mirror (Fig. 5) is positioned just after the baffle exit - which defines the instrument pupil - and is accommodated inside the rotating mechanism. This subsystem has to focus the light beam onto the spectrometers entrance slit. The proposed optical shape is then an off-axis paraboloid, with an effective focal length of 170 mm and a folding angle of 100°.
To be reflective enough in UV ranges, especially in the EUV one, the mirror material is Silicon Carbide (SiC). The substrate is obtained using sintered SiC and then a SiC layer of 400 µm of thickness is deposited by Chemical Vapor Deposition (CVD process) on the optical surface. This CVD layer is finally polished using a combination of different techniques. The SiC solution offers a homogeneous mirror in terms of material and thermal behavior, which is very important in the PHEBUS case, since the mirror is accommodated on the outside part of the spacecraft so within a difficult thermal environment. However, because the rotating mechanism is made of aluminum, the SiC mirror is thermally decoupled from this mechanism using a Titanium tripod fixed with 3M 2216 epoxy adhesive.
For nominal exospheric observations and to avoid as much as possible straylight inside the instrument, the main parameter of the mirror is the reflective surface roughness. One the other hand, for star calibrations the main driver is the surface figure error (SFE) in order to limit the star image size within the focal plane. An impressive work was done by our supplier, AMOS company (Belgium), to provide two copies of mirrors with a roughness less than 0.7 nm RMS and SFE better than 190 nm.
Proc. of SPIE Vol. 11180 111802T-6
Downloaded From: https://www.spiedigitallibrary.org/conference-proceedings-of-spie on 18 Jul 2019 Terms of Use: https://www.spiedigitallibrary.org/terms-of-use
Figure 5. PHEBUS SiC off-axis parabola
3.3 Slit
The slit is made of Nickel electroforming and coated with Copper Oxide (CuO). It is accommodated at the focal plane of the entrance mirror. It defines the required instrument FOV for exospheric observations and is part of the instrument performance in term of spectral resolution. Considering the entrance mirror effective focal length of 170 mm and a slit rectangular aperture of 5.67 mm 0.283 mm, the FOV is ~1.9° 0.095°.
For star observations, and because it is better to catch 100% of the star flux to perform absolute calibrations, the slit has to be removed from the focal plane. Due to the entrance mirror aberrations, the star image size is actually slightly bigger than the slit size. The slit is therefore mounted on a rotating arm which is linked to a two positions actuator. Such a device has already been used for previous UV spectrometers on board MARS EXPRESS and VENUS EXPRESS missions. The total mass of the slit assembly is around 80g.
3.4 Gratings
Light dispersion is performed by two aberration corrected holographic gratings made by Horiba Jobin-Yvon (Fig. 6). This technology has two main advantages. First, the total number of reflections must be as small as possible in order to avoid reflection losses in the UV range, so it is very interesting to use only one component to spread and focus the spectrum from the slit onto the detector. But with only one component, optical aberration cannot be corrected on the flat surface of the detector, so a classical constant-line spacing grating is not sufficient to reach the spectral resolution requirements. Holographic gratings are especially dedicated to aberrations compensation and can be optimized to correct the optical configuration, whereas ruled gratings correction capabilities are very limited.
The other main advantage of using holographic gratings is their very low surface micro-roughness, which induces a very low level of scattered straylight compared to ruled gratings. Indeed, a low level of scattering is required in order to perceive some faint emission lines close to some bright other lines. Main grating specifications are reported in table 2. Since the two gratings share the same entrance slit, a big effort on their accommodation was needed in order to reduce as much as possible the gap between the two useful areas, where a non-negligible amount of light is lost. Therefore, the useful printed area of the gratings was optimized so has to be within 1 mm of the edge and 0.4 mm separates the two gratings.
Figure 6. Left and middle: EUV and FUV gratings mounted all together on their mechanical support. We can notice the very small gap between them. Right: view of one grating. Here we can notice that the grating substrate and its fastening system (three tabs) form a single piece of aluminum.
Proc. of SPIE Vol. 11180 111802T-7
Downloaded From: https://www.spiedigitallibrary.org/conference-proceedings-of-spie on 18 Jul 2019 Terms of Use: https://www.spiedigitallibrary.org/terms-of-use
Grating parameters
Parameter Description
Type Holographic (aberrations corrected) Shape Spherical (Rc = 173.55 nm) Material Substrate: Aluminum 7075
Reflective coating: Platinum Groove profile Laminar ion-etched Groove density EUV grating: 2726 gr/mm
FUV grating: 1603 gr/mm Size 14 x 44 mm2
Micro-roughness < 1 nm RMS (AFM measurement) Table 3. Summary of grating parameters.
3.5 EUV and FUV detectors
FUV detector (Fig. 7) consists of an input window made of Magnesium fluoride (MgF2), a MCPs, a position-sensitive
anode, electronics and a high voltage module [3]. The MCP assembly is vacuum-sealed by the ceramic body and the input window. Cesium Telluride (CsTe) is coated on the backside of the input window as a photocathode. It has a high efficiency in the FUV range (120 nm-330 nm). The FUV detector uses 5-stage microchannel plates (V&Z stack) for electron amplification. An important indicator of the MCP stack performance is the pulse height distribution on a single photon event which is narrower by 70% than would be expected from a 3-stage MCP stack. Behind MCP stack, the Resistive Anode Encoder (RAE) is a continuous planar resist on a ceramic plate and as such does not have discrete physical pixels. An analog to digital converter (ADC) is used to determine the geometrical position of the electron cloud centroid from sum and difference measurements taken at the RAE corners. The quantized output of the ADC establishes an effective 2d pixel location on the detector, but note that the two axes are measuring different things. One axis gives a spectral dimension, and the other a spatial dimension. We call the resulting data “virtual pixels”. The detector’s active region is 40 25 mm2
which is equivalent to an array of 1024 512 virtual pixels (spectral spatial).
EUV detector (Fig. 7) is a 5-stage MCP coated with CsI and located at the focal plane of the EUV grating [4]. The MCP dimension and principle are the same as the FUV one. However, since no material is transparent to radiations below 110 nm, EUV detector is provided with a MgF2 window that can be opened after a paraffin actuator activation, so that the
incoming photons directly impact the photocathode (Fig. 7). However, this solution has two inconveniences. The first one is due to the degrading effect of moisture and air that may reduce the quantum efficiency of CsI if the window is not properly sealed. To avoid any damage, we must maintain a sufficient vacuum level (< 10-4 mbar) inside the detector, from
their manufacturing up to the launch, thanks to a dedicated pumping system. As long as the instrument remains in the laboratory, this is not really a problem. But once the instrument is integrated on the spacecraft, it gets more complicated. A custom-made pumping system, with ATEX certification had to be designed (Fig. 8). The ATEX directive consists of two European directives describing what equipment and work space is allowed in an environment with an explosive atmosphere. Spacecraft AIT staff must be trained in order to plug-unplug the pumping system during AIT phases on spacecraft. The second disadvantage is that the opening is not reversible and it required an additional complex closing system during the vacuum ground calibration phases of the instrument.
Proc. of SPIE Vol. 11180 111802T-8
Downloaded From: https://www.spiedigitallibrary.org/conference-proceedings-of-spie on 18 Jul 2019 Terms of Use: https://www.spiedigitallibrary.org/terms-of-use
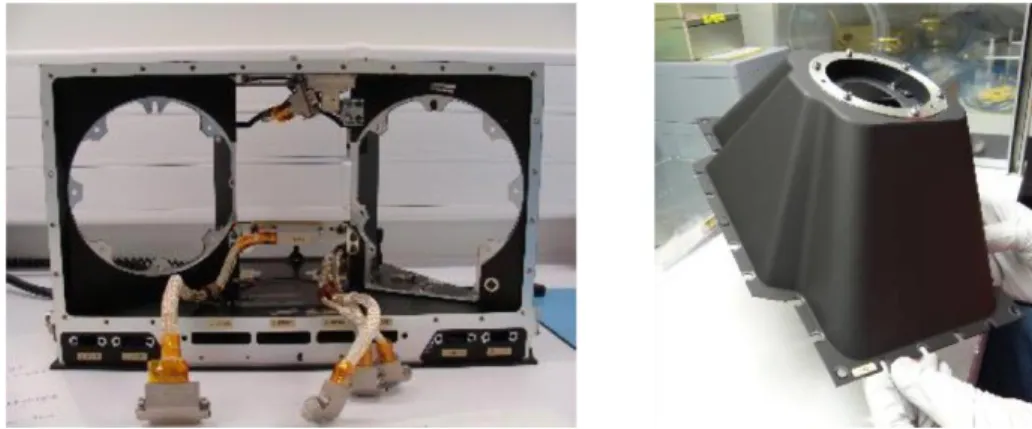
Figure 7. Left: view of the two main detectors FUV (1) and EUV (3) and the two photomultipliers (2), once integrated into the main structure. Right: illustration of the EUV detector with its window closed (4) and open (5).
Figure 8. Left: inside view of the satellite with PHEBUS integrated. Right: outside view of the satellite with the pumping system of PHEBUS fasten on the panel.
3.6 Mechanical structure
The mechanical structure of PHEBUS is divided in two parts. The first one is called the main structure and holds all the massive subsystems of the instrument which are: the rotating mechanism, the slit assembly, EUV and FUV detectors, NUV detectors, the DPU and the power boards. In order to gain mass, it has been decided to propose an innovative design. The previous UV spectrometer onboard MARS EXPRESS and VENUS EXPRESS missions was actually based on an “optical bench” concept, which means a flat structural part with all the subsystems accommodated on this surface. For PHEBUS, due to the strong mass constraints with respect to the number of subsystems to accommodate, the main structure is a 3d single piece made of aluminum (Certal SPC7022) and machined from solid, starting from aluminum block of around 40 kg to reach a piece of 830 g.
Advantages are quite evident: stiffness, mass improvement, decreases of the inertia, integrated mass around the subsystems which provide an improved radiation shielding, machining precision achievable, thermal conductivity and diffusivity increases. Limitations however exist, the main one being the complete optimization of this main structure around the subsystems. If a subsystem evolves, the main structure needs also to be modified. Interface and envelope of each subsystem have been then defined very early in the project.
The second part of the structure is a carbon cover which only holds the gratings assembly and a small flushing system. This structural part, both rigid and light (157g), is designed to keep optical alignment within tolerances after assembly and disassembly.
Proc. of SPIE Vol. 11180 111802T-9
Downloaded From: https://www.spiedigitallibrary.org/conference-proceedings-of-spie on 18 Jul 2019 Terms of Use: https://www.spiedigitallibrary.org/terms-of-use
Figure 9. Left: main aluminum structure. Right: carbon cover
4. CALIBRATION APPROACH
On-ground calibration is a major step in the design of a space instrument and they must not be neglected. The purpose of calibration is to define the transfer function of the instrument in order to convert the output data into the required physical units [5]. Calibration procedure ensures that instrument performances are consistent with all science requirements. A specific effort was dedicated to the calibration of PHEBUS, by first making a calibration plan as complete as possible and also by using very specific facilities dedicated to EUV measurements. We carried out radiometric and spectral calibrations at system level and at subsystems level (mirror, gratings, detectors). Other important parameters were also calibrated, such as attenuation power of the collecting part {baffle + mirror + scanner mechanism + slit}.
4.1 Calibration at system level
In a general way, the objective of PHEBUS is to determine the spectral radiance L (ph.s-1.m-2.sr-1) of an extended source,
by measuring a count rate R (count.s-1.pixel-1) at the instrument output. The relation: 𝑅 = 𝑓(𝐿), between what we measure:
R, and what we want to know: L, is the main purpose of the calibration.
More specifically, at system level, the radiometric performances were evaluated through the knowledge of the effective etendue Geff which is given by the product of the efficiency and the etendue G. The etendue is the geometric set of beam
elements which enter inside the instrument and reach the detector without being subject to vignetting effect. In addition to these diaphragm losses, the effective etendue considers the efficiency of each optical element and thus the reflectivity losses. For unpolarized incident light, in the linear working range of the instrument, the response of the instrument is defined by only one scalar Geff (for a given wavelength) such as:
𝑅 = 𝐺𝑒𝑓𝑓. 𝐿 (1)
In case of polarized incident light, we can use the Stokes formalism and Mueller matrix to describe the instrument behavior. Given the (44) PHEBUS Mueller matrix: Mij and the Stokes vector of the source (L0, L1, L2, L3), the count rate is defined
as follow: | 𝑅0 𝑅1 𝑅2 𝑅3 | = | 𝑀00 𝑀01 𝑀02 𝑀03 𝑀10 𝑀11 𝑀12 𝑀13 𝑀20 𝑀21 𝑀22 𝑀23 𝑀30 𝑀31 𝑀32 𝑀33 | × | 𝐿0 𝐿1 𝐿2 𝐿3 | (2)
Because the information provided by the instrument is a number of counts: R (i.e. the total output intensity which is corresponds to the first component: R0 of the output Stokes vector), we can make some simplifications of Eq.2 and conclude
that we only need the first four parameters: M00, M01, M02 and M03 of the PHEBUS Mueller matrix.
Proc. of SPIE Vol. 11180 111802T-10
Downloaded From: https://www.spiedigitallibrary.org/conference-proceedings-of-spie on 18 Jul 2019 Terms of Use: https://www.spiedigitallibrary.org/terms-of-use
𝑅 = 𝑀00𝐿0+ 𝑀01𝐿1+ 𝑀02𝐿2+ 𝑀03𝐿3 (3) Finally, the four parameters (M00, M01, M02, M03) completely define the photometric response of the system. It means that
the radiometric response of the instrument is no longer a simple scalar value Geff but becomes a set of four scalars.
If we normalize Eq.3 by M00 and L0, we can bring out a corrective factor to obtain:
𝑅 = 𝑀00𝐿0(1 + 𝑚1𝐿1′ + 𝑚2𝐿′2+ 𝑚3𝐿′3) (4) With 𝑚𝑖=𝑀0𝑖 𝑀00 and 𝐿𝑖 ′ =𝐿𝑖 𝐿0 (5)
If we know the polarization state of the incident source and we measure by calibration the values M00 and mi, therefore we
can retrieve the value of interest L0. The term M00 can be assimilated to the effective etendue Geff of unpolarized light. The
term inside the brackets of Eq.4 represents a corrective factor of Geff considering the incident polarization state and the
polarimetric response of the instrument. It can also be seen as an error factor if the polarization effect is not considered. On a spectral point of view, we had to evaluate the Instrument Spectral Response Function (ISRF), characterizing the line profile at a detector level, for a given alignment of the whole system. It involves to know the position and orientation of each line with respect to the wavelength, but also to measure the resolution in terms of FWHM and FW1%.
4.2 Calibration at subsystems level
A calibration at subsystem level is important in terms of redundancy and also to be able to assess the source of any problem that may affect the overall operation of the instrument. Regarding subsystems, only the radiometric calibration is needed and we proceed in the same way as for the system calibration, by representing each subsystem by its Mueller matrix. Theoretically, if we know individually each subsystem Mueller matrix we should be able to obtain the Mueller matrix of the whole instrument. The complete calibration method is given in [6].
5. PERFORMANCE RESULTS
5.1 Radiometric performances
Mirror reflectance and gratings efficiencies have been measured using the normal incidence reflectometer at LUXOR (CNR-IFN, Padova Italy) [7]. This facility is composed of a Johnson-Onaka monochromator with a 600 grooves/mm toroidal grating optimized for the UV range. The light coming from the monochromator is focused by a toroidal mirror in a test chamber equipped with theta-2 theta rotation stage. A set of various sources is available to cover the wide working spectral range of PHEBUS (55 nm – 315 nm): Deuterium lamp, Hg lamp and home-made hollow cathode lamp filled with different gases, as well as a set of various detectors such as: channel electron multiplier (CEM AMPTEK MD501) and photomultiplier (Hamamatsu 6352). To retrieve the complete characteristics of each optical component, the facility has been fully characterized on a radiometric, spectral and polarimetric point of view. Figure 10 shows the reflectance measurement results of the SiC entrance mirror and figure 11 the efficiency measurements obtained for the EUV and FUV gratings. In both cases, experimental results were compared with simulations computed with IMD software for the SiC mirror and PC Grate Software Demo version for the gratings.
Proc. of SPIE Vol. 11180 111802T-11
Downloaded From: https://www.spiedigitallibrary.org/conference-proceedings-of-spie on 18 Jul 2019 Terms of Use: https://www.spiedigitallibrary.org/terms-of-use
Figure 10. Reflectance of the SiC off-axis parabola. Simulation trend has been computed by using IMD software
Figure 11. Left: efficiency of the EUV grating. Right: efficiency of the FUV grating.
The Mueller parameters M00, M01, M02 and M03 of PHEBUS have been experimentally determined at different scanning
angles [6]. In figure 12, the coefficient values are reported for three selected cases, being = 0°/ 90° and = 45°. In the case of = 0°/ 90°, the M02, and M03 calculated parameters are zero, while at = 45° there is a non-zero contribution of
these two parameters. Nevertheless, the value of M02 and M03 in this last case are still at least one order lower than M01 at
each wavelength. A method based on the Mueller formalism has been adopted to fully determine the radiometric response of PHEBUS spectrometer by using the experimental throughputs of optical subsystems. According to [6], we can show that if the polarization factor of the source is less than 20%, its intensity can be obtained by means of the first Mueller parameter with an error lower than 10%.
Proc. of SPIE Vol. 11180 111802T-12
Downloaded From: https://www.spiedigitallibrary.org/conference-proceedings-of-spie on 18 Jul 2019 Terms of Use: https://www.spiedigitallibrary.org/terms-of-use
Figure 12. Left: M00 and M01 PHEBUS parameters. Empty symbols refer to = 0° while the black ones to = 90°. In both cases M02 = M03 = 0. Right: The four Mueller parameters at = 45°.
5.2 Spectral performances
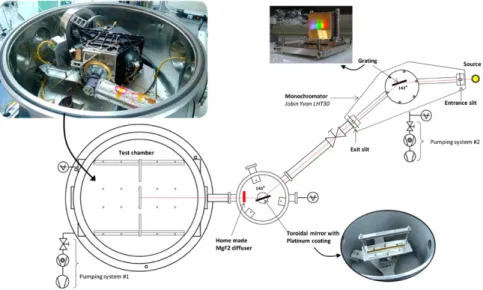
Due to the wide working spectral range of PHEBUS, various optical facilities have been used to perform spectral calibrations. For instance, and because ambient air is no more transparent to radiations below 190 nm, part of spectral calibrations of the complete instrument have been carried out with a specific Vacuum Ultraviolet (VUV) optical bench at LATMOS laboratory (Fig. 13). This specific optical facility operates entirely under vacuum. It is composed of a Jobin Yvon LHT30 monochromator with a 275 grooves/mm toroidal grating working at grazing incidence (71°). A platinum toroidal mirror collimates the beam to fill the entrance pupil of PHEBUS and home-made MgF2 diffuser can be interposed
before or after the mirror to create an extended source and fill the instrument FOV. In the same way as the facility used for subsystem calibrations, various sources and calibrated detectors are available to satisfy the spectral needs. Instrument is placed in the test chamber which is equipped by various types of electrical feedthroughs. Instrument alignment with respect to the incident beam is first made with a laser in visible light and once all the facility is under vacuum, a rotating stage allows very precise rotation of the instrument along the smallest dimension of the slit, which corresponds to the spectral axis.
Figure 13. VUV optical facility in LATMOS laboratory for spectral calibrations of PHEBUS below 190 nm. At the top left of the image we can see PHEBUS accommodated in the test chamber.
Proc. of SPIE Vol. 11180 111802T-13
Downloaded From: https://www.spiedigitallibrary.org/conference-proceedings-of-spie on 18 Jul 2019 Terms of Use: https://www.spiedigitallibrary.org/terms-of-use
We present here after some examples of important results. Figure 14 shows on the left part a stack of all images acquired during a session of FUV channel calibration and the corresponding profile, while the right part shows the spectral resolution in terms of FWHM over the FUV spectral range. This last curve demonstrates that the spectral resolution (FWHM) is within the specifications (< 1.5 nm) for wavelengths below 300 nm and slightly above for upper wavelengths.
Regarding the EUV channel, figure 15 shows the instrument response when illuminated with Argon windowless lamp as source. We can clearly identify the Argon doublet 104.8 nm & 106.6 nm (Ar I) and then evaluate the spectral resolution at these wavelengths: FWHM = 0.55 nm and FW1% = 1.02 nm., which are within the specifications (< 1 nm)
All those spectral resolutions have been computed after substation of dark signal which amounts to 4.5e-5 count per second per pixel for FUV channel and 1.1e-5 count per second per pixel for EUV channel.
Figure 14. Left: Cumulated spectrum (image and profile) in the range 180 nm – 320 nm. Right: corresponding spectral resolution (FWHM).
Figure 15. EUV Argon spectrum (image and profile) for an accumulation of 100 images of 4 seconds of integration time
5.3 Straylight attenuation performances
The instrument must be sensitive to very weak luminous flux, therefore a good attenuation of straylight is needed to achieve the required instrument performances. Straylight measurements were carried out during the first step of the instrument integration, once the mirror, the scanning mechanism, the baffle and the slit were integrated on the main structure.
Proc. of SPIE Vol. 11180 111802T-14
Downloaded From: https://www.spiedigitallibrary.org/conference-proceedings-of-spie on 18 Jul 2019 Terms of Use: https://www.spiedigitallibrary.org/terms-of-use
The whole set was accommodated on a dedicated facility in a way that the assembly can turn around the vertical axis going through the entrance pupil of the baffle. The set was placed in a dark box to protect it from any straylight induced by the setup environment. Then the light flux at slit output could be measured according to the angle of incidence of light rays at the level of the entrance pupil of the baffle. In this case we could deduce the attenuation of the set composed by the baffle, the mirror and the slit, compared to the nominal direct illumination (point source in the middle of the field of view). Measurements were made with two different light sources. At first, we used a Xenon lamp whose advantage is a high level of illumination (P = 75 W) and a large spectral range (200 nm < λ < NIR) adjustable with optical filters, however the beam uniformity is very poor. To solve this problem of homogeneity a laser can be used (Helium-Neon laser, P = 10 mW, λ = 632.8 nm) with a spatial filtering device. It is important to note that the attenuation induced by the collecting part is expected to be, at first order, independent of the wavelength.
Figure 16 represents the normalized incident flux passing though the entrance slit, according to the incidence angle. Two significant transitions are obvious on this curve, the first one around -1 and 1 degree that corresponds to the FOV, and the second one around -8 and 8 degrees that corresponds to the baffle rejection angle. The attenuation beyond the rejection angle is higher than 107, this result is in total compliance with the requirement of 106.
Figure 16. Attenuation power of the collecting part of PHEBUS.
6. CONCLUSION
The PHEBUS spectrometer onboard BepiColombo space mission is about to be launched. To achieve the objectives set by the scientific specifications, the PHEBUS team had to make an instrument that is both compact and efficient. To meet all the imposed constraints (mechanical, thermal, size, scientific objectives) the engineers had to develop a spectrometer with the least possible optical components but with extremely efficient subsystems. Most of its optical subsystems (mirror, gratings, baffle and detectors) and of its mechanical parts (main structure, carbon cover) have proven to be early industrial achievements. In addition, special attention has been given to calibration activities. Thanks to a close collaboration with our Italian partners and to the achievement of specific optical facilities suitable to the unusual spectral range of the instrument (VUV), we have qualified completely the instrument and we have a perfect knowledge of its behavior. A total of five instrument models were completed and four of them were delivered: an optical breadboard (not delivered), a structural and thermal model (STM) delivered in 2010, an electrical model (EM) delivered in 2011, a qualification model (QM) delivered in 2013 (and refurbished into spare model delivered in 2018) and a flight model (FM) delivered in 2015 (Fig. 17).
Proc. of SPIE Vol. 11180 111802T-15
Downloaded From: https://www.spiedigitallibrary.org/conference-proceedings-of-spie on 18 Jul 2019 Terms of Use: https://www.spiedigitallibrary.org/terms-of-use
Figure 17. PHEBUS qualification model (on the left) and flight model (on the right).
REFERENCES
[1] Benkhoff, J., Van Casteren, J., Hajakawa, H., Fujimoto, M., Laakso, H., Novara, M., Ferri, P., Middleton, H.R. and ziethe, R., “BepiColombo-Comprehensive exploration of Mercury. Mission overview and science goals”, Plan. Sp. Sci., 58(1-2), 2-20 (2010).
[2] Chassefiere, E., Maria, J.L., Quemerais, E., Leblanc, F., Okano, S., Yoshikawa, I., Korablev, O., Gnedykh, V., naletto, G., Nicolosi, P., Pelizzo, M.G., Correia, J.J., Gallet, S., Hourtoule, C., Mine, P.O., Montaron, C., Rouanet, N., Rigal, J.B., Muramaki, G., Yoshioka, K., Kozlov, O., Kottsov, V., Moisseev, P., Semena, N., Bertaux, J.L., Capria, M.T., Clarke, J., Cremonese, G., Delcourt, D., Doressoundiram, A., Erard, S, Gladstone, R., Grande, M., Hunten, D., Ip, W., Izmodenov, V., Jambon, A., Johnson, R., Kallio, E., Killen, R., Lallement, R., Luhmann, J., Mendillo, M., Milillo, A., Palme, H., Potter, A., Sasaki, S., Slater, D., Sprague, A., Stern, A. and Yan, N., “PHEBUS: A double ultraviolet spectrometer to observe Mercury’s exosphere”, Plan. Sp. Sci., 58(1-2), 201-223 (2010).
[3] Yoshioka K., Murakami G., Yoshikawa I., Maria J.-L., Mariscal J.-F., Rouanet N., Mine P.-O., Quémerais E., “Optical performance of PHEBUS/EUV detector onboard BepiColombo”, Advances in Space Research, Elsevier, 49 (8), pp.1265-1270, (2012).
[4] Yoshioka, K., Hikosaka, K., Murakami, G., Yoshikawa, I., Yamazaki, A. and Nozawa, H.N., “Development of the EUV detector for the BepiColombo mission”, 41(9), 1392-1396 (2008).
[5] Mariscal J.-F., Rouanet N., Maria J.-L., Quémerais E., Mine P.-O., Zuppella P., Suman M., Nicolosi P., Pelizzo M. G., Yoshikawa I., Yoshioka K. et al., “Probing of Hermean Exosphere by Ultraviolet Spectroscopy: instrument presentation, calibration philosophy and first lights results”, ICSO 2010 International Conference on Space Optics, 4 - 8 October 2010, Oct 2010, Rhodes, Greece. ESA, 6 p., (2010).
[6] Zuppella, P., Corso, A.J., Polito, V., Mariscal, J.F., Rouanet, N., Maria, J.L., Nicolosi, P., Quémerais, E. and Pelizzo, M.G., “Optical subsystems calibration and derived radiometric instrument response of the PHEBUS spectrometer on board of the BepiColombo Mission”, Journal of Instrumentation, IOP Publishing, 7 (10), (2012). [7] Nicolosi, P., Zuppella, P., Corso, A.J., Polito, V., Pelizzo, M.G., Mariscal, J.F., Rouanet, N., Mine, P.O., Quémerais, E. and Maria, J.L., “optical subsystem characterization in laboratory”, Proc. SPIE 8076, 80760B – 80760B – 14 (2011).
Proc. of SPIE Vol. 11180 111802T-16
Downloaded From: https://www.spiedigitallibrary.org/conference-proceedings-of-spie on 18 Jul 2019 Terms of Use: https://www.spiedigitallibrary.org/terms-of-use