HAL Id: hal-02989757
https://hal.archives-ouvertes.fr/hal-02989757
Submitted on 5 Nov 2020
HAL is a multi-disciplinary open access
archive for the deposit and dissemination of
sci-entific research documents, whether they are
pub-lished or not. The documents may come from
teaching and research institutions in France or
abroad, or from public or private research centers.
L’archive ouverte pluridisciplinaire HAL, est
destinée au dépôt et à la diffusion de documents
scientifiques de niveau recherche, publiés ou non,
émanant des établissements d’enseignement et de
recherche français ou étrangers, des laboratoires
publics ou privés.
nebular emission in the central region of NGC 1569 and
its ionization budget
Y Mayya, E Carrasco, V Gómez-González, J Zaragoza-Cardiel, A Gil de Paz,
P Ovando, M Sánchez-Cruces, L Lomelí-Núñez, L Rodríguez-Merino, D
Rosa-González, et al.
To cite this version:
Y Mayya, E Carrasco, V Gómez-González, J Zaragoza-Cardiel, A Gil de Paz, et al.. MEGARA-IFU
detection of extended He ii λ4686 nebular emission in the central region of NGC 1569 and its ionization
budget. MNRAS, 2020, 000, pp.0 - 000. �hal-02989757�
A. Gil de Paz
4, P. A. Ovando
1, M. S´
anchez-Cruces
5, L. Lomel´ı-N´
u˜
nez
1,
L. Rodr´ıguez-Merino
1, D. Rosa-Gonz´
alez
1, S. Silich
1, G. Tenorio-Tagle
1,
G. Bruzual
2, S. Charlot
6, R. Terlevich
1,7, E. Terlevich
1, O. Vega
1, J. Gallego
4,
J. Iglesias-P´
aramo
8,9, A. Castillo-Morales
4, M.L. Garc´ıa-Vargas
10,
P. G´
omez-Alvarez
10, S. Pascual
4and A. P´
erez-Calpena
101Instituto Nacional de Astrof´ısica, ´Optica y Electr´onica, Luis Enrique Erro 1, Tonantzintla 72840, Puebla, Mexico
2Instituto de Radioastronom´ıa y Astrof´ısica, UNAM Campus Morelia, Apartado postal 3-72, 58090 Morelia, Michoac´an, Mexico 3 Consejo Nacional de Ciencia y Tecnolog´ıa, Av. Insurgentes Sur 1582, 03940, Mexico City, Mexico
4Dpto. de F´ısica de la Tierra y Astrof´ısica, and Instituto de F´ısica de Part´ıculas y del Cosmos (IPARCOS), Fac. CC. F´ısicas,
Universidad Complutense de Madrid, Plaza de las Ciencias, 1, E-28040 Madrid, Spain
5Aix Marseille Univ., CNRS, CNES, LAM, Marseille, France
6Sorbonne Universit´e, CNRS, UMR7095, Institut d’Astrophysique de Paris, F-75014, Paris, France 7Institute of Astronomy, University of Cambrige, Cambridge CB3 0HA, UK
8Instituto de Astrof´ısica de Andaluc´ıa, IAA-CSIC, Glorieta de la Astronom´ıa s/n, E-18008 Granada, Spain 9Estaci´on Experimental de Zonas ´Aridas, CSIC, Carretera de Sacramento s/n, E-04120 Almer´ıa, Spain 10FRACTAL S.L.N.E., Calle Tulip´an 2, portal 13, 1A, E-28231 Las Rozas de Madrid, Spain
4 August 2020
ABSTRACT
We here report the detection of extended He ii λ4686 nebular emission in the cen-tral region of NGC 1569 using the integral field spectrograph MEGARA at the 10.4-m Gran Telescopio Canarias. The observations cover a Field of View (FoV) of 12.5 arcsec×11.3 arcsec at seeing-limited spatial resolution of ∼15 pc and at a spec-tral resolution of R=6000 in the wavelength range 4330–5200 ˚A. The emission extends over a semi-circular arc of ∼40 pc width and ∼150 pc diameter around the super star cluster A (SSC-A). The AV derived using Balmer decrement varies from the Galactic
value of 1.6 mag to a maximum of ∼4.5 mag, with a mean value of 2.65±0.60 mag. We infer 124±11 Wolf-Rayet (WR) stars in SSC-A using the He ii λ4686 broad feature and AV=2.3 mag. The He+ ionizing photon rate from these WR stars is sufficient to
explain the luminosity of the He ii nebula. The observationally-determined total He+ and H0 ionizing photon rates, their ratio, and the observed number of WR stars in
SSC-A are all consistent with the predictions of simple stellar population models at an age of 4.0±0.5 Myr, and mass of (5.5±0.5)×105 M
. Our observations reinforce
the absence of WR stars in SSC-B, the second most massive cluster in the FoV. None of the other locations in our FoV where He ii λ4686 emission has been reported from narrow-band imaging observations contain WR stars.
Key words: stars: emission-line – galaxies: star clusters – galaxies: individual (NGC 1569)
? Email: ydm@inaoep.mx
1 INTRODUCTION
Availability of large telescopes equipped with integral field spectrographs has enabled the creation of maps of
He ii λ4686 nebular emission in nearby star-forming galax-ies (e.g.Kehrig et al. 2015,2018). Given that only photons shortward of 228 ˚A (54 eV) can doubly ionize helium, the He ii λ4686 line provides a ground-based tool to trace the hard part of the ultraviolet (UV) spectrum. High mass stars, especially during their short-duration Wolf-Rayet (WR) phase, are the most common sources that emit these hard UV photons (Schaerer 1996). The UV flux emerging from a starburst region depends both on the hardness of the UV spectrum of WR stars as well as on the number of WR stars present. Because of the presence of an expanding at-mosphere, models incorporating specialized line-blanketing treatment are required in order to quantitatively predict the flux of hard UV photons emitted by the WR stars. The emer-gent spectra in models incorporating such treatment (e.g.
Hillier & Miller 1998;Gr¨afener, Koesterke & Hamann 2002) are found to be softer as compared to earlier models that did not take into account opacities from metals (Schmutz, Lei-therer & Gruenwald 1992). On the other hand, the number of WR stars and the duration of the WR phase in a star-burst region depend on metallicity (e.g.Maeder & Meynet 1989; Schaller et al. 1992; Bressan, Chiosi, Fagotto 1994;
Chen et al. 2015), stellar rotation (Meynet & Maeder 2005) and the stellar multiplicity (Eldridge et al. 2017). The calcu-lated rate of He+ ionizing photons at different metallicities depends critically on the mass-loss recipes used during mas-sive star evolution. The general trend from the different set of currently available codes is a decrease in the expected lu-minosity of the He ii λ4686 line with decreasing metallicity. The spectra from Sloan Digital Sky Survey (SDSS) have enabled the detection of the relatively faint He ii λ4686 line in large samples of star-forming galaxies (e.g. Shirazi & Brinchmann 2012). These studies find that the observed He ii λ4686/Hβ intensity ratio does not drop at low metal-licities. In fact, recent studies find the ratio to be increas-ing as the metallicity decreases (Schaerer, Fragos & Izo-tov 2019). Furthermore, these low-metallicity He ii λ4686-emitting galaxies often show only a weak or no evidence of the presence of WR stars (Shirazi & Brinchmann 2012). Thus, questions have been raised on the WR stars as the sole source of ionization of He+ (Plat et al. 2019). Alter-native mechanisms such as hard radiation from high-mass stars in binaries (Eldridge et al. 2017), shocks from super-nova remnants (Garnett et al. 1991;Dopita & Sutherland 1996) and high-mass X-ray binaries (HMXB;Schaerer, Fra-gos & Izotov 2019;Kojima, et al. 2020) are often invoked. Nearby low-metallicity systems offer an opportunity to ad-dress the He+ ionization problem by enabling study of indi-vidual star-forming knots. In a detailed study of the metal-poor (Z=3–4% Z ) galaxy SBS 0335 − 052E using MUSE, Kehrig et al.(2018) discard WR stars as the source of ion-ization and instead propose rotating metal-free stars or a binary population with Z = 10−5 and an extremely top-heavy initial mass function (IMF) as the only plausible way of getting around the problem of the ionization budget. In a recent studySchaerer, Fragos & Izotov(2019) find that the observed He ii λ4686 intensity in metal-poor star-forming galaxies can be naturally reproduced if the bulk of the He+
ionizing photons is emitted by the HMXB, whose number is found to increase with decreasing metallicity. X-ray binaries in a cluster appear only after the death of the most mas-sive stars, and hence this scenario cannot explain the He+
ionization in young systems (Hβ equivalent widths (EWs) >200 ˚A), as illustrated byPlat et al.(2019).
A detailed analysis of the He ii ionization budget prob-lem has been carried out only in a handful of extreme metal-poor galaxies (e.g.Kehrig et al. 2011,2018). Lack of obser-vational data of individual massive stars at these low metal-licities makes the predictions of population synthesis calcu-lations heavily dependent on the theoretical assumptions. On the other hand, model calculations have been better cal-ibrated at the LMC and solar metallicities. However, its de-tection requires sensitive observations, specially aimed at detecting faint emission lines. The newly available spectro-graph MEGARA at the 10.4-m Gran Telescopio Canarias (GTC), equipped with Integral Field Unit (IFU) at spectral resolution ∼6000 has the capability of detecting and map-ping the faint emission lines from extragalactic nebulae (Gil de Paz et al. 2020). In order to exploit this capability, we carried out MEGARA observations of NGC 1569, a dwarf galaxy with a gas-phase oxygen abundance close to that of the LMC (12 + log(O/H)=8.19;Kobulnicky & Skillman 1997). We mapped its central region, which is known to have extended Hα emission (Hodge 1974;Waller 1991; Hunter, Hawley & Gallagher 1993). Throughout this study, we use a distance of 3.1 Mpc, measured using Hubble Space Telescope (HST) observations of the tip of the red giant branch ( Gro-cholski, et al. 2012). This distance is ∼10% smaller than that obtained byGrocholski et al.(2008) using an earlier analy-sis of the same dataset, but is still considerably higher than the 2.2 Mpc distance (Israel 1988) that was being routinely used in studies prior to theGrocholski et al.(2008) work.
NGC 1569 is among the nearest galaxies that harbours young superstellar clusters (SSCs) that are as massive as the Galactic globular clusters. Its most massive SSCs, called A and B, are estimated to have dynamical masses of 4.1 × 10⁵ M
(Ho & Filippenko 1996) and 6.2 × 10⁵ M (Larsen et al. 2008), respectively (after rescaling the masses to the currently used distance of 3.1 Mpc for this galaxy from Gro-cholski, et al. 2012). These two SSCs are at the high-mass end of a population of around 50 SSCs, whose ages range from a few million to several hundred million years (Hunter et al. 2000). The Hα morphology of the galaxy is dominated by Hii regions (Waller 1991), large-scale shells and
super-bubbles (Hunter, Hawley & Gallagher 1993;Westmoquette et al. 2008), with the brightest Hiiregion in this galaxy
as-sociated to the star forming complex surrounding cluster 10 ofHunter et al.(2000) that lies 105 pc (7 arcsec) to the east of SSC-A, and is outside our FoV. Extended X-ray emis-sion is detected in the galaxy, most of which coincides with the Hα bubbles (Martin et al. 2002; S´anchez-Cruces et al. 2015). Giant molecular clouds have been detected, but none of them are associated to SSCs A and B (Taylor et al. 1999). The largest CO cloud complex in the galaxy lies to the east of cluster 10 outside our FoV.
Long-slit spectroscopic observations have established the presence of WR stars in SSC-A, whereas no WR stars have been detected in SSC-B (Gonz´alez-Delgado et al. 1997). Using narrow-band HST imaging observations with the F469N filter,Buckalew et al.(2000) have inferred the pres-ence of WR features from 5 SSCs, including SSC-A, and 7 individual stars, and nebular emission from three additional point sources.Kobulnicky & Skillman(1997) reported faint He ii nebular emission at some of the locations along the
available at the HST resolution. Then, Section 4 deals with the calculation of the number of WR stars and the ionizing photon rate of doubly ionized helium. The ionization budget is discussed in Section 5, and our conclusions are given in Section 6. Measured data in individual fibre spectrum are presented in an appendix.
2 OBSERVATIONS, REDUCTION AND DATA ANALYSIS
2.1 Observations
Spectroscopic observations of the central part of NGC 1569 (RA=04:30:48.5, DEC=+64:50:55.5) were carried out us-ing the recently available MEGARA instrument at the 10.4-m GTC. MEGARA provides multi-object and inte-gral field spectroscopy at low, medium and high spectral resolutions RFWHM ≡ λ/∆λ ∼6000, 12000 and 20000,
re-spectively, in the visible wavelength interval from 3650 to 9700 ˚A, through 18 spectral configurations (∆λ=Full Width at Half Maximum (FWHM) of a line). The IFU, also named Large Compact Bundle (LCB), covers an area on the sky of 12.5 arcsec×11.3 arcsec with 567 fibres for a spaxel size of 0.62 arcsec. To perform simultaneous sky subtraction, the IFU fibres are supplemented by another 56 fibres distributed in 8 mini-bundles of 7 fibres, located at the edge of the field at distances from 1.7 arcmin to 2.5 arcmin from the centre of the LCB. The complete set of 623 fibres is mounted in the LCB spectrograph pseudo-slit. Additionally, a set of robotic positioners host 92 mini-bundles of 7 fibres each, also for a spaxel size of 0.62 arcsec, allowing observations in a field of view (FoV) of 3.5 arcmin×3.5 arcmin in the multi-object spectrograph (MOS) mode. These 644 fibres are arranged in a different slit interchangeable with the LCB pseudo-slit. For a complete description of MEGARA performance at GTC and the first scientific results obtained during the instrument commissioning, see Carrasco et al. (2018) and
Gil de Paz et al.(2018,2020).
The observations reported here were carried out as part of MEGARA guaranteed time on 2019 February 9thin queue mode under dark sky and photometric conditions. The data were obtained using the IFU mode in combination with the LR-B volume phase holographic grating, centred at 4800 ˚A, covering the spectral range from ∼4330 to 5200 ˚A for a res-olution of FWHM=0.78 ˚A with a reciprocal dispersion of 0.21 ˚A/pixel. Three 1200 s exposures were taken at airmasses between 1.25–1.30, and seeing ∼0.9 arcsec. For flux calibra-tion the spectroscopic standard star HR5501 was observed in the same setup as for NGC 1569. Bias, flat field and arc lamp images were also obtained as part of the data package.
images are used to trace the locus of each of the 623 spectra using an automatic routine. The routine fits simultaneously 623 Gaussians every 200 columns and then interpolates the parameters of the Gaussian for each spectral pixel. With this information, the routine generates a weight map for ev-ery fibre that is applied to the data in order to perform the extraction. The procedure allows correcting the flux of each fibre for cross-talk contamination from adjacent fibres to a level of a few per cent, depending on the quality of the spec-trograph focus during the observation and the shape of the spectral PSF for each wavelength and fibre.
A shift along the pseudo-slit axis of the trace locus with dome temperature has been noticed, which needs a correc-tion of the locus for each observed frame. We used sky lines to measure interactively the shifts, which are found to be ∼2 pixels for the three spectral images used in this work. The final product of the DRP is a wavelength-calibrated, sky-subtracted 2D spectral image. This image contains 623 spectra, one spectrum corresponding to each fibre. The stan-dard star is also reduced in an identical fashion. Spectra of all fibres containing the standard star are summed to extract a 1D spectrum, which is used to obtain the flux sensitivity curve using the iraf1 routines for this purpose. The
result-ing sensitivity curve is used to obtain the flux-calibrated 2D images in selected spectral lines and the 3D data cube.
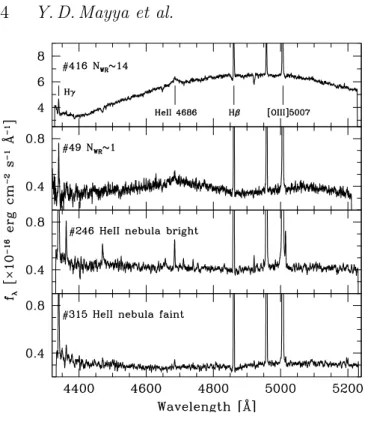
In Fig. 1, we show spectra of 4 fibres illustrating the detection of broad (top two panels) and narrow (bottom two panels) He ii λ4686 features. The Balmer lines Hβ and Hγ, and the [OIII]λ5007 ˚A line are also indicated.
2.3 Line maps, data cube and astrometry
The positions of the fibres in the image plane with re-spect to the image centre are given in millimeters in the image headers. The 2D spectral image is converted into a 3D data cube using these fibre coordinates. A plate scale of 1.212 arcsec mm−1 and a fibre diameter of 0.62 arcsec were used to transform the image coordinates from carte-sian to equatorial systems. To create a map at any sampled wavelength (or a selected band corresponding to a line or a continuum region), we deposited the flux at that wave-length into hexagonal areas (the hexagonal spaxel is in-scribed in a circle of 0.62 arcsec diameter), which correctly simulates the FoV of each fibre on the sky. Alternatively, to visualize extended emission, we also created smooth images by depositing the flux of a fibre into a highly oversampled
1
iraf is distributed by the National Optical Astronomy Obser-vatories, which are operated by the Association of Universities for Research in Astronomy, Inc., under cooperative agreement with the National Science Foundation.
Figure 1. Spectra of individual fibres selected to illustrate broad emission at He ii λ4686 corresponding to WR stars (top two els) and narrow He ii λ4686 from ionized nebula (bottom two pan-els). Four emission features are marked in the top-most spectrum. Fibre#416, which belongs to SSC-A, illustrates the case of a spec-trum containing multiple WR stars, whereas fibre#49 illustrates the spectrum of a marginal detection of a WR star. Fibres#246 and #315 are examples of zones with bright and faint nebular He ii λ4686 line, respectively.
pixel (size=0.021 arcsec) and then convolving it with Gaus-sian kernel of σ=half the fibre size (0.31 arcsec). Finally, the World Coordinate System header parameters were up-dated to force the RA and DEC of SSC-A to their values (RA=04:30:48.233, DEC=+64:50:58.59) in the GAIA-DR2 system. After creating the image, we measured a mean co-ordinate error of ∼0.3 arcsec for different sources in the re-sulting image.
We used the QFitsView facility (Ott 2012) for a quick visualization of the datacube and inspection of spectral fea-tures associated to known strucfea-tures in the image. However, all analysis were carried out on the spectrum of an individual fibre or a sum of spectra of neighbouring fibres associated to a physical source. A datacube from the 2D spectral data was constructed using megararss2cube2, whereas the genera-tion of line maps and their astrometry, extracgenera-tion of spectra for physical regions and measurement of line fluxes were all carried out using our own scripts3
in the iraf environment. We calculated the error as the 1-σ deviation, σl, on
each measured line flux using the expression (Tresse et al.
2
megararss2cube is a tool written in python to con-vert MEGARA reduced dataproducts from the RSS for-mat obtained with megaradrp to a more user-friendly 3-D datacube, available as a repository in GitHub: https://github.com/javierzaragoza/megararss2cube
3 MEGARA-related iraf scripts are available on request to the
first author. 1999): σl= σcD r (2Npix+ EW D ), (1) where D is the spectral dispersion in ˚A per pixel, σc is the
mean standard deviation per pixel of the continuum, Npix
is the number of pixels covered by the line, and EW is the equivalent width of the measured line. We used the value of FWHM to substitute for Npix.
2.4 Ancillary Data
We used HST images in F555W (ACS/HRC), F814W (ACS/WFC), F658N (ACS/WFC) and F469N (WFPC2) bands to associate our spectra to known structures in the image. All the HST images were brought to GAIA-DR2 co-ordinate system using the GAIA stars in the HST images. The first two images allow us to locate the stars and clusters, whereas the latter two trace the Hα and He ii λ4686 emitting sources, respectively. We used the identifications of the SSCs byHunter et al.(2000) and WR and nebular He ii sources byBuckalew et al.(2000). We also used the Chandra/ACIS X-ray image in the 0.2–10 keV band fromS´anchez-Cruces et al.(2015) in order to locate the point and diffuse X-ray sources with respect to the optical sources.
3 DETECTION OF WR AND NEBULAR He ii λ4686 EMISSION
A simple visual inspection of the 2-D spectral image sug-gested the presence of a feature around 4686 ˚A in many fi-bre spectra. Gaussian profile fitting of this feature suggested that in most cases, the feature is narrow with FWHM∼1– 2 ˚A, comparable or slightly above the resolution of the spec-trograph. In some other fibres, the feature is broad with FWHM>6 ˚A. These narrow and broad components are il-lustrated in the bottom two and top two spectra in Fig.1, respectively. The narrow feature is easily identified as the He ii λ4686 emission line from the ionized nebula, whereas the broad component is identified as the blue bump (BB), which is the distinguishing characteristic of WR stars. The BB is a broad spectral feature between 4600 to 4700 ˚A, and consists of broad lines of He and/or N ions from nitrogen-rich WR stars (WN-types), or He and/or C ions from carbon-rich WR stars (WC-types). Among these, the prominent N and C lines are N iii λλ4634/41, N v λλ4603/20, C iii λλ4647/66 and C ivλ4658. WC stars, and hence lines from C ions, are generally absent in low-metallicity environments (see e.g. fig-ure 8 inL´opez-S´anchez & Esteban 2010). Additionally, neb-ular lines He i λ4713, He ii λ4686 and [Fe iii] λ4658 can also contribute to the BB. Some spectra showed both narrow and broad He ii λ4686 features, which required an analysis using multi-Gaussian fitting for the recovery of each component.
Another factor that affects the measurement of fluxes of relatively faint lines is determining the precise shape of the continuum, which requires a signal-to-noise ratio (SNR) of at least 10 in the continuum on either side within ∼100 ˚A of the line of interest. In most continuum-weak fibres this condition is not met. For example, the SNR of the continuum in the bottom three spectra in Fig.1is ∼5 at 4400 ˚A to ∼9 at
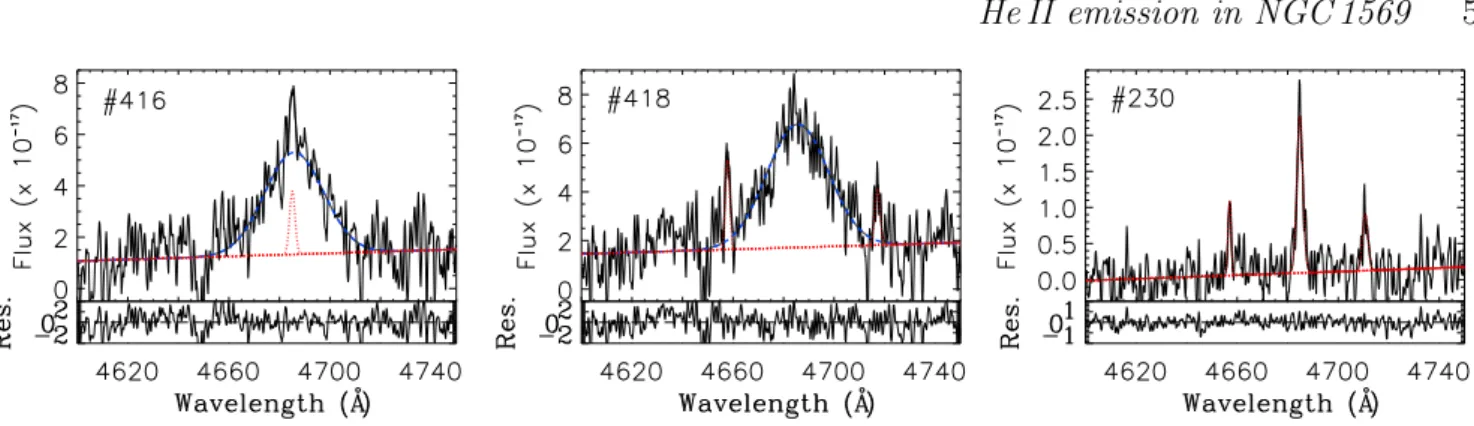
Figure 2. Multi-Gaussian fits to the blue bumps of individual fibres: broad He ii λ4686 line (blue), narrow He ii λ4686 nebular line (red) are shown for 3 representative fibre spectra that require: both the broad and narrow components (left; fibre#416), only the broad component (middle; fibre#418), and only the narrow component (right; fibre#230). The fitted continuum is shown by the red straight line, and the residuals of the fit are shown below each fit. The fluxes in the fitted spectra as well as in the residual are in units of 10−17erg cm−2s−1˚A−1. The middle and right spectra show additional narrow lines that we attribute to [Fe iii] λ4658 and He iλ4713 nebular lines.
4800 ˚A. On the other hand, the top spectrum, which belongs to SSC-A, has a minimum SNR of 23 at 4400 ˚A, increasing to 43 at 4800 ˚A. Stellar absorption lines, most of which are reported byGonz´alez-Delgado et al.(1997) for SSC-A, can be seen in the top-most spectrum.
3.1 Multi-component Gaussian decomposition of the blue bump
It is well established that the individual lines that contribute to the BB can be extracted from multi-component Gaus-sian decomposition technique (see e.g.Brinchmann, Kunth & Durret 2008). We hence carried out multi-Gaussian de-composition fittings using a custom-made code which uses the idl routine lmfit4(see G´omez-Gonz´alez et al. 2020). Before fitting multiple Gaussians, a continuum level is de-fined for each spectrum in a two-step procedure. First, a large-scale continuum is defined for each spectrum using the task continuum in iraf, by fitting a high-order polyno-mial (spline3, order=11) passing through carefully chosen line-free bins in the entire wavelength range of the observed spectrum. Second, any residual local continuum around the BB is accounted for by linearly interpolating line-free zones on either side of the BB. Two of the 3 parameters, the peak intensity I0 and the line width σ that define each Gaussian,
were left free. Any line with a FWHM> 6 ˚A is defined as a broad line associated to a WR star. The third parameter, λ0, is assigned to the rest wavelength of one of the expected
lines from WR stars. The fitting program is executed interac-tively, where the bright nebular lines are fitted first, followed by the He ii broad component. Residuals are examined for a peak near any of the expected line wavelength. If present, a second broad line is fitted and residuals are re-examined. While fitting this second line, the σ and I0 of the first line
were left free. The process continues examining the residuals and adding a new line until the residual flux is less than 3 times the root-mean-square (RMS) noise of the spectrum. In the iterative process, any faint nebular lines are fitted, if
4 The lmfit function (lmfit.pro) does a non-linear least squares
fit to a function with an arbitrary number of parameters. It uses the Levenberg-Marquardt algorithm, incorporated in the routine mrqmin of Numerical Recipes in C (Press et al. 1992).
needed. The method is able to recover the He ii λ4686 com-ponents from WR (broad) and nebula (narrow) even when both are present in a single spectrum. Fig.2illustrates the multi-Gaussian fits for spectra from 3 individual fibres that require both a broad and a narrow He ii λ4686 line (left), only a broad line (middle) and only the narrow line (right). None of our fibre spectra showed broad lines from nitro-gen or carbon ions. A feature is recovered in many fibres at λ=4658 ˚A (see the spectra in the middle and right panels), which matches the wavelength of the C ivλ4658 (broad) fea-ture. However, the width of this line is comparable to that of nebular lines, and hence we identify this feature with the nebular (narrow) line [Fe iii] λ4658.
We used the fitting program to automatically identify broad and narrow He ii λ4686 features in each of the 567 spectra. As mentioned above, the flux at the peak of the fitted Gaussian should be at least 3 times the noise level for it to be considered a detection. The narrow component, which is of nebular origin, is detected in 262 of these fibres and the broad component, in 50. Twenty five of the spectra showing a broad component have an associated narrow component, whereas the remaining 25 show only a broad component.
3.2 Location of fibres with WR features
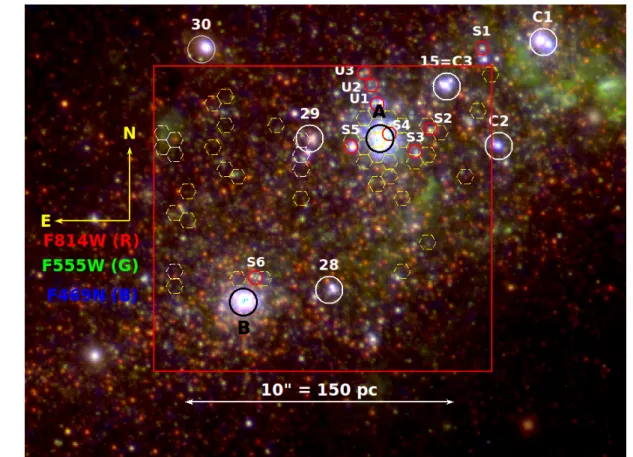
In Fig.3, we show the positions of all the 50 individual fi-bres with broad He ii λ4686 detections (hexagons5), overlaid on an RGB colour-composite image formed by HST images in F814W, F555W and F469N filters, shown as red, green and blue colours, respectively. This set of images was cho-sen in order to highlight the candidate WR stars, which are expected to be continuum-bright sources with He ii λ4686-excess. The red and green images having been taken us-ing broad bands, trace continuum sources, whereas the blue image traces sources that have contribution from emission lines in the 4650–4720 ˚A range. The He ii λ4686 line is the most likely contributor to this image, but as the spectra in Fig.2 illustrate, nebular lines [Fe iii] λ4658 and He i λ4713 could also contribute in this filter. Thus, blueish-looking
5 See Fig.A1in the appendix for the identification numbers of
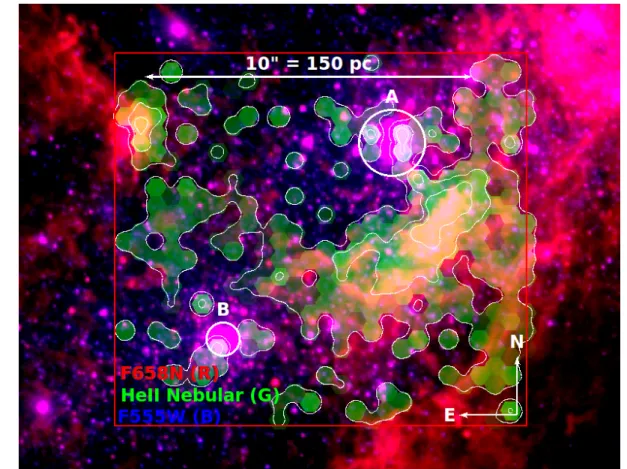
Figure 3. A colour-composite RGB image of the central starburst zone of NGC 1569. The image is formed by combining HST F814W, F555W and F469N band images, as red, green and blue components, respectively. MEGARA/IFU FoV (12.5 arcsec×11.3 arcsec; red rectangle) and image orientation (compass) are shown. The locations of the fibres where we detected a broad He ii λ4686 component are shown by hexagons. The prominent objects in the FoV are identified. These include the two massive clusters SSC-A and SSC-B, and four other clusters (15, 28, 29 and 30) fromHunter et al.(2000). WR sources identified byBuckalew et al.(2000) using the displayed HST F469N image, which intercepts the He ii λ4686 line, are shown. These include four clusters with WR stars (C1, C2, C3 and C4) and six WR stars (S1, S2, S3, S4, S5 and S6). Three sources (U1, U2 and U3) classified as of unknown origin byBuckalew et al.(2000) are also shown. The He ii λ4686 broad feature is detected in 18 adjacent fibres associated to SSC-A. The circles enclosing cluster candidates have a diameter of 1 arcsec, and hexagons have an equivalent diameter of 0.62 arcsec.
continuum-bright sources in this image are the likely WR candidates.Buckalew et al.(2000) used the F469N image in combination with continuum and nebular images to identify WR candidate sources. They classified these as cluster, stel-lar, and unknown origin sources, and named them as C1 to C4, S1 to S6, and U1 to U3 sources, respectively, which are all identified in the figure. In addition, we identified stellar clusters catalogued byHunter et al.(2000) (numbers 15, 28, 29 and 30) and the two well-known SSCs A and B in the figure. Cluster C4, which lies just outside our FoV and is identified as cluster 10 byHunter et al.(2000), is the ioniz-ing cluster of the brightest Hiiregion in this galaxy.
The presence of the He ii λ4686 broad component is the characteristic signature of a WR star. However, given that our observations were carried out at ∼0.9 arcsec seeing and the fibres cover a diameter of 0.62 arcsec, several adjacent fibre spectra should also show up the broad feature in order to associate the inferred feature with the detection of a WR star. Out of the 50 fibres where we inferred He ii λ4686 broad component, 18 contiguous fibres are associated to SSC-A. Some of these fibres could be associated to candidate stellar sources S3, S4 and S5, which are located within the seeing-convolved image of SSC-A.
Of the remaining detections, we infer two locations with four (#417, 419, 421, 423; on the top-left) and three (#145, 149, 153; on the top-middle) contiguous fibres, associated to them. However, a careful scrutiny of the fibres associated to these locations revealed that these fibres are physically next to one of the 18 fibres belonging to SSC-A on the psuedo-slit, and hence the detected broad bump is likely arising due to residual cross-talk from SSC-A. Hence, we ignore the detections in these seven fibres. The rest of the inferred He ii λ4686 broad component corresponds to 25 single-fibre detections, scattered all over the image. One of these detec-tions (#413) is due to cross-talk with SSC-A. Of the remain-ing detections, two coincide with the previously reported candidate stellar sources S2 and S6. If these single-fibre de-tections come from real sources, spectra extracted by sum-ming spectra of fibres adjacent to the location of these fibres also should show a broad He ii λ4686 feature. We carried out the Gaussian decomposition of the BB with the specific pur-pose of detecting these broad features in spectra obtained by summing spectra of at least 3 fibres around the one where we detected the broad feature. None of these summed spectra around the 25 single-fibre detections showed a broad com-ponent. Uncertainty in defining the continuum is the likely
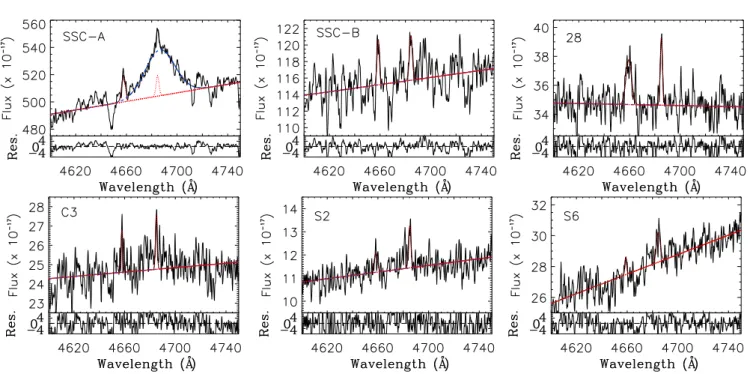
Figure 4. Multi-fibre summed spectra around the BB of SSC-A and other cluster and stellar sources in the FoV of MEGARA/IFU. No WR stars are detected in clusters SSC-B and 28. Star cluster C3 and stellar sources S2 and S6, where the presence of WR stars have been previously reported from the analysis of the HST F469N-band narrow-band images, only show nebular lines in our spectra. The fluxes are plotted in units of 10−17erg cm−2s−1˚A−1, and the bottom panel of each plot shows the residual flux in the same units.
reason for the feature to vanish in summed spectra in spite of them being detected, i.e. the peak flux of the fitted broad (FWHM>6 ˚A) Gaussian profile is >3 times the RMS error of the continuum, in individual fibre spectra. The spectrum for fibre #49 in Fig. 1is one such example. Deeper obser-vations would be required to ascertain the nature of these sources. We consider these detections as marginal and in §4.3 we compare their fluxes to that expected from typical WNL-type WR stars.
The summed spectra allow us to understand the reasons whyBuckalew et al.(2000) interpreted the observed excess emission in the HST/F469N band in C3, S2 and S6 as orig-inating in WR stars. It may be recalled that imaging obser-vations cannot distinguish between the narrow and broad components.Buckalew et al.(2000) assumed it to be a WR detection, if the position of a star or cluster coincides with the position where an excess flux is detected in the F469N band. This selection criterion does not contemplate the pres-ence of extended He ii λ4686 nebular emission. As we discuss in detail below, we have detected extended He ii λ4686 nebu-lar emission in the central zone of NGC 1569. Objects C3, S2 and S6 are stellar sources in which we detect narrow nebu-lar He ii λ4686 and [Fe iii] λ4658 lines in our spectra (see the bottom three spectra in Fig. 4). The narrow lines are not originating in the stellar sources, and are instead part of the extended nebular emission. At the location of the three sources of unknown origin (U1, U2 and U3), we detect only narrow He ii λ4686 line; these sources are also part of the extended nebula.
Our spectral data are used to infer the WR population in known clusters in our FoV. Apart from SSC-A, where we already demonstrated the presence of WR stars, our FoV includes clusters SSC-B, 28, 29, and C3. Among these,
pre-vious spectroscopic observations have already ruled out the presence of WR features in SSC-B (e.g.Gonz´alez-Delgado et al. 1997). No WR stars were inferred in F469N images by
Buckalew et al.(2000) from sources 28 and 29, whereas C3 is a candidate WR cluster. We extracted spectra around all these sources, as well as for SSC-A (C4), by adding spectra of 7 fibres around the location of these clusters. Unfortunately, cluster 29 spectrum suffers from cross-talk problem as sev-eral of its fibres are adjacent to some of the fibres of SSC-A on the pseudo-slit. We hence did not carry out an analysis of search for WR stars in this cluster. Multi-Gaussian analysis was carried out on these summed spectra, which are shown in Fig.4. These fits establish the presence of WR features in summed spectra of SSC-A, and their absence in SSC-B, 28 and C3. The figure also shows (last two panels) the results of the fits to the summed spectra for S2 and S6. Given the closeness of these sources to SSC-A and SSC-B, respectively, we summed spectra of only 3 adjacent fibres in these cases. The broad He ii λ4686 component is not recovered in these summed spectra.
3.3 He ii λ4686 nebular morphology
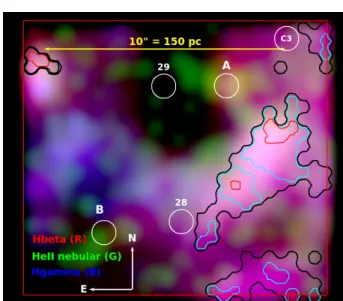
We now discuss the results obtained by muti-Gaussian fit-ting to recover the He ii λ4686 nebular line. Unlike the broad component, the narrow He ii λ4686 line, which is of nebular origin, is detected in nearly half of the total fibres. The fi-bre fluxes and locations are used to create a map, which is shown in Fig.5as the green component of the RGB image. The HST images in F658N (Hα + continuum) and F555W bands are used for the red and blue components, respec-tively. These latter images help us to see the large-scale dis-tribution of ionized gas and stars at the HST resolution.
Figure 5. Colour-composite RGB image showing the morphology of the He ii λ4686 nebular emission (white contours englobing green hexagons) with respect to that of the Hα emission (HST F658N-band shown in red) and stellar continuum (HST F555W image shown in blue). Clusters A and B are marked. The contours corresponds to surface brightness levels of 3, 12 and 20×10−17erg cm−2s−1arcsec−2 in the He ii λ4686 nebular line. The nebular emission is weak from SSCs A and B, and is distributed along a semi-circular arc with the most intense emission coming from a zone ∼40 pc south-west of SSC-A.
Contours corresponding to He ii λ4686 nebular line surface brightness of 3, 12 and 20×10−17erg cm−2s−1arcsec−2are shown.
Clearly the He ii λ4686 narrow emission is not confined to a few point sources, but instead is part of an extended nebula. This emission is distributed along a semi-circular arc of 150 pc (10 arcsec) diameter. The brightest part of the He ii λ4686 nebula lies to the south-west of SSC-A at a dis-tance of ∼40 pc (2.5 arcsec). This brightest part is also the zone closest to SSC-A, where there is an increase in the Hα surface brightness, and corresponds to the Hiiregion
num-bered 3 by Waller (1991). The nebular arc is widest near this zone, reaching ∼40 pc width. The centre of the semi-circular arc does not coincide with SSC-A, and instead is shifted to the east of it by ∼40 pc, roughly coincident with cluster 29. Unfortunately our FoV does not cover the north-ern part, hence we cannot conclude whether the observed arc is part of a complete circular nebula or not. There is no evidence for arc-like structure in the Hα image on the northern side, nor any of the ionized superbubbles (sb) iden-tified byS´anchez-Cruces et al.(2015) match our He ii λ4686 emitting segment or its possible northern counterpart. This can be due to the lower sensitivity of Fabry-P`erot images presented byS´anchez-Cruces et al.(2015) in comparison to the HST images. The He ii λ4686 emitting segment lies be-tween the superbubbles classified as sb4, sb5, sb6 and sb7.
The He ii λ4686 nebular emission is weak in the immediate vicinity of SSC-A and SSC-B.
By mapping the He ii λ4686 nebular emission we can ob-tain the total flux in this line, and from this, the ionization requirements. The data need to be corrected for extinction from dust along the line of sight in the Galaxy as well as the dust in NGC 1569, before we can carry out these calcu-lations. The availability of the extinction-sensitive Balmer lines Hβ and Hγ in our dataset allows us to obtain the ex-tinction from each fibre spectrum. We describe the proce-dure adopted for extinction correction in the next section.
4 EXTINCTION-CORRECTED NUMBER OF WR STARS AND THE He ii IONIZING PHOTON RATE
In this section, we present the extinction map of the zone covered by our IFU observations, and obtain the He ii λ4686 luminosity of the broad and narrow lines, corrected for ex-tinction. The luminosity in the broad component is used to calculate the number of WR stars inferred from our obser-vations, whereas the luminosity in the narrow component is used to obtain the He+ ionizing photon rate. We used
the emission line intensities of Balmer lines (Hβ and Hγ) in our IFU spectra to create maps of the ionized nebula
In §3.1, we described the procedure we followed for decom-posing the narrow and broad components of the He ii λ4686 feature. We measured the fluxes and related quantities of Hβ and Hγ nebular lines in each fibre spectrum using the sin-gle Gaussian fitting option of the IRAF task splot in batch mode. The line fluxes in each fibre are then transformed into maps using the procedure described in §2.3.
Hβ and Hγ emission fluxes were used to obtain the extinction from each fibre spectrum, where both of these lines were detected, using the Balmer decrement method for case B recombination of a typical photoionized nebula (Te=10000 K, ne=100 cm−3; Osterbrock & Ferland 2006)
and the reddening curve of Cardelli, Clayton & Mathis
(1989). Only spectra with a SNR of at least 3 in both the lines are used. The Hβ line is detected at SNR>7 in all the 567 fibres. This line is well-resolved with the FWHM of the fitted Gaussian varying between 1 and 2 ˚A. Some spectra clearly showed signs of more than one velocity component. In 86% of these spectra (487), the Hγ line is also detected at SNR> 3, enabling AV measurements in all these spectra.
The resulting values along with the errors are given in the last two columns of Table A1. However, all measurements are not reliable. A source of error in the derived AV is the
uncertain correction of the underlying absorption in Hβ and Hγ lines. We used a uniform 1 ˚A of correction in EW pro-posed byGonz´alez-Delgado et al.(1997) for both the Hβ and Hγ lines. The underlying absorption affects spectra at loca-tions where we detected strong continuum, some of which belong to the WR stars. Thus, it is reasonable to use the AVobtained for continuum-weak, or alternatively high EW,
spectra for carrying out fibre-to-fibre AVcorrections. As Hγ
is the more critical of the two lines in AV measurements,
we used only those spectra that have EW(Hγ)>8 ˚A. This left us with the best 106 measurements of AV. The
result-ing AV values are plotted against the SNR of the Hγ line,
which is the fainter of the two lines used for determining extinction, in Fig.6. The estimated error on each measure-ment is shown, which is typically ∼0.5 mag. These error bars do not take into account errors introduced by the uncertain correction for the underlying stellar absorption, e.g. the AV
values would be ∼0.2 mag higher or lower depending on no correction, or correction of 2 ˚A (instead of the assumed 1 ˚A), respectively.
Devost, Roy & Drissen (1997) obtained AV using Hα
and Hβ lines for 16 zones spread over the entire galaxy. They found all zones have AV>1.6 mag, with the minimum value
corresponding to a zone in an ionized bubble, which is out-side our FoV. They proposed that this minimum value cor-responds to the extinction from the Galactic dust along the line of sight to NGC 1569.Grocholski, et al.(2012) obtained a marginally higher value (AV=1.8 mag) using an analysis
of the red giant branch of the resolved stellar population in
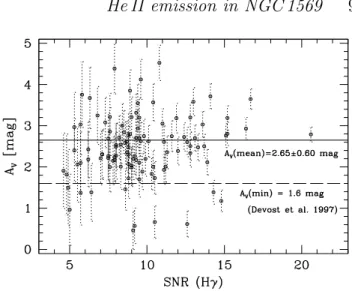
Figure 6. Visual extinction AV obtained from the Hβ and Hγ
nebular lines is plotted against the SNR of the Hγ line, which is the weaker of the two lines. Only 106 spectra for which the EW(Hγ)>8 ˚A are considered for plotting. Among the plotted points, 90% lie above the dashed horizontal line, which corre-sponds to the minimum AVin the entire galaxy found byDevost,
Roy & Drissen(1997). The mean value of our measurements is shown by the solid horizontal line. See §4.1 for further details.
the outer disk of the galaxy. There are many independent measurements of the Galactic extinction in the direction of NGC 1569. Using the line of sight HI observations,Burstein & Heiles(1984) andSchlegel, Finkbeiner & Davis(1998) ob-tained values of AB=2.03 mag (equivalent to AV=1.55 mag)
and AV=2.3 mag, respectively.Israel(1988) andOriglia et al.(2001) analysed the UV spectra of NGC 1569 and sug-gested a foreground extinction of AV=1.7 mag. More
re-cently, Schlafly & Finkbeiner (2011) obtained a value of AV=1.9 mag based on the colour excess of Sloan Digital
Sky Survey (SDSS) stars that have spectroscopic data. All these values, with the exception of one (Schlegel, Finkbeiner & Davis 1998), are compatible with a Galactic extinction value of AV=1.6 mag proposed by Devost, Roy & Drissen(1997) after taking into account measurement er-rors. We show this lower limit by a dashed line in Fig. 6. Ninety per cent of our measurements are above this line. Nine of the 11 measurements below this line are consistent with AV=1.6 mag if we calculate AV without any
absorp-tion correcabsorp-tion. Thus, taking into account external errors, our data are in agreement with a minimum AV=1.6 mag
proposed byDevost, Roy & Drissen(1997). The rest of the Hiiregions observed byDevost, Roy & Drissen(1997) have
a mean value of AV=2.26 mag, implying an average
inter-nal extinction of 0.66 mag for NGC 1569. We obtain a mean AV=2.65±0.60 mag for 95 spectra having AV>1.6 mag. This
implies an average internal extinction of 1.05 mag for the zone covered by our observations.
We used the AVvalues obtained in these 95 fibres to
cre-ate an extinction map, whose contours are shown in Fig.7, overlaid on a nebular colour-composite image, formed by combining Hβ, He ii λ4686 and Hγ images as red, green and blue components, respectively. All the three nebular images are smoothed using a Gaussian kernel of 0.31 arcsec fol-lowing the procedure described in §2.3. As the Hγ to Hβ
Figure 7. Extinction contours superposed on the MEGARA RGB nebular images. Smoothed images in Hβ, He ii λ4686 and Hγ are used as red, green and blue components, respectively. The contours corresponding to AV=1.6, 2.6 and 3.6 mag are shown in
black, cyan and red colours, respectively. The noise in the mea-sured fluxes in individual fiber spectra did not allow the determi-nation of reliable AV values outside the black contours, though
emission is seen in this smoothed image. Known sources in the FoV are labelled. The zone with the highest He ii λ4686 nebular emission (south-west of SSC-A) is also the zone with the highest AV. The nebular emission follows a semi-circular arc of ∼150 pc
diameter.
ratio is sensitive to extinction, the colour in the image is expected to change from blue to red as extinction increases. The zone with the highest He ii λ4686 nebular surface bright-ness (south-west of SSC-A) is also the zone with the highest AV, reaching values ∼4 mag. Extinction smoothly decreases
from this point towards the south-east, reaching the Galac-tic values of AV=1.6 mag at the boundaries of the detected
zone. High extinction is also inferred from the zone with weak nebular emission in the bottom-right corner of the im-age, and a zone at the top-left corner of the image. Neb-ular lines are weak in almost all continuum-bright regions, including in SSC-A, which prevented us from determining AVfor these sources. We have assigned the Galactic values
of AV=1.6 mag to all regions outside the black contours,
where AVcould not be reliably measured. Fig.7also allows
us to compare the large-scale morphology of He ii λ4686 neb-ula (green) with that of the ionized gas traced by Balmer lines at the same resolution. The Hiigas is also distributed
along the semi-circular arc traced by the He ii nebula, both showing a clear hole in the central zone of their intensity distributions.
4.2 Total He ii ionizing photon rate
The availability of an extinction map allows us to apply fibre-to-fibre extinction corrections. We used a uniform value of AV=1.6 mag to all spectra where AV could not be
mea-sured reliably. Summing all these fluxes, we obtain a total He ii λ4686 flux of 9.13 × 10⁻¹⁴ erg cm−2s−1. This corre-sponds to a L(He ii λ4686) of 1.0×1038erg s−1and a Q(He+) of 1.0 × 1050 photon s−1
using the basic photo-ionization
equation fromOsterbrock & Ferland(2006), Q(He+) photon s−1 = L(He IIλ4686) Eλ4686 × αB(He +)
αeff(He IIλ4686)
(2)
= 1.02 × 1048L(He IIλ4686)
1036erg s−1 , (3)
where Eλ4686, is the energy of the He ii λ4686 photon, and
αBand αeff are case-B recombination coefficients. We used
the αB and αeff assuming reasonable Te=10000 K and
ne=100 cm−3for the nebula. The calculated Q(He+) would
change by less than 10% for the entire range of Te and ne
covered by the photoionized nebulae (Kehrig et al. 2015). The total extinction-corrected Hβ flux from the same regions is 4.44 × 10⁻¹²erg cm−2s−1. This is equivalent to a Lyman continuum rate Q(H0) of 1.0 × 1052photon s−1, us-ing an equation similar to equation2but for Q(H0), which is
Q(H0)
photon s−1 = 2.10 × 10
48 L(Hβ)
1036erg s−1, (4)
where L(Hβ) is the luminosity of the Hβ line. The above equations result in the ratio
Q(He+)/Q(H0) = 0.486 ×L(He IIλ4686)
L(Hβ) . (5) The luminosity of He iiλ4686 corresponds to 2.05% of the Hβ luminosity, which results in a value of Q(He+)/Q(H0)=
0.0100±0.0002.
The emission EW of Hβ of a starburst population is a well-known age indicator. For unresolved regions, it is one of the quantities easiest to obtain from spectroscopic data. Furthermore, it is independent of extinction as long as the ionizing cluster and the nebula are spatially coincident, or there is no differential extinction between cluster stars and nebula. However, in a resolved nebula such as the one dis-cussed here, determination of EW(Hβ) is non-trivial. As the ionized nebula is spatially separated from the ionizing clus-ter, we made the assumption that the photoionization from SSC-A is responsible for the total observed Hβ flux. With this assumption, we divided the observed integrated Hβ flux by the continuum flux in the integrated spectrum of SSC-A (displayed in Fig.4), measured close to the Hβ line. We obtained EW(Hβ) under three assumptions. The first one is that the ratio is independent of extinction. In the sec-ond case, the continuum flux is corrected by AV=2.3 mag,
and the Hβ flux is corrected for the extinction determined by the Balmer decrement method. In the third case, the same Hβ flux correction was used, but the continuum flux was corrected by making use the minimum extinction of AV=1.6 mag. The three assumptions give values of 75 ˚A,
75 ˚A, 160 ˚A, respectively.
4.3 The number of WR stars in the mapped zone While fitting the BB with multi-Gaussians, we have looked for N (N iii λλ4634/41) and C (C iii λλ4647/66 and C ivλ4658) broad lines in addition to the broad He ii λ4686 feature. In all spectra, including that of SSC-A, only one broad component was required, which is the He ii λ4686 line. In some spectra, a nebular [Fe iii] λ4658 line is seen at the expected broad C ivλ4658 line, where our fitting procedure
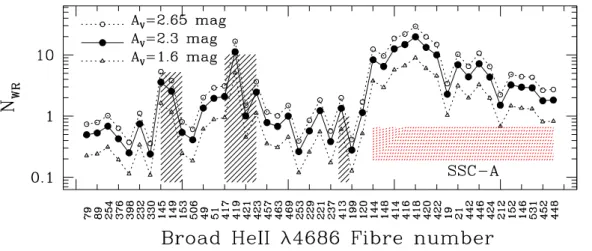
Figure 8. The number of WR stars, defined as the observed He ii λ4686 broad line luminosity divided by the typical luminosity of a WNL star (1.22 × 1036 erg s−1), vs fibre number. All 50 individual fibres where we detected broad He ii λ4686 feature are shown.
The numbers are plotted for three values of extinction: AV=1.6 mag, the minimum along the line of sight to NGC 1569 (triangles),
AV=2.65 mag, the mean determined for the ionized nebula (open circles), and AV=2.3 mag, optimum value for SSC-A (solid circles).
Fibres belonging to SSC-A, and those that have cross-talk with fibres of SSC-A are indicated by red shaded area, and diagonally hatched area, respectively. SSC-A contains 124 WR stars for AV=2.3 mag.
would have been able to recover a broad feature even in the presence of an overlying narrow line. The absence of any of the C lines points to the absence of WC stars in the observed zone. Previous observations of SSC-A that had covered the red bump (C iv λλ5801/12) part of the spectrum had al-ready indicated the absence of WC stars (Gonz´alez-Delgado et al. 1997), which is not unusual given that its metallicity is lower than solar (L´opez-S´anchez & Esteban 2010). Thus, we conclude that all our detections originated in WN stars. The relative weakness of N iii λλ4634/41 suggests these are WNL stars.
We now estimate the number of WR stars in each of the fibres where the broad He ii λ4686 feature was detected in single-fibre spectra. As pointed out in §3.2, 18 of these fibres belong to SSC-A, and 8 other fibres are in cross-talk with fibres belonging to SSC-A. Single-fibre detections in rest of the fibre spectra are considered tentative, as the de-tected broad feature could not be recovered by summing spectra of neighbouring fibres. The number was estimated by dividing the observed luminosity in the He ii λ4686 broad feature by the typical luminosity of a WNL star which is ∼1.22×1036erg s−1
(L´opez-S´anchez & Esteban 2010) for the metallicity of NGC 1569. This value is ∼30% smaller than the corresponding value at the Solar metallicity (Vacca & Conti 1992). The observed luminosities of the He ii λ4686 broad feature in each fibre need to be corrected for extinc-tion. As discussed above, the AVvalues derived at the
posi-tions of WR stars are highly unreliable, because of low neb-ular flux and high underlying Balmer absorptions at these locations. Larsen et al. (2011) found the colours of the re-solved stellar population of SSC-A to be consistent with AV=2.3 mag. This suggests that the internal extinction of
the cluster stars is 0.35 mag lower than the mean value of the nebula, as expected for an attenuation law like the one proposed by Calzetti, Kinney & Storchi-Bergmann (1994). Hence, AV=2.3 mag seems the most appropriate value to use
to correct the fluxes of the He ii λ4686 broad feature from SSC-A. We hence calculate the number of WR stars using
this optimum value AV=2.3 mag. We also calculate the
min-imum and maxmin-imum number corresponding to AV=1.6 mag
and AV=2.65 mag, respectively.
In Fig.8, we show the estimated number of WR stars in each fibre where the broad He ii λ4686 feature is inferred, in-cluding those fibres with tentative detections. The solid sym-bols joined by solid lines indicate the number using the opti-mum value for SSC-A of AV=2.3 mag, whereas the other two
lines correspond to minimum (AV=1.6 mag, triangles joined
by dotted lines) and mean nebular (AV=2.65 mag, circles
with dotted lines) extinction. Fibres assigned to SSC-A are identified (red shaded area), as well the 8 fibres that are affected by cross-talk with SSC-A (black diagonal hatched area). With the optimum value of AV=2.3 mag, all the fibres
associated to SSC-A have the luminosity of at least 1 WNL star, with one of the fibres (#418) containing as many as 19 WNLs. This fibre belongs to the core of SSC-A. In total, we find 124±11 WNL stars in SSC-A by adding the numbers in each one of the 18 fibres, where the quoted error assumes poissonian statistics. This number agrees with the corre-sponding number obtained by fitting the multi-Gaussian on the spectra summed over 19 fibres covering the SSC-A. De-tected fluxes correspond to 56±7 and 186±13 WNL stars if we adopt AV=1.6 mag or AV=2.65 mag, respectively. The
uncertainty in the modeling of the extended wings of the spa-tial profile of the PSF of the fibres for those SSC-A spaxels where the WR bump is detected might lead to an under-estimation to the total number of WR stars in SSC-A that could be of the order of a few per cent. Among the other single-fibre detections, only sources belonging to fibres #49 and #51 have NW Rat least one for AV>2.3 mag. Detected
fluxes in the rest of the fibres are less than the flux expected for a WNL star. As discussed in §3.2, these detections were considered as tentative due to the non-recovery of the broad component in spectra obtained by summing spectra of neigh-bouring fibres.
Gonz´alez-Delgado et al.(1997) have estimated the num-ber of WR stars in SSC-A from their long-slit
spectro-scopic data assuming an AV=1.6 mag. Using an older
dis-tance estimate of 2.2 kpc, and luminosity of a WNL star of ∼1.7×1036erg s−1
fromVacca & Conti(1992), they esti-mated 24 WNL stars from their spectra, which corresponds to 66 WNL stars for the values used in our work. Our value for AV=1.6 mag is comparable with this value. On the other
hand, the number of WR stars estimated based on the HST narrow band image in the F469N filter by Buckalew et al.
(2000) is 51±19 (AV=1.6 mag, distance = 2.2 kpc) WNL
stars, which corresponds to 141 WNLs for the distance and WNL luminosity used in our work. This is 2.5 times higher than our value. As noted earlier (see Fig.4for SSC-A), neb-ular lines are weak for SSC-A, and hence it is unlikely that this discrepancy comes from the contribution of the nebular lines (e.g. He ii λ4686, He i λ4713 and [Fe iii] λ4658) to the inferred flux in the F469N filter. Residual error in contin-uum subtraction because of the strong contincontin-uum of SSC-A could be the most likely reason for the overestimation of the number of WR stars.
5 THE IONIZATION BUDGET OF He ii 5.1 Ionization by WR stars
The region of NGC 1569 analyzed in this work is domi-nated by the SSCs A and B in continuum light (Arp & Sandage 1985). Prada, Greeve & McKeith (1994) inferred the presence of Red Super Giants (RSGs) in both the SSCs A and B. SSC-A is made of two components, separated by 0.2 arcsec (3 pc), called A1 and A2 by De Marchi et al.
(1997). Gonz´alez-Delgado et al. (1997) found spectral fea-tures characteristic of both the WR stars and RSGs in their ground-based long-slit spectra of SSC-A.Origlia et al.(2001) analysed HST UV spectra of SSC-A and suggested that the RSGs and WR features are orginiated in A1 and A2 com-ponents, respectively, with the age of the latter component not exceeding 5 Myr.Larsen et al.(2011) carried out pho-tometry of the stars in the periphery of the clusters A and B on the HST images to obtain turn-off ages in the colour-magnitude diagram (CMD). They found RSGs in the CMD of SSC-B, but not in SSC-A. If the RSGs are restricted to the A1 component asOriglia et al.(2001) suggested this im-plies this component is centrally concentrated and the stars in the periphery are part of A2, the younger of the two sub-clusters. Based on the absence of RSGs in the CMD, they derived an upper age limit of 4.5 Myr for this component. On the other hand, they obtained an age of 16 Myr for SSC-B. Thus, at present SSC-A is in the WR phase, when a clus-ter is most efficient in producing He ii ionizing photons. We point out that the bright Hα emission seen at the top-right corner of the image presented in Fig.5is due to ionization by cluster 10 (Westmoquette et al. 2007), which coincides with WR cluster C1 ofBuckalew et al.(2000). We here in-vestigate whether SSC-A alone is capable of producing the observed luminosity of the He ii λ4686 nebular line.
The principal sources of He ii ionizing photons in young stellar systems are O stars and their evolutionary products, such as WR stars. These stars have extended atmospheres with high mass-loss rates, hence a calculation of the rate of He ii ionizing photons has to take into account the radi-ation transfer through these atmospheres. In recent years,
such spectra are available from CMFGEN code (Pauldrach, Hoffmann & Lennon 2001; Hillier & Miller 1998; Smith, Norris, Crowther 2002) for O and WR stars, and from the Potsdam PoWR library (Gr¨afener, Koesterke & Hamann 2002) for WR stars. We compared our observed values with publicly available Simple Stellar Population (SSP) models that have incorporated either CMFGEN or PoWR spectra in their codes. Calculations are available at discrete values of metallicity. The gas-phase oxygen abundance of NGC 1569 corresponds to Z=0.006 for a depletion of 30% of oxygen on to dust grains and assuming [O/Fe]=0.0 (Gutkin, Char-lot & Bruzual 2016). We illustrate the results for models using Z=0.008, which is the closest metallicity to that of NGC 1569, and comment on the metallicity dependence of the obtained results. A summary of the Z=0.008 models we used is given in Table1.
The codes we used are, STARBURST99 (Leitherer et al. 1999;Leitherer, et al. 2014) with Padova (SB99/Padova;
Bressan, Chiosi, Fagotto 1994) and Geneva high-mass loss (SB99/Geneva; Meynet, et al. 1994) evolutionary tracks, PopStar (PopStar/Padova; Moll´a, Garc´ıa-Vargas & Bres-san 2009) with an updated version of the Bressan, Chiosi, Fagotto(1994) Padova tracks, two versions of GALAXEV: BC03/Padova (Bruzual & Charlot 2003) based on tracks from Bressan, Chiosi, Fagotto (1994) and C&B/Padova (Charlot & Bruzual, in preparation; seeGutkin, Charlot & Bruzual 2016;Plat et al. 2019) based on tracks from Chen et al.(2015), and the BPASS (Eldridge et al. 2017) that uses Cambridge evolutionary tracks in single (BPASS/single) and binary (BPASS/binary) mode. STARBURST99 and Pop-Star make use of CMFGEN code, whereas GALAXEV and BPASS use PoWR code, to model the extended atmospheres of WR stars. We downloaded the latest results from these codes from the websites of the respective codes, uniformly usingKroupa (2001) IMF between 0.15 M to 100 M . In
the case of BPASS models, the detailed calculations of ra-tios of different lines, including that of I(He ii λ4686)/I(Hβ), has been provided byXiao, Stanway & Eldridge(2018). We used the ratios corresponding to the ionization parameter of log U = −1.5 and an atomic density of 1 atom cm−3. For the rest of the models, we used Eqn.5to convert the ratio of He+ to H0 ionizing photon rates to a flux ratio
I(He ii λ4686)/I(Hβ).
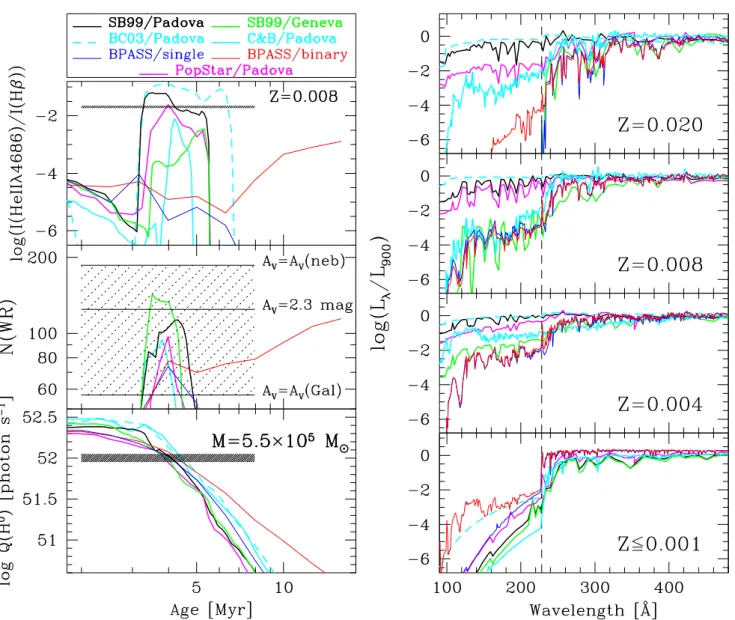
Results of the comparisons are presented in Fig.9 on the left panels. Horizontal hatched areas in each panel en-compass the entire range of observable quantities with ac-count for observational errors. For I(He ii λ4686)/I(Hβ) and Q(H0), errors are taken as 10%, whereas for the number of WR stars, the main source of error is the uncertainty in extinction correction.
The model Q(H0) decreases monotonically with age,
whereas the nebular I(He ii λ4686)/I(Hβ) ratio has a well-defined peak at ∼4 Myr, which corresponds to the appear-ance of WR stars in the cluster. This ratio is independent of distance, cluster mass, extinction, the chosen nebular pa-rameters (temperature and density), and the choice of IMF parameters, as long as the upper cut-off mass is not very much different from 100 M . Hence, among the three
plot-ted quantities, the age derived from I(He ii λ4686)/I(Hβ) ratio is the most reliable. Three models that use Bres-san, Chiosi, Fagotto(1994) Padova evolutionary tracks have peak values of I(He ii λ4686)/I(Hβ) higher than the observed
Figure 9. (Left panels) Comparison of observed quantities in NGC 1569 with Population Synthesis models. The plotted observed quantities (horizontal hatched areas) are the ratio of integrated nebular He ii λ4686 line flux to that of Hβ line (top-left), number of WR stars in SSC-A (middle-left) and the rate of hydrogen ionizing photons determined from the integrated Hβ flux (bottom-left). Results from 7 different population synthesis models are shown, which are identified in a box above the plots (see text and Table1for details of these models). Models that use Padova evolutionary tracks are able to reproduce the observed values for a cluster of mass=5.5×10⁵M
at an age of 4 Myr. All models use Kroupa IMF at Z=0.008, which is the metallicity closest to that of NGC 1569 available in all the codes. (right panels) Spectral shape near the He+ ionizing edge (228 ˚A) at the 4 indicated metallicities during the WR phase. Spectra
are shown normalised to their flux at 900 ˚A wavelength. All spectra show a jump blueward of 228 ˚A at the lowest plotted metallicity. However, at higher metallicities the spectral shapes blueward of 228 ˚A for the plotted models do not coincide, with the spectra being harder in models incorporating Padova tracks as compared to those obtained using other tracks.
value in NGC 1569 (see Tab. 1). The ratio is marginally smaller for model that makes use of the results from the new Padova tracks (Chen et al. 2015), whereas in the other three models this ratio is much lower. All the models re-produce the observationally estimated Q(H0) for a cluster of mass (5.5±0.5)×105 M
in its WR phase. The observed
EW(Hβ) is also consistent with the value expected during the WR phase for single star evolutionary models (see col-umn 7 in Tab. 1). The number of WR stars predicted in
all models agrees with the best estimation of the observed value to within 30% for the mass inferred above. The WR phase in single star evolutionary models lasts between ∼3.5– 5 Myr. The limits for star cluster age are determined from the condition that the model predicted number of WR stars for the above inferred mass exceeds the lower limit for the observationally inferred number of WR stars in SSC-A. This age range, as well as the age at which I(He ii λ4686)/I(Hβ)
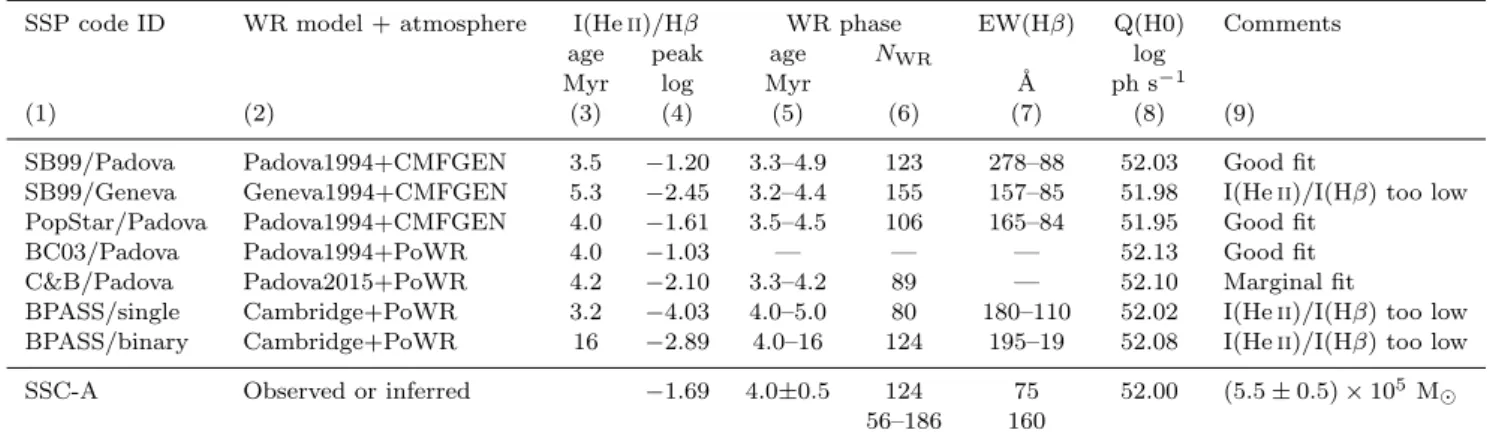
Table 1. Comparison of Population Synthesis model results for Z=0.008 with observations of SSC-A
SSP code ID WR model + atmosphere I(He ii)/Hβ WR phase EW(Hβ) Q(H0) Comments
age peak age NWR log
Myr log Myr ˚A ph s−1
(1) (2) (3) (4) (5) (6) (7) (8) (9)
SB99/Padova Padova1994+CMFGEN 3.5 −1.20 3.3–4.9 123 278–88 52.03 Good fit
SB99/Geneva Geneva1994+CMFGEN 5.3 −2.45 3.2–4.4 155 157–85 51.98 I(He ii)/I(Hβ) too low PopStar/Padova Padova1994+CMFGEN 4.0 −1.61 3.5–4.5 106 165–84 51.95 Good fit
BC03/Padova Padova1994+PoWR 4.0 −1.03 — — — 52.13 Good fit C&B/Padova Padova2015+PoWR 4.2 −2.10 3.3–4.2 89 — 52.10 Marginal fit
BPASS/single Cambridge+PoWR 3.2 −4.03 4.0–5.0 80 180–110 52.02 I(He ii)/I(Hβ) too low BPASS/binary Cambridge+PoWR 16 −2.89 4.0–16 124 195–19 52.08 I(He ii)/I(Hβ) too low SSC-A Observed or inferred −1.69 4.0±0.5 124 75 52.00 (5.5 ± 0.5) × 105M
56–186 160
(1)–(2): Model name, evolutionary tracks and WR atmospheric models used (Padova1994=Bressan, Chiosi, Fagotto 1994; Geneva1994=Meynet, et al. 1994; Padova2015=Chen et al. 2015). Last row contains observationally inferred quantities. The tracks used in PopStar is a modified version of Padova1994 tracks as described inMoll´a, Garc´ıa-Vargas & Bressan(2009); (3) age at which
nebular I(He ii λ4686)/I(Hβ) ratio is maximum; (4) maximum value of I(He ii λ4686)/I(Hβ) in the model in log units; (5) The age interval over which the model has more than the observationally estimated minimum number of 56 WR stars, for the determined mass.
The last row contains the age range over which models using Padova tracks reproduce the observed I(He ii λ4686)/I(Hβ); (6) The maximum number of WR stars in the model in the WR phase. Last row contains the best estimation and the possible range depending
on the assumption on extinction; (7) range of EW(Hβ) for the age range in column 5. EW(Hβ) decreases monotonically with age. Observed range in last row corresponds to the minimum and maximum values based on different assumptions on differential extinction
(see text for details); (8) model log(Q(H0)) at the most likely age (4 Myr) and mass (5.5×10⁵M
); (9) comments on the comparison
between the observations and model. Last row contains the best determined mass and error on it, which takes into account the error on the determined age.
Figure 10. Maximum values of the nebular I(He ii λ4686)/I(Hβ) ratio (points joined by lines) reached as a function of the abun-dance for the SSP models indicated close to each curve. The observed value for NGC 1569 is indicated, where the range in metallicity takes into account 10–30% depletion of oxy-gen into dust grains (Gutkin, Charlot & Bruzual 2016). The observed values are in agreement with the highest values of model I(He ii λ4686)/I(Hβ) ratio, that happens between Z=0.004 and Z=0.008 for new (C&B/Padova) as well as old Padova (SB99/Padova, PopStar/Padova) models.
ratio reaches its peak value, are given in Table1, in columns 5 and 3, respectively.
It is interesting to note that the SB99/Padova and SB99/Geneva models use the same atmospheric models in the WR phase, but Geneva evolutionary tracks have lower I(He ii λ4686)/I(Hβ) in spite of having ∼25% more number of WR stars. This implies that the low values of I(He ii λ4686)/I(Hβ) in SB99/Geneva models are not due to lack of WR stars, but due to the different surface pa-rameter values in these models as compared to those in the Padova tracks. Both the single and binary BPASS models predict systematically a smaller number of WR stars, and a lower peak value of I(He ii λ4686)/I(Hβ) at the 3–5 Myr age. In binary models, peak values of these two parameters are reached at later ages (∼16 Myr) when Q(H0) falls by a factor of 30 with respect to its values at the WR phase in single star evolutionary models. The observed EW of Hβ is not in favour of this advanced age.
In the right panel of Fig.9, we plot the typical emer-gent spectum around the He+ ionization edge (228 ˚A; the dashed vertical line) during the WR phase (4 Myr for all models except BPASS where it is 3.2 Myr) for a range of metallicities. All spectra are normalized to their fluxes at λ=900 ˚A. The normalisation wavelength is specifically chosen to be slightly blueward of the H0 ionization edge
(912 ˚A), so that the shape of the plotted spectra blueward of 228 ˚A is an indicator of the I(He ii λ4686)/I(Hβ) ratio. The spectra in the four models incorporating the Padova tracks (SB99/Padova, PopStar, BC03 and C&B) exhibit more He+ ionizing photons blueward of 228 ˚A for metallicities Z>0.004 than those in the SB99/Geneva and BPASS models. At these metallicities, the emergent spectrum using the new Padova tracks (C&B/Padova) is softer than that using the older Padova tracks, but it is still harder than that obtained in
served gas-phase abundance of oxygen, the metallicity Z can be as low as Z=0.004 if less than 10% of oxygen is depleted on to dust grains (Gutkin, Charlot & Bruzual 2016). Given that the hardness of the spectrum blueward of the He+
ion-ization edge depends on metallicity, we now examine the be-haviour of I(He ii λ4686)/I(Hβ) ratio with metallicity during the WR phase. This is illustrated in Fig.10for all the mod-els discussed in this work. The observed ratio in NGC 1569 is well reproduced for a metallicity range of Z=0.004–0.008 in all SSPs that use Padova tracks, independent of whether CMFGEN or PoWR models are used to represent the at-mospheres of WR stars. In comparison, SSP models using Geneva tracks and BPASS models predict more than an or-der of magnitude lower values.
It can be seen in Fig.10that the I(He ii λ4686)/I(Hβ) ratio decreases sharply at Z<0.004 in models using Padova tracks. The maximum I(He ii λ4686)/I(Hβ) ratio at the lowest plotted metallicity (Z=0.0004) corresponds to the BPASS/binary model. However, the ratio just about reaches 0.01. The observed ratio in metal-poor galaxies is often higher that these predicted values (see Shirazi & Brinch-mann 2012). In fact, observed data show a gradual tendency for the nebular I(He ii λ4686)/I(Hβ) ratio to increase with decreasing metallicity reaching values as high as ∼0.06 in the most metal-poor galaxies known (Schaerer, Fragos & Izotov 2019). This incapability of the SSP models to reproduce the observed I(He ii λ4686)/I(Hβ) ratio at low-metallicities (Z<0.004) is often referred to as the He+ ionization budget problem. The problem starts arising just below the metallic-ity of NGC 1569. At these low metallicities, the problem is aggravated due to the small number of WR detections. For example, I Zw 18, one of the most metal-poor galaxies, emits as much He+ ionizing photons as SSC-A in NGC 1569, but it has at the most 9 WR stars detected (Kehrig et al. 2015) as compared to the 124 WR stars in SSC-A. A comprehen-sive analysis of this problem was carried out recently byPlat et al.(2019). They used the same C&B/Padova model that we have used here, and calculated the I(He ii λ4686)/I(Hβ) ratio for a variety of additional input physics not explored in this study. They find that the conditions most favourable to produce I(He ii λ4686)/I(Hβ)> 0.01 at low metallicities include: (1) the presence of stars significantly more mas-sive than 100 M , (2) extremely high ionization parameter,
log(U ) > −1, (3) the presence of interacting binaries that produce X-rays, (4) ionization of He+by radiative shocks, or
(5) when analysing intergrated spectra of distant galaxies, ionization of He+ by an active galactic nucleus. It is likely that more than one of these conditions are met in some of the metal-poor galaxies.
In summary, the observed number of Q(H0) from
neb-ula surrounding SSC-A and NWR in SSC-A are
consis-tent with each other for all models for a cluster mass of
is expected given that the SSC-A has two populations, a cen-trally concentrated population (A1) containing RSGs (older than 7 Myr) and a slightly extended component (A2) con-taining WR and O stars. Our measured mass is based on the ionizing flux and hence corresponds to the mass of the com-ponent A2. On the other hand, the photometric mass derived byLarsen et al.(2011) is based on integrated photometry of stellar light, and hence it includes the mass of both the components. On the other hand, the mass derived by us is ∼25% higher than the dynamical mass of 4.1 × 10⁵
M
ob-tained byHo & Filippenko (1996) using spectral lines orig-inating in cool supergiants.Ho & Filippenko (1996) com-mented that the velocity dispersion obtained from cool su-pergiants in the integrated spectrum could underestimate the mass by as much as a factor of 2. Furthermore, the cool supergiants belong to the older of the two populations. The derived dynamical mass is expected to be the total of the two populations if they are dynamically mixed. The pres-ence of hot massive stars, but not cool supergiants, in the periphery of SSC-A argues against such a mixing (Larsen et al. 2011). Measurements of velocity dispersion using spectral lines sensitive to hot stars (e.g. He absorption lines which are prominent in the spectrum of SSC-A) could help to ad-dress this issue. MEGARA has the capability of obtaining velocity dispersion in its high resolution mode, providing a possibility of addressing this issue in the near future.
5.2 Morphology of the He ii λ4686 nebula and the location of SSC-A
We found that the entire observed He ii λ4686 emission can be understood in terms of the ionization from WR stars in SSC-A. However, the observed He ii λ4686 emission is not co-incident with the location of the ionizing cluster. Instead, the most intense part of the ionized nebula both in the Balmer and in the He ii λ4686 lines lies ∼40 pc to the south-west of the cluster. The zone of intense emission is part of a semi-circular arc of 150 pc diameter, with its centre ∼40 pc to the east of SSC-A. Because of this off-centring, the distance of ionizing source to different parts of the emitting arc is different, causing the surface brightness of the emission to decrease along the arc as its distance increases from SSC-A. The emission is weak inside the semi-circular arc (see Sec-tion 3). The observed morphology resembles the structure of a classical wind-driven bubble. If this is the case, the hot shocked gas that fills the bubble should be a source of the X-ray emission (Weaver et al. 1977;Chu & Mac Low 1990;
Silich, Tenorio-Tagle & A˜norve-Zeferino 2005). Soft X-rays are indeed detected in NGC 1569, whose morphology is dis-cussed below.