HAL Id: inserm-00170620
https://www.hal.inserm.fr/inserm-00170620
Submitted on 10 Sep 2007
HAL is a multi-disciplinary open access archive for the deposit and dissemination of sci-entific research documents, whether they are pub-lished or not. The documents may come from teaching and research institutions in France or abroad, or from public or private research centers.
L’archive ouverte pluridisciplinaire HAL, est destinée au dépôt et à la diffusion de documents scientifiques de niveau recherche, publiés ou non, émanant des établissements d’enseignement et de recherche français ou étrangers, des laboratoires publics ou privés.
Road crash involvement and professional status: A
prospective study using the French Gazel cohort.
Erik Lenguerrand, Jean-Louis Martin, Mireille Chiron, Emmanuel Lagarde,
Bernard Laumon
To cite this version:
Erik Lenguerrand, Jean-Louis Martin, Mireille Chiron, Emmanuel Lagarde, Bernard Laumon. Road crash involvement and professional status: A prospective study using the French Gazel cohort.. Acci-dent Analysis and Prevention, Elsevier, 2008, 40 (1), pp.126-136. �10.1016/j.aap.2007.04.009�. �inserm-00170620�
Road Crash Involvement and Professional Status: A
Prospective Study using the French GAZEL Cohort.
E. Lenguerrand a,b, J-L. Martin a, M. Chiron a, E. Lagarde c, B. Laumon aa Unité mixte de recherche et surveillance transport travail environnement (UMRESTTE, Bron F-69675, France);
Institut national de recherche sur les transports et leur sécurité (INRETS, Bron F-69675, France);
Université de Lyon, Lyon, F-69003, France ; université Lyon 1, faculté de médecine Grange Blanche, Lyon, F-69003, France; Institut de veille sanitaire (InVS, Saint-Maurice F-94415, France)
b Corresponding author. Present address: INRETS/UMRESTTE 25 Avenue François Mitterrand, Case 24, 69675 Bron Cedex France
Tel:+33 4 72 14 24 23 Fax:+33 4 72 14 25 20 Mail: [email protected]
c INSERM, Equipe Avenir « Santé et insécurité routière » U593, Bordeaux, F-33076 France;
Institut de Santé Publique et de Développement, Bordeaux, F-33076 France; Institut Fédératif de Recherche de Santé Publique (IFR99), Bordeaux, F-33076 France
ABSTRACT:
Objectives
To assess the influence of professional status differences on the risk of road crash
involvement-RCI- (irrespective of crash severity) and to examine the underlying mechanisms by evaluating the role of users’ exposure to road risk (ERR) in these differences.
Methods
A total of 15 237 current and retired staff selected from the French GAZEL cohort were studied. A proportional hazard model for recurrent events was used to calculate the relative risks of RCI associated with professional status. The associations between RCI and
professional status were investigated by adjusting for ERR (kilometres travelled and risk behaviour on the road).
Results
In all 1 890 crash involvement events were observed. The crude relative risks of RCI highlighted a greater risk for managers compared to unskilled workers (male: RR=1.30; female: RR=1.44). Risks for male and female managers were no longer statistically significant when adjusted for factors describing the subjects’ driver behaviour. Female
HAL author manuscript inserm-00170620, version 1
HAL author manuscript
Accident Analysis & Prevention (2007) epub ahead of print
HAL author manuscript inserm-00170620, version 1
HAL author manuscript
managers’ risks were also insignificant when adjusted for vehicle kilometres travelled. Managers seemed at lower risk of injury when involved in crash.
Conclusion
Socially advantaged subjects have the greatest RCI risk. Qualitative and quantitative ERR factors are subjacent to these disparities. These results highlight the importance to focus on ERR when studying the effect of an individual characteristic on RCI. They also highlight the importance to analyse separately the “RCI” and the “susceptibility to injury”.
Keywords: Road crash involvement; Social disparities; Exposure to Road Risk; Cohort
study
1 Introduction
1.1 CONTEXT:
Social inequalities exist with regard to the health burden of road safety: underprivileged subjects have the highest morbidity and mortality as a consequence of crash involvement (Borrell et al. 2002; Cubbin et al. 2000a).
These social disparities can be explained by a different risk level of road crash involvement (RCI) when exposed to road hazards and/or by a different level of risk of being injured when involved in a crash. Li et al. (2003) characterize the first effect as the “crash-involvement” and the second as the susceptibility to injury, or the “fragility”.
The effect of social position on road safety is generally studied on the basis of the injury/fatal crash involvement rate (Braver 2003; Cubbin et al. 2000b; Ferrando et al. 2005; Whitlock et al. 2003): sum of injured and/or deceased subjects when involved in a crash, divided by sum of inhabitants in the same social position or by sum of kilometres travelled by the people in this social category.
This rate mixes the RCI and the fragility dimensions and it is impossible to disentangle the effect of social position on each of these dimensions. Moreover, many studies on social position relate to children and their crash involvement as pedestrians: these crashes always produce injured people, making crash involvement and fragility inseparable (Hasselberg et al. 2001; Johnson et al. 2005; Laflamme and Diderichsen 2000; LaScala et al. 2000; Vaez and Laflamme 2005).
With regard to the fragility effect, the studies which analysed the differences of severity according to social position in a crash injured population are scarce. However, low social class subjects have been found to be associated with physical fragility, i.e. with health deprivation and illness (Chandola and Marmot 2005; Kennedy et al. 1998; Power 1994). Among adults who use a motorized vehicle, socially disadvantaged subjects are the most
exposed to “fragility”: they have the least protective (Choo and L. 2003), poorly maintained vehicles (Cubbin and Smith 2002) and wear seat belts less often than other groups of road users (Lerner et al. 2001).
Studies that deal with the effect of social position in RCI (irrespective of crash severity) are also rare. Socially advantaged road users were found to be over-involved in road crashes (Dobson et al. 1999; Hemenway and Solnick 1993). The mechanism underlying the association between social position and RCI is also unclear and complex (Plasencia and Borrell 2001). Professional status is generally used as a proxy for factors like the subject’s behaviour or health and, in this context, as a proxy for exposure to road risk (ERR) (Chandola and Marmot 2005; Cubbin and Smith 2002; Johnson et al. 2005; Laflamme and Diderichsen 2000). Quantitative ERR, i.e. travel times or travel distances can vary according to social position as can the nature of ERR (qualitative ERR), i.e. subject behaviour on the road, transport mode features and the environment the subject travels through. For instance, highly educated subjects are known for their higher proportion of crashes due to drowsiness (Sagberg 1999). At the same time, they accumulate high amount of driving while drowsy (McCartt et al. 1996). ERR is often invoked but not quantified to explain the social disparities in road safety, especially among children (Braveman et al. 2005; Soori and Bhopal 2002; White et al. 2000).
Before focussing on the fragility dimension, further research is required on RCI dimension. The above RCI risks need to be validated as they have been rarely studied and are reverse to those found when “crash involvement” and “fragility” are studied together. Moreover, the impact of ERR in the causal path between social disparities and RCI needs to be clarified: are the social disparities due to differences in the numbers of road hazards encountered, to
different behaviours on the road or to other unknown factors? Such investigation can help to determine the relevance of social position for road safety interventions on RCI.
However, exploration of the “road involvement” dimension is restricted by the information which is generally available. Firstly, property damage only crashes (PDO) are often absent from routinely collected data. This introduces a selection bias in favour of upper severity levels and brings into play the “fragility” effect. Secondly, the ERR data are often unavailable or unsuitable (Redondo-Calderon et al. 2001). At national level, only few data sources can provide useful information. In France, the GAZEL cohort provides individual data on PDO, injury road crashes, amounts of travel, travel behaviours and socioeconomic status. On the basis of these data on adult users of motorized transport modes, it was possible to explore the links between professional status and RCI.
1.2 OBJECTIVES:
The objectives were to assess professional status differences in the risk of road crash involvement and to examine the underlying mechanism by evaluating the role of users’ exposure to road risk.
2 MATERIALS
AND
METHODS
2.1 Studied Population
The dataset was extracted from the “GAZEL” cohort of current and retired staff from the French national electricity and gas companies, Électricité de France and Gaz de France. These firms employ approximately 150 000 people throughout France. Designed as a research tool, the GAZEL Cohort Study was intended to facilitate epidemiological research on various diseases and multiple health-related factors and is an “open and general-purpose
epidemiological laboratory” (Goldberg et al. 2006). The data has been regularly updated since 1989 with data from the human resources department, the firm’s medical insurance program, the occupational medicine department and an annual questionnaire mailed to participants at
the beginning of each year which covers the last twelve months. All the gathered information is confidential. Cohort follow-up is organized by Research Unit U687 at INSERM (National Institute of Health and Medical Research). More details on the GAZEL cohort are available in Goldberg et al (1990, 2006).
Over the years, the GAZEL cohort study has evolved to include many sub-studies, which aim to examine specific research questions. In 2001, the driving behaviour and road safety
questionnaire was sent to the GAZEL cohort members. Since 2002, questions about road crashes and ERR have been added in the annual questionnaire mailed to participants. This information is also confidential and anonymous.
At baseline 20 625 participants were included (15 011 men and 5 614 women) in GAZEL cohort. In order to study a population with high incidences for the main diseases, the GAZEL cohort selected in 1989 males aged at least 40 years old and females aged at least 35 years old. At the beginning of the current study in 2001, the females were at least 47 years old, the males were at least 52 and the oldest subjects were 63. The current study population was composed of subjects who drove a motorized vehicle with two, four or more wheels and who sent back at least one annual questionnaire between 2002 and 2004 (N=16 206). These questionnaires described the subjects’ situation between 2001 and 2003. Individuals who did not answer the RCI and/or ERR questions were removed (N=918), as were individuals for whom there was no information regarding their professional status (N=17). The final number of subjects studied was 15 271.
2.1.1 Outcome
Subjects involved in at least one PDO or injury crash during an observation year were given “crash involvement” status for that year. Thus, during the observation period, the outcome could change each year for each road user. A subject could have “crash involvement” status a maximum of three times if he had at least one crash in 2001, 2002 and 2003.
2.1.2 Main exposure
Social positions were determined on the basis of the professional status (PS) during the considered year or the last PS before retiring. The PS was determined with the
socio-occupational coding developed by INSEE (2003)-the French National Institute for Statistics and Economic Studies-. The three studied social classes were “manager”, “skilled worker” and “unskilled worker”. PS was preferred to earnings since it was regularly collected, unlike earnings which were only updated in 1989 and 2001. PS and education status were highly correlated in the cohort, which made the latter redundant.
2.1.3 Exposure to road risk (ERR) and adjustment factors
The quantitative part of ERR, which reflects the number of road hazards encountered by the subject, was measured on the basis of the annual vehicle kilometres travelled (VKT) as a driver of a motorized vehicle. This information has been gathered and annually updated in the self-administered questionnaire since 2002. It was coded respecting the quartiles of the
distributions of VKT by gender. This coding made it possible to take account of potential non-linear effects of distance travelled on RCI.
Other adjustment factors were divided into two categories: factors describing driving
behaviours and factors relating to the subject independently of his or her road related activity. For ease of presentation and because they all referred to characteristics that modify directly or indirectly the nature of ERR, these were grouped together under the generic concept of
“qualitative ERR”. However, the non-road related subject characteristics were only
considered as adjustment factors whereas other qualitative factors were analyzed in greater depth. The aim is to focus on the role of factors directly associated with road activities (VKT and direct measures of road behaviours) in the PS-RCI association. The studied driving behaviours were those available in the cohort and previously found to be associated with road safety in analyses of the GAZEL cohort or in the literature: mobile phone use
Nadeau et al. 2003), drowsiness (Nabi et al. 2006), driving under the influence of alcohol (Laumon et al. 2005), speeding in built up areas or on rural roads or motorways (Lagarde et al. 2004b), other infringements of the Highway Code (Lagarde et al. 2004b)and whether or not the subject declared himself cautious while driving. The use of a motorized two-wheeled vehicle was also studied. These behaviours were measured in 2001 by the driving behaviour and road safety questionnaire. Non-road related factors could also influence RCI. They differ from the previous factors as they exist independently of the subject’s road related activity. They were also chosen on the basis of previous road safety studies conducted on the GAZEL cohort. Only those factors which were found to be statistically associated with RCI in the current study were kept in the model. The presence or absence of life events like
hospitalization, children leaving home, major purchases, divorce, and work restructuring were investigated (Lagarde et al. 2004a). Adjustment on the basis of state of health and health problems were also studied (Lagarde et al. 2005). Subjects were classified according to whether they stated (or not) they were in poor or good general, physical and mental health. In addition, males were coded as healthy or unhealthy depending on whether they had dental, gum or cataract problems, and females were coded as healthy or unhealthy depending on whether or not they had digestive system problems, diabetes, glaucoma or urogenital disorders. The subjects’ behaviour was also taken into account on the basis of their type A behaviour pattern (TABP) profile which describes levels of impatience, hostility and time urgency (low score/intermediate score/high score on the Bortner rating scale - the higher is the score, the higher the levels) (Nabi et al. 2005). The following socio-demographic variables were also used: age, gender, family life status. All these factors were collected in the annual self-administrated questionnaire and treated as time-dependent variables, except for TABP which was only gathered in 1993.
2.2 Analysis
2.2.1 The recurrent event model
The dataset corresponded to a cohort with three follow-ups: 2001, 2002 and 2003. An unknown or not exploitable follow-up was considered as a censored observation for the corresponding period. After a censored observation or a crash period, subjects were declared at risk for another event and began a new “at risk period”.
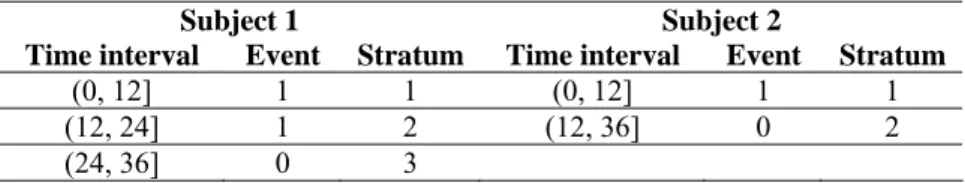
In order to take account of the follow-ups, time-dependent variables and recurrent event data, the conditional model for recurrent event data was used (Hosmer and Lemeshow 1999). It is conditional in the sense that it is not possible for a subject to start a new “at risk period” without having experienced a previous event. This is an extension of the Cox proportional hazards model (Cox 1972). In this model, the time interval of a subsequent event starts at the end of the time interval for a previous event and ends when the event occurs or when the subject is censored. A stratum variable is used to keep track of the event number. The data layouts of a first hypothetical subject involved in at least one crash during the first year and in at least one crash during the second year of our three years observation period and of a second subject involved in a crash the first year are presented in Table 1.
The proportional hazards function for the sth event with time-varying covariates x(t) is hs(t, x(t), βs)=h0s(t) exp[x(t) βs].
Parameter estimates, i.e. βs, are obtained by using the stratified partial likelihood. Like
traditional relative risks (RR), estimated hazard risks, i.e. exp(βs), are interpreted as an
increase or decrease in the risk of experiencing the studied event for a subject exposed to a risk factor compared to another subject who is not. A robust sandwich estimator of the
variance of parameters is needed to control for correlations caused by several observations for the same subject. This model was fitted with the “tphreg” process of SAS® software (SAS Institute 1999; UCLA ATS).
2.2.2 Data analysis strategy
The aim of the analysis was to identify the effect of PS on RCI and then to evaluate the specific role played by quantitative and qualitative ERR on the potential association between RCI and PS.
Firstly, a univariate analysis was fitted to calculate the crude relative risks of RCI on the basis of PS and thus identify potential social class disparities.
Secondly, in order to evaluate the extent to which ERR could explain this potential
association between PS and RCI, a bivariate model was fitted to adjust the previous risks for quantitative ERR. The aim of this multivariate model was to evaluate if a potential PS effect was modified when adjusted for VKT, i.e. if the effect was reduced in magnitude or was no longer statistically significant.
Thirdly, instead of adjusting the PS-RCI association for the quantitative ERR factors, the risks were adjusted for the qualitative ERR factors. The socio-demographic, life event and health factors were not described in detail but were controlled for in order to focus on the intrinsic role of road behaviours in the PS-RCI association. Only factors that were found to be associated with RCI in univariate models were introduced into this multivariate model. In addition, those that were found to be statistically insignificant during the stepwise process were removed.
Finally, the PS-RCI risk was adjusted for both VKT and qualitative factors. Qualitative ERR factors which were no longer statistically significant were not retained in this final model. In this model, interactions between PS and ERR factors were tested.
All the analyses were done separately by gender. The variables were selected using the Wald test or the likelihood test ratio with the 5% level of significance.
In order to consider “fragility”, involvement in an injury crash (in which the subject and/or another road user were injured) was identified. A logistic model was used in the sub-sample
of subjects involved in crash to calculate the risk of involvement in an injury crash associated with PS.
3 RESULTS
3.1 Dataset description
3.1.1 Study population characteristics
The study population consisted of 15 271 subjects of whom 11 612 were males. 31 635 person-years related to males and 9 159 to females. For males, managers, skilled workers and unskilled workers represented respectively 41%, 50 % and 9% of the person-years; for females, respectively 17%, 67% and 16% of the person-years.
3.1.2 Crash characteristics
In 2001-2003, 1 326 males and 352 females had the “crash involvement” status: 1 476 road users had this status once, 192 twice and 10 three times. Of these 1 678 subjects, 1 212 had only PDO crashes, 138 had only injury crashes, 256 had both injury and PDO crashes and 72 had crashes of unknown severity.
Finally, 1 890 “crash involvement” events were studied of which 71% referred to subjects who were exclusively involved in PDO crashes. Among the 1 507 events registered for males, 46% referred to a manager, 46% a skilled worker and 8% an unskilled worker. For females, these PS groups represented respectively 22%, 64% and 14% of their 383 events.
3.1.3 Professional Status (PS) and Exposure to Road Risk (ERR)
With regard to the quantitative part of ERR, males travelled much more than females. Among males, managers travelled more than individuals with other professional statuses: in 2001, 52% of them travelled more than 20 000 kilometres compared with 36% of unskilled workers (Table 2). Among females, 51% of the managers travelled more than 6 000 kilometres
compared with 43% of unskilled workers
With regard to the self-declared qualitative part of ERR, differences were also found between the professional statuses. Among males, more managers used mobile phones while driving compared to unskilled workers (Table 2). They were also more likely to exceed the speed limits, to drive when drowsy or under the influence of alcohol than other PS groups. A greater number of managers also reported driving carelessly and breaking the Highway Code. Among females, more unskilled workers used two-wheeled motorized vehicles than the other PS groups (Table 2). They reported breaking the Highway Code as much as managers, and both of these more than skilled workers. However, female managers were more to use mobile phones while travelling, to exceed the speed limits on all types of road, to drive when drowsy and to report driving carelessly, compared to other PS groups.
The crash involvement described in section 3.1.2 could be explained by these differences in qualitative and quantitative ERR between different PS groups: manager status appeared to be associated with risky driving behaviour and to encounter numerous opportunities for crash involvement.
3.2 Road Crash Involvement (RCI) and Professional Status (PS)
3.2.1 Crude RCI risks
As suggested in the descriptive analysis, PS was statistically associated with RCI (Table 3). Managers were more involved in crashes than unskilled workers: RR=1.30 [1.06-1.59] for males and RR=1.44 [1.03-2.03] for females. There was no statistical difference between the RCI of skilled and unskilled workers.
3.2.2 RCI risks adjusted for quantitative ERR
The above risks were then adjusted for annual VKT. Among males, despite the adjustment for VKT, managers remained statistically over-involved in crashes compared to unskilled
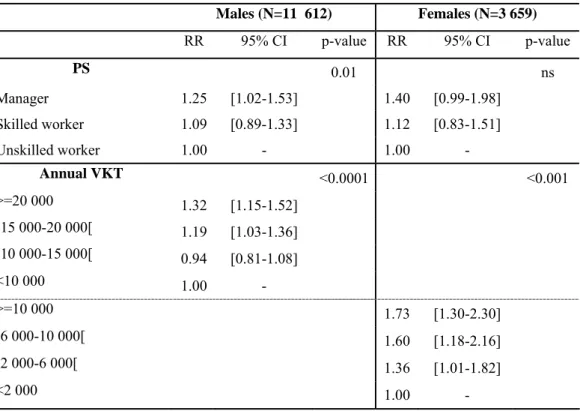
workers but the risk decreased slightly: RR=1.25 (Table 4). Males driving more than 15 000 kilometres per year were at greater RCI risk than males driving less than 10 000 kilometres. In contrast, among females, even if the crude risk was higher than for males, the increase in RCI associated with managers was no longer statistically significant when adjusted for VKT (Table 4). As regards to quantitative ERR, the higher was the annual VKT, the higher the risk of RCI.
3.2.3 RCI risks adjusted for qualitative ERR
The risks shown in section 3.2.1 were then adjusted for road behaviours and factors unrelated to road travel (i.e. socio-demographic, life event and health factors). For both genders, the PS-RCI association was no longer statistically significant (Table 5).
Among men, speeding in built-up areas or on motorways, using a mobile phone, driving while drowsy, or riding a two-wheeled motorized vehicle were all associated with RCI (Table 5). Whereas males who drive under the influence of alcohol were found at higher crude RCI risk (RR=1.12 CI95%: [1.05-1. 31]), the association was no longer significant when adjusted.
Among females, mobile phone use, driving under the influence of alcohol and careless driving also generated an increase in road crashes (Table 5).
3.2.4 RCI risks adjusted for quantitative and qualitative ERR
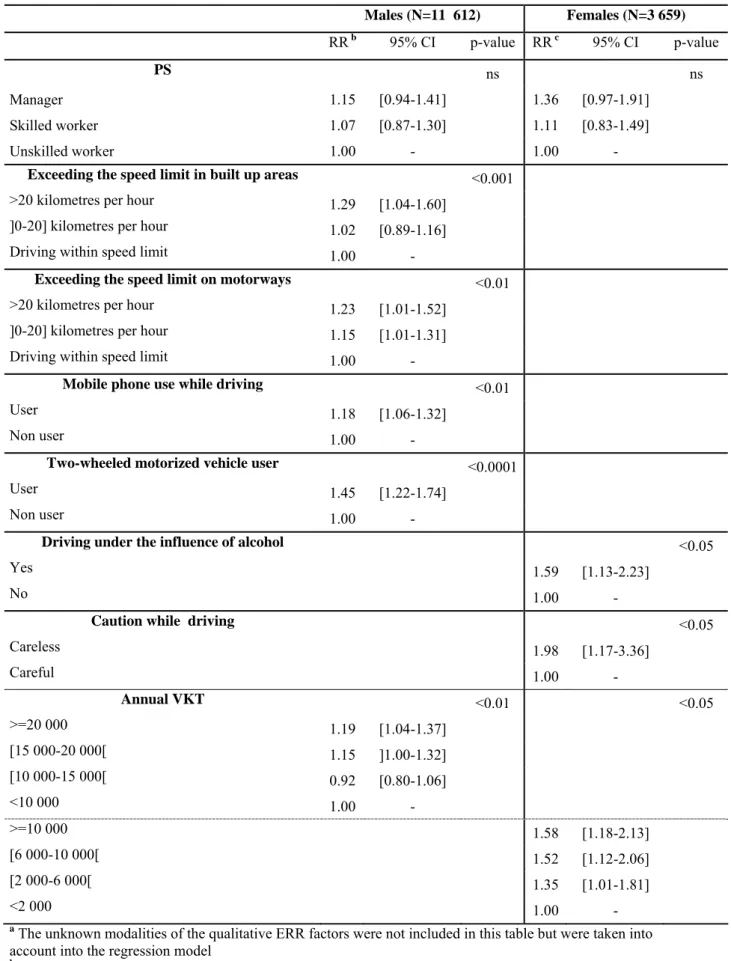
When both quantitative and qualitative ERR factors were taken into account, the PS-RCI association remained statistically insignificant (Table 6). Among males, the excess crash involvement for subjects who drove while drowsy was no longer statistically significant when annual VKT was taken into account (Table 6). Among females, only mobile phone use while travelling failed to achieve statistical significance (Table 6).
All the other behaviours described in Section 3.2.3 remained associated with RCI. No interaction between PS and ERR factors was found.
3.2.5 Considering “fragility”
Of the 1 326 crash-involved males, 23% were involved in an injury crash; 22% of 348 crash involved females were in injury crashes.
Among crash-involved males, PS appeared to be associated with a risk of injury crash involvement (P-value<0.05). Managers were at lower risk of injury crash involvement (RR=0.51 CI95%:[0.32-0.82]) than unskilled workers. No difference was found between
skilled and unskilled workers (RR=0.63 CI95%: [0.40-1.00]).
For female managers, the trend was the same as for males (RR=0.43 CI95%: [0.18-1.03]) but
not statistically significant.
4 DISCUSSION
Our analysis focused on crash involvement (irrespective of crash severity) and reveals social disparities: between 2001 and 2003 for both genders, managers were more frequently
involved in road crashes than unskilled workers. No difference was found between skilled and unskilled workers.
This upper social group’s over-involvement in road crashes concurs with previous research which studied RCI: highly educated middle-aged women (Dobson et al. 1999) and high-income motorists aged 18-65 years (Hemenway and Solnick 1993) were found over-involved in road crashes.
ERR plays an important role in what could at first glance be attributed to the
over-involvement of the upper social class in crashes. Among males, the differences between social groups seem to be explained by the subjects’ risky road behaviours: exceeding speed limits, mobile phone use or driving while drowsy. Males’ VKT, i.e. the opportunities for crash involvement they encounter, seems to play a minor role in these differences. Among females, VKT and road behaviours, i.e. mobile phone use, alcohol use or careless driving seem to explain the PS-RCI association. Thus the highest crude risk of RCI found for managers is explained by a greater number of subjects with high levels of travel or with risky road behaviour compared to other social groups as shown in descriptive section. However, the absence of interaction between ERR and social position indicates that the RCI risk is higher for those with these ERR profiles irrespective of their social position.
These results are in agreement with the general framework developed by Diderichsen et al., and presented by Laflamme (2000), which conceptualizes the link between social position and safety problems. PS is assumed to be a proxy of the effects on road safety of “exposure” (our quantitative ERR) and “susceptibility” (our qualitative ERR). Both effects were identified in
the current analysis. Quantitative ERR seems to explain PS differences among females but seems to play a minor role among males. Behaviour on the road, i.e. qualitative ERR, seems to play an important intermediate role in the association between PS and RCI for males and females. Finally, when risks were adjusted on quantitative and qualitative ERR (health conditions, life events and socio-demographic characteristics) no other unmeasured factor seemed to be required to explain the relation between PS and RCI.
In contrast, when our analysis focused on crash severity, an excess risk for underprivileged subjects was observed especially among males. Whereas our available data is not completely adequate for a thorough investigation of the effect of social position on susceptibility to injury in crash (in some of these crashes it could be possible that the injury casualty is not the
studied subject), these results support the hypothesis that low social position subjects have a greater fragility in road crashes which can be partly explained by health deprivation or illness (Chandola et al. 2003; Hippisley-Cox et al. 2002; Kennedy et al. 1998; Power 1994; Roberts 1997; Walsh and Jarvis 1992). It could also be explained by the fact that the lowest social status subjects do not have the safest vehicles (Choo and L. 2003), that they have the least maintained vehicles (Cubbin and Smith 2002; MacDonald and Romberg 1978) and that they wear seat belts less often than other groups of road users (Kweon and Kockelman 2003; Lerner et al. 2001; Shinar et al. 2001).
While only the three follow-ups which covered the period 2001-2003 were usable as ERR and road safety data were only collected during this period, the GAZEL cohort data was
appropriate for studying road safety disparities according to social class: data on PS, PDO and injury crashes have been updated annually, as has the data on the subjects’ ERR. Individual qualitative ERR data was also collected. In addition, it was possible to consider a large number of regularly updated confounding factors: socio-demographic, life event and health status factors.
With regard to information about ERR, the available data did not take into account the
information on the environment the subjects travel through. Their confounding effect can thus not be controlled. Moreover, subjects were to answer on a frequency scale (never, rarely, often) to questions related to “driving while drowsy”, “ two-wheeled motorized vehicle user” or “mobile phone used while driving”. A dichotomous coding (User/Non user or Yes/No) was however used in models since the majority of subjects had answered “rarely” or “never”. This simplification led to information loss but it did not introduce confusion in results since the magnitude and statistical significance of risks associated with PS or ERR remained similar whatever the coding chosen. Our ERR data was not perfect but information on the qualitative ERR was available and VKT was also updated annually which is scarce. To the best of our knowledge, the GAZEL cohort is the only large-scale database in France that contains this type of updated individual data on PS group, RCI and ERR for adults.
With regard to data analysis, the chosen statistical model was able to take account of the recurrence of RCI and time-dependant factors. It therefore avoided focusing on one particular crash. However, as the age of inclusion differed for the two genders the analysis was
separated by sex. This design induced a lower but satisfactory statistical power compared to the power obtained in a global analysis. This separation was justified on the basis of VKT, qualitative ERR and crash disparities found between genders in the descriptive section and in the literature (Martin et al. 2004).
In spite of the strength of the data and the modelling, there is a weakness in the interpretation of the results. The magnitude of the crude/adjusted RCI risks associated with PS was small and the adjusted risks were very close to the crude risks: among males, the crude RCI relative risk for managers was 1.30 and in the final model adjusted for quantitative and qualitative ERR factors the risk was 1.15; the equivalent figures for females were 1.44 and 1.36. The effect of ERR factors on the risk associated with PS seemed small and related essentially to
the statistical significance. While it might be suspected that a purely “mechanical” adjustment effect is at work, i.e. an effect simply due to the inclusion of additional factors in the
multivariate model, the role of ERR cannot be dismissed: ERR is often invoked to explain social inequalities in fatal/severe crash rates and as shown above, is used in the theoretical explanation of links between social position and road safety (Braveman et al. 2005; Laflamme and Diderichsen 2000; Soori and Bhopal 2002; White et al. 2000). Moreover it is an essential factor of RCI (Lefrancois and D'Amours 1997). The model used seems also reliable when looking at the other factors. It provides statistical significant RCI risks associated with mobile phone, driving while drowsy, riding a two-wheeled vehicle and VKT in accordance with known results (Aarts and van Schagen 2006; Laberge-Nadeau et al. 2003; Stutts et al. 2003). Great care is required before widening these results. In order to use the GAZEL longitudinal follow-up, the sub-study on road safety shares its design features. Thus certain professional statuses (farmers, the self-employed and company directors) and professional drivers are not present in the companies from which GAZEL members were recruited. The current results cannot therefore be generalized to subjects in these positions. Moreover, the low magnitude of the highlighted RCI risks found among the GAZEL cohort could be higher in the general French population. First, at baseline only advanced middle-aged subjects were selected in the GAZEL cohort. In 2003, males were 49-64 years old and females were 54-64 years old. Thus the calculated risks relate to road users among those with the lowest RCI risks (TRB 2005). Second, the subjects are drawn from the same companies. They thus have close lifestyles and current and retired staff has a similar access to the health system: the disparities between different social positions are thus lower than in the general French population. Finally,
irrespective of social position, disorders caused by alcohol, smoking, or other dangerous types of behaviour, especially among males affect the participation to the annual GAZEL
questionnaire (Goldberg et al. 2001). Such bias towards those with better health or less
dangerous behaviour could lead to select subjects with safer road behaviour. This could also explain the statistically insignificant RCI risk associated with males who drive under the influence of alcohol.
Despite this conservative context, some risks were found statistically significant. This leads one to suspect that higher risks could be found in other contexts.
4.1 Conclusion
This study uses a longitudinal database with detailed and annually updated information and a model for recurrent events. The results confirm those found in the few previous studies which investigated the relation between the social position and the risk of crash involvement.
Socially advantaged road users have the greatest crash risk (irrespective of crash severity). When focussing on the “susceptibility to injury in crash”, the risk associated with socially advantaged subjects seems the lowest. Such findings suppose that great care is required in risk interpretation each time the role of an individual characteristic is studied with data that
entangles “crash involvement” and “crash severity”.
Finally, the ERR seems to be an intermediate factor in the relation between social position and road crash involvement. For reducing RCI, the road safety measures aimed at road users with high levels of travel or with specific road behaviours would be more effective than using social position as a prevention target. The knowledge of social position remains helpful, so that the formulation of the road safety message can be adapted to these subjects. This study highlights also the great importance of taking account of exposure to road risk when studying the relation between an individual characteristic and the risk of “crash involvement”.
Acknowledgements
The GAZEL cohort is funded by Electricité de France–Gaz de France and the road safety questionnaire was funded by Renault, and the Fondation MAIF.
We are grateful to, Sébastien Bonenfant, Marcel Goldberg and Marie Zins, respectively the the data manager and the cohort managers of the GAZEL cohort who provided the data. They belong to the INSERM Research Unit 687 which hosts and manages the cohort. We would also like to thank Professor Silla Consoli and Mrs Lindsay Cant.
5 REFERENCES
Aarts, L. and van Schagen, I., 2006. Driving speed and the risk of road crashes: A review. Accident Analysis & Prevention38 (2), 215-224.
Borrell, C., Rodriguez, M., Ferrando, J., Brugal, M. T., Pasarin, M. I., Martinez, V. and Plasencia, A., 2002. Role of individual and contextual effects in injury mortality: new evidence from small area analysis. Inj Prev8 (4), 297-302.
Braveman, P. A., Cubbin, C., Egerter, S., Chideya, S., Marchi, K. S., Metzler, M. and Posner, S., 2005. Socioeconomic status in health research: one size does not fit all. Jama294 (22), 2879-2888.
Braver, E. R., 2003. Race, Hispanic origin, and socioeconomic status in relation to motor vehicle occupant death rates and risk factors among adults. Accident Analysis & Prevention35 (3), 295-309.
Chandola, T., Bartley, M., Wiggins, R. and Schofield, P., 2003. Social inequalities in health by individual and household measures of social position in a cohort of healthy people. J Epidemiol Community Health57 (1), 56-62.
Chandola, T. and Marmot, M., 2005. Social Epidemiology. In "Handbook of epidemiology". eds. W. Ahrens and I.
Pigeot, Berlin Heidelberg New York: Springer, pp 894-911.
Choo, S. and L., M. P., 2003. What type of Vehicle do people drive?The role of attitude and lifestyle in influencing vehicle type choice. In: TRB, Washington, D. C.,
Cox, D. R., 1972. Regression Models and Life-Tables. Journal of the Royal Statistical Society-Series B.34 (2), 187-220.
Cubbin, C., LeClere, F. B. and Smith, G. S., 2000a. Socioeconomic status and injury mortality: individual and neighbourhood determinants. J Epidemiol Community Health54 (7), 517-524.
Cubbin, C., LeClere, F. B. and Smith, G. S., 2000b. Socioeconomic status and the occurrence of fatal and nonfatal injury in the United States. Am J Public Health90 (1), 70-77.
Cubbin, C. and Smith, G. S., 2002. Socioeconomic inequalities in injury: critical issues in design and analysis. Annu Rev Public Health23, 349-375.
Dobson, A., Brown, W., Ball, J., Powers, J. and McFadden, M., 1999. Women drivers’ behaviour, socio-demographic characteristics and accidents Accident Analysis & Prevention31 (5), 525-535.
Ferrando, J., Rodriguez-Sanz, M., Borrell, C., Martinez, V. and Plasencia, A., 2005. Individual and contextual effects in injury morbidity in Barcelona (Spain). Accident Analysis & Prevention37 (1), 85-92.
Goldberg, M., Chastang, J. F., Leclerc, A., Zins, M., Bonenfant, S., Bugel, I., Kaniewski, N., Schmaus, A., Niedhammer, I., Piciotti, M., Chevalier, A., Godard, C. and Imbernon, E., 2001. Socioeconomic, demographic, occupational, and health factors associated with participation in a long-term epidemiologic survey: a prospective study of the French GAZEL cohort and its target population. Am J Epidemiol154 (4), 373-384.
Goldberg, M., Leclerc, A., Bonenfant, S., Chastang, J. F., Schmaus, A., Kaniewski, N. and Zins, M., 2006. Cohort profile: the GAZEL Cohort Study. Int J Epidemiol
Goldberg, M., Leclerc, A. and Chastang, J. F., 1990. Mise en place d'une cohorte épidémiologique à Electricité de France–Gaz de France. Recrutement des volontaires: principales caractéristiques de l'échantillon [The GAZEL (EDF-GDF) epidemiological cohort: volunteer recruitment and sample characteristics. In French]. Rev Epidemiol Sante Publique38, 265–268.
Hasselberg, M., Laflamme, L. and Ringback Weitoft, G., 2001. Socioeconomic differences in road traffic injuries during childhood and youth: A closer look at different kinds of road user. Journal of Epidemiology and
Community Health55 (12), 858-862.
Hemenway, D. and Solnick, S. J., 1993. Fuzzy dice, dream cars, and indecent gestures: correlates of driver behavior?Accident Analysis & Prevention25 (2), 161-170.
Hippisley-Cox, J., Groom, L., Kendrick, D., Coupland, C., Webber, E. and Savelyich, B., 2002. Cross sectional survey of socioeconomic variations in severity and mechanism of childhood injuries in Trent 1992-7. Bmj324 (7346), 1132.
Hosmer, D. W. and Lemeshow, S., 1999. Chapter 9: Other models and Topics- Recurrent event models. In "Applied Survival Analysis: Regression Modeling of Time to Event Data". Wiley, pp 308-317.
INSEE, http://www.insee.fr/Fr/nom_def_met/nomenclatures/PCS/pages/pcs.htm, Nomenclatures Definitions-Methodes, 2003.
Johnson, E., Geyer, J. A. and Rai, N., 2005. Low Income Childhood Pedestrian Injury: Understanding the Disparate Risk. In: TRB, Washington, D.C.,
Kennedy, B. P., Kawachi, I., Glass, R. and Prothrow-Stith, D., 1998. Income distribution, socioeconomic status, and self rated health in the United States: multilevel analysis. Bmj317 (7163), 917-921.
Kweon, Y. J. and Kockelman, K. M., 2003. Driver Attitudes and Choices: Seatbelt Use, Speed Limits, Alcohol Consumption, and Crash Histories. In: TRB, Washington, D.C,
Laberge-Nadeau, C., Maag, U., Bellavance, F., Lapierre, S. D., Desjardins, D., Messier, S. and Abdelnasser, S., 2003. Wireless telephones and the risk of road crashes. Accident Analysis & Prevention35 (5), 649-660. Laflamme, L. and Diderichsen, F., 2000. Social differences in traffic injury risks in childhood and youth--a literature review and a research agenda. Inj Prev6 (4), 293-298.
Lagarde, E., Chastang, J.-F., Lafont, S., Coeuret-Pellicer, M. and Chiron, M., 2005. Pain and pain treatment were associated with traffic accident involvement in a cohort of middle-aged workers. Journal of Clinical
Epidemiology58 (5), 524-531.
Lagarde, E., Chastang, J. F., Gueguen, A., Coeuret-Pellicer, M., Chiron, M. and Lafont, S., 2004a. Emotional Stress and Traffic Accidents: The Impact of Separation and Divorce. Epidemiology15 (6), 762-766.
Lagarde, E., Chiron, M. and Lafont, S., 2004b. Traffic ticket fixing and driving behaviours in a large French working population. J Epidemiol Community Health58 (7), 562-568.
LaScala, E. A., Gerber, D. and Gruenewald, P. J., 2000. Demographic and environmental correlates of pedestrian injury collisions: a spatial analysis. Accident Analysis & Prevention32 (5), 651-658.
Laumon, B., Gadegbeku, B., Martin, J. L. and Biecheler, M. B., 2005. Cannabis intoxication and fatal road crashes in France: population based case-control study. Bmj331 (7529), 1371.
Lefrancois, R. and D'Amours, M., 1997. Exposure and risk factors among elderly drivers: A case-control study. Accident Analysis & Prevention29 (3), 267-275.
Lerner, E. B., Jehle, D. V. K., Billittier, I. V. A. J., Moscati, R. M., Connery, C. M. and Stiller, G., 2001. The influence of demographic factors on seatbelt use by adults injured in motor vehicle crashes. Accident Analysis & Prevention33 (5), 659-662.
Li, G., Braver, E. R. and Chen, L.-H., 2003. Fragility versus excessive crash involvement as determinants of high death rates per vehicle-mile of travel among older drivers. Accident Analysis & Prevention35 (2), 227-235. MacDonald, S. T. and Romberg, R. A., 1978. Driver/Vehicle Characteristics Related to Accident Vehicle Condition and Causation and an Assessment of Indiana PMVI Effectiveness. In: Association for the Advancement of Automotive Medicine (AAAM) Annual conference, Michigan,
Martin, J. L., Lafont, S., Chiron, M., Gadegbeku, B. and Laumon, B., 2004. Differences between males and females in traffic accident risk in France. Revue d'Epidémiologie et de Santé Publique 52 (4), 357-367.
McCartt, A. T., Ribner, S. A., Pack, A. I. and Hammer, M. C., 1996. The scope and nature of the drowsy driving problem in New York State. Accid Anal Prev28 (4), 511-517.
Nabi, H., Consoli, S. M., Chastang, J.-F., Chiron, M., Lafont, S. and Lagarde, E., 2005. Type A Behavior Pattern, Risky Driving Behaviors, and Serious Road Traffic Accidents: A Prospective Study of the GAZEL Cohort. Am. J. Epidemiol.161 (9), 864-870.
Nabi, H., Guéguen, A., Chiron, M., Lafont, S., Zins, M. and Lagarde, E., 2006. Sleepy driving awareness and traffic accidents: Results from a prospective study in the GAZEL cohort. BMJ333, 75.
Plasencia, A. and Borrell, C., 2001. Reducing socioeconomic inequalities in road traffic injuries: time for a policy agenda. J Epidemiol Community Health55 (12), 853-854.
Power, C., 1994. Health and social inequality in Europe. BMJ308 (6937), 1153-1156.
Redondo-Calderon, J. L., Luna-del-Castillo, J. d. D., Jimenez-Moleon, J. J., Garcia-Martin, M., Lardelli-Claret, P. and Galvez-Vargas, R., 2001. Application of the Induced Exposure Method to Compare Risks of Traffic Crashes among Different Types of Drivers under Different Environmental Conditions. Am. J. Epidemiol.153 (9), 882-891.
Roberts, I., 1997. Cause specific social class mortality differentials for child injury and poisoning in England and Wales. J Epidemiol Community Health51 (3), 334-335.
Sagberg, F., 1999. Road accidents caused by drivers falling asleep. Accid Anal Prev31 (6), 639-649.
SAS Institute, http://www.sph.umich.edu//computing/manuals/sas8/stat/chap49/sect37.htm, Time-Dependent Repeated Measurements 1999.
Shinar, D., Schechtman, E. and Compton, R., 2001. Self-reports of safe driving behaviors in relationship to sex, age, education and income in the US adult driving population. Accident Analysis & Prevention33 (1), 111-116. Soori, H. and Bhopal, R. S., 2002. Parental permission for children's independent outdoor activities. Implications for injury prevention. Eur J Public Health12 (2), 104-109.
Stutts, J. C., Wilkins, J. W., Scott Osberg, J. and Vaughn, B. V., 2003. Driver risk factors for sleep-related crashes. Accident Analysis & Prevention35 (3), 321-331.
TRB, 2005. Safe Mobility for Older Americans. In: Transportation in an Aging Society: A Decade of Experience (2004), Bethesda Maryland, United States,
UCLA ATS, http://www.ats.ucla.edu/stat/sas/faq/survival_repeated_events.htm, How can I model repeated events survival analysis in proc phreg?
Vaez, M. and Laflamme, L., 2005. Impaired driving and motor vehicle crashes among Swedish youth: An investigation into drivers' sociodemographic characteristics. Accident Analysis & Prevention37 (4), 605-611. Walsh, S. S. and Jarvis, S. N., 1992. Measuring the frequency of "severe" accidental injury in childhood. J Epidemiol Community Health46 (1), 26-32.
White, D., Raeside, R. and Barker, D. (2000), "Road accidents and children living in disadvantaged areas: A litterature review," The Scottish Executive Central Research Unit
Whitlock, G., Norton, R., Clark, T., Pledger, M., Jackson, R. and MacMahon, S., 2003. Motor vehicle driver injury and socioeconomic status: a cohort study with prospective and retrospective driver injuries. J Epidemiol Community Health57 (7), 512-516.
Table 1: Data layout under the conditional model for recurrent event
Subject 1 Subject 2
Time interval Event Stratum Time interval Event Stratum
(0, 12] 1 1 (0, 12] 1 1
(12, 24] 1 2 (12, 36] 0 2
(24, 36] 0 3
Table 2: Distribution (percentage) of subjects by PS and quantityor natureof exposure to road risk a
a Calculated on the first available subject’ profile between 2001 and 2003
Males (N=11 612) Females (N=3 659)
Manager Worker Skilled Unskilled Worker Manager Worker Skilled Unskilled Worker
Annual VKT p<0.0001b >=20 000 28.8 20.8 17.9 [15 000-20 000[ 23.1 20.7 17.9 [10 000-15 000[ 26.5 27.8 23.9 <10 000 22.1 30.7 39.2 Annual VKT p<0.05 >=10 000 28.1 23.4 24.0 [6 000-10 000[ 23.3 22.0 19.3 [2 000-6 000[ 25.0 25.6 27.4 <2 000 23.5 29.0 29.3
Two-wheeled motorized vehicle user p=ns p<0.05
User 5.5 5.4 5.8 0.9 2.1 3.1
Mobile phone use while driving p<0.0001 Missing=1371 p<0.0001 Missing=584
User 33.6 24.0 18.0 30.7 16.3 17.7
Exceeding the speed limit on rural roads p<0.0001 Missing=1365 p<0.01 Missing=592
>20 kilometres per hour 11.5 8.4 7.0 8.8 6.7 7.1
]0-20] kilometres per hour 65.7 62.3 51.9 50.9 45.7 41.4
Exceeding the speed limit in built up areas p<0.0001 Missing=1374 p<0.0001 Missing=618
>20 kilometres per hour 7.6 4.1 2.8 5.8 2.7 3.5
]0-20] kilometres per hour 64.3 59.1 50.6 49.6 45.3 38.5
Exceeding the speed limit on motorways p<0.0001 Missing=1361 p<0.0001 Missing=615
>20 kilometres per hour 8.7 5.2 3.1 5.5 3.0 2.6
]0-20] kilometres per hour 60.1 50.9 38.0 48.7 32.4 23.4
Driving while drowsy p<0.0001 Missing=1372 p<0.0001 Missing=592
Yes 42.8 31.5 24.1 33.5 22.0 18.8
Driving under the influence of alcohol p<0.0001 Missing=1381 p=ns Missing=588
Yes 25.1 24.0 22.3 6.7 5.6 4.8
Caution while driving p<0.0001 Missing=1362 p<0.05 Missing=585
Careless 3.0 2.0 2.5 2.6 1.3 1.9
Highway code infringement c p<0.0001 Missing=1368 p<0.05 Missing=590
Yes 50.9 49.9 47.0 43.6 39.3 43.2
b Chi-square test c Other than speeding
Table 3: Crude relative risks of road crash involvement between 2001-2003 among GAZEL members Males (N=11 612) Females (N=3 659) RR 95% CI p-value RR 95% CI p-value PS <0.01 <0.05 Manager 1.30 [1.06-1.59] 1.44 [1.03-2.03] Skilled worker 1.10 [0.90-1.35] 1.11 [0.82 -1.49] Unskilled worker 1.00 - 1.00 -
Table 4: Relative risks of road crash involvement adjusted for quantitative factors of ERR between 2001-2003 among GAZEL members
Males (N=11 612) Females (N=3 659) RR 95% CI p-value RR 95% CI p-value PS 0.01 ns Manager 1.25 [1.02-1.53] 1.40 [0.99-1.98] Skilled worker 1.09 [0.89-1.33] 1.12 [0.83-1.51] Unskilled worker 1.00 - 1.00 - Annual VKT <0.0001 <0.001 >=20 000 1.32 [1.15-1.52] [15 000-20 000[ 1.19 [1.03-1.36] [10 000-15 000[ 0.94 [0.81-1.08] <10 000 1.00 - >=10 000 1.73 [1.30-2.30] [6 000-10 000[ 1.60 [1.18-2.16] [2 000-6 000[ 1.36 [1.01-1.82] <2 000 1.00 -
Table 5: Relative risks of road crash involvement adjusted for qualitative factors of ERR between 2001-2003 among GAZEL members a
a The unknown modalities of the qualitative ERR factors were not included in this table but were taken into account in the regression model
Males (N=11 612) Females (N=3 659) RR b 95% CI p-value RR c 95% CI p-value PS ns ns Manager 1.15 [0.94-1.41] 1.33 [0.95-1.87] Skilled worker 1.07 [0.87-1.31] 1.11 [0.83-1.49] Unskilled worker 1.00 - 1.00 -
Exceeding the speed limit in built up areas <0.01
>20 kilometres per hour 1.26 [1.02-1.57] ]0-20] kilometres per hour 1.01 [0.88-1.15]
Driving within speed limit 1.00 -
Exceeding the speed limit on motorways <0.01
>20 kilometres per hour 1.26 [1.02-1.55] ]0-20] kilometres per hour 1.16 [1.02-1.32]
Driving within speed limit 1.00 -
Mobile phone used while driving <0.01 <0.05
User 1.19 [1.07-1.33] 1.27 [1.02-1.59]
Non user 1.00 - 1.00 -
Driving while drowsy <0.05
Yes 1.14 [1.03-1.27]
No 1.00 -
Two-wheeled motorized vehicle user <0.0001
User 1.50 [1.26-1.79]
Non user 1.00 -
Driving under the influence of alcohol 0.05
Yes 1.57 [1.12-2.20]
No 1.00 -
Caution while driving <0.01
Careless 1.84 [1.11-3.04]
Careful 1.00 -
b Model also adjusted for age (<55;55-57;57;59;59>), family life status (alone, living with adult(s), living with adult(s) and child(-ren), living only with child(-ren)), retirement (working, retired with a job, retired without a job), divorce (yes/no), major purchases (yes/no), hospitalization (yes/no) and self-reported physical health condition (good/bad)
c Model also adjusted on family life status (alone, living with adult(s), living with adult(s) and child(-ren), living only with child(-ren)), retirement (working, retired with a job, retired without a job), major purchases (yes/no), children leaving home (yes/no), hospitalization (yes/no), health problem (yes/no) and TABP (low score, intermediate score, high score)
Table 6: Relative risks of road crash involvement adjusted for quantitative and qualitative factors of ERR between 2001-2003 among GAZEL members a
a The unknown modalities of the qualitative ERR factors were not included in this table but were taken into account into the regression model
Males (N=11 612) Females (N=3 659) RR b 95% CI p-value RR c 95% CI p-value PS ns ns Manager 1.15 [0.94-1.41] 1.36 [0.97-1.91] Skilled worker 1.07 [0.87-1.30] 1.11 [0.83-1.49] Unskilled worker 1.00 - 1.00 -
Exceeding the speed limit in built up areas <0.001
>20 kilometres per hour 1.29 [1.04-1.60] ]0-20] kilometres per hour 1.02 [0.89-1.16]
Driving within speed limit 1.00 -
Exceeding the speed limit on motorways <0.01
>20 kilometres per hour 1.23 [1.01-1.52] ]0-20] kilometres per hour 1.15 [1.01-1.31]
Driving within speed limit 1.00 -
Mobile phone use while driving <0.01
User 1.18 [1.06-1.32]
Non user 1.00 -
Two-wheeled motorized vehicle user <0.0001
User 1.45 [1.22-1.74]
Non user 1.00 -
Driving under the influence of alcohol <0.05
Yes 1.59 [1.13-2.23]
No 1.00 -
Caution while driving <0.05
Careless 1.98 [1.17-3.36] Careful 1.00 - Annual VKT <0.01 <0.05 >=20 000 1.19 [1.04-1.37] [15 000-20 000[ 1.15 ]1.00-1.32] [10 000-15 000[ 0.92 [0.80-1.06] <10 000 1.00 - >=10 000 1.58 [1.18-2.13] [6 000-10 000[ 1.52 [1.12-2.06] [2 000-6 000[ 1.35 [1.01-1.81] <2 000 1.00 -
b Model adjusted for quantitative ERR, age, family life status, life events (retirement, divorce, major purchases, hospitalization) and physical health condition
c Model adjusted for quantitative ERR, family life status, life events (major purchases, children leaving home, hospitalization), health problem and TABP

![Table 3: Crude relative risks of road crash involvement between 2001-2003 among GAZEL members Males (N=11 612) Females (N=3 659) RR 95% CI p-value RR 95% CI p-value PS <0.01 <0.05 Manager 1.30 [1.06-1.59] 1.44 [1.03-2.03] Skil](https://thumb-eu.123doks.com/thumbv2/123doknet/14698957.564154/27.892.185.704.160.321/table-crude-relative-involvement-gazel-members-females-manager.webp)