HAL Id: hal-02357363
https://hal.archives-ouvertes.fr/hal-02357363
Submitted on 10 Nov 2019HAL is a multi-disciplinary open access archive for the deposit and dissemination of sci-entific research documents, whether they are pub-lished or not. The documents may come from teaching and research institutions in France or abroad, or from public or private research centers.
L’archive ouverte pluridisciplinaire HAL, est destinée au dépôt et à la diffusion de documents scientifiques de niveau recherche, publiés ou non, émanant des établissements d’enseignement et de recherche français ou étrangers, des laboratoires publics ou privés.
LIFE CYCLE OF FLOATING DEBRIS IN THE
CANALS OF HO CHI MINH CITY
Thuy Chung Kieu-Le, Emilie Strady, Morganne Perset
To cite this version:
Thuy Chung Kieu-Le, Emilie Strady, Morganne Perset. LIFE CYCLE OF FLOATING DEBRIS IN THE CANALS OF HO CHI MINH CITY. 2016. �hal-02357363�
N° 4 - 2016
WORKING PAPER
Urban Development Management Support Centre - PADDI
LIFE CYCLE OF FLOATING DEBRIS
IN THE CANALS OF HO CHI MINH CITY
KIEU LE Thuy Chung,
lecturer at Faculty of Geology and Petroleum Engineering,
Ho Chi Minh University of Technology (HCMUT, VNU - HCM) and Asian Center
for the Research of Water (CARE)
kltchung@hcmut.edu.vn
Emilie STRADY,
researcher at French National Research Institute for Sustainable
Development (IRD) and Institute of Geoscience and Environment (IGE, Grenoble,
France), is affected at the Asian Center for the Research of Water (CARE) from 2015
emilie.strady@ird.fr
Morgane PERSET,
project officer at PADDI (HCM City Urban Development
Management Support Centre)
Disclaimer
Analysis and conclusions of the document are formulated under the authors’ responsi-bility. They may not necessarily convey the viewpoint of PADDI (HCMC Urban Develop-ment ManageDevelop-ment Support Centre), nor that of its partner agencies.
Acknowledgement
The authors would like to thank the DONRE, Citenco, the Transportation Enterprise No. 3 & 1, the District 8 Public Service Co. Ltd, for their welcome into their enterprise and onboard, their availability for discussion and for sharing and providing us informations and data. The authors would like also to thank the organiser and the participants of the
workshop « Domestic garbage’s service management in HCMC», who allow us to get a
global overview and the ins and outs of debris management in HCMC. The authors are also very grateful to Phan Thi San Ha, head of the Asian Center for the Research of Water (CARE), for her trust on our emerging research on plastic contamination in aquatic envi-ronment.
PADDI
Founded in 2006, PADDI is an innovative decentralized cooperation project between the Auvergne-Rhône-Alpes Region (France), the Greater Lyon metropolis (France) and Ho Chi Minh City (Vietnam). Under the Ho Chi Minh City People’s Committee supervision, its goal is to assist the city’s technical departments in various fields of urban manage-ment.
Website: www.paddi.vn
Authors: Kieu Le Thuy Chung, Emilie Strady, Morgane Perset Copy editors: Fanny Quertamp
L
IFE CYCLE OF FLOATING DEBRIS
IN THE CANALS OF HO CHI MINH CITY
1. INTRODUCTION Urban context
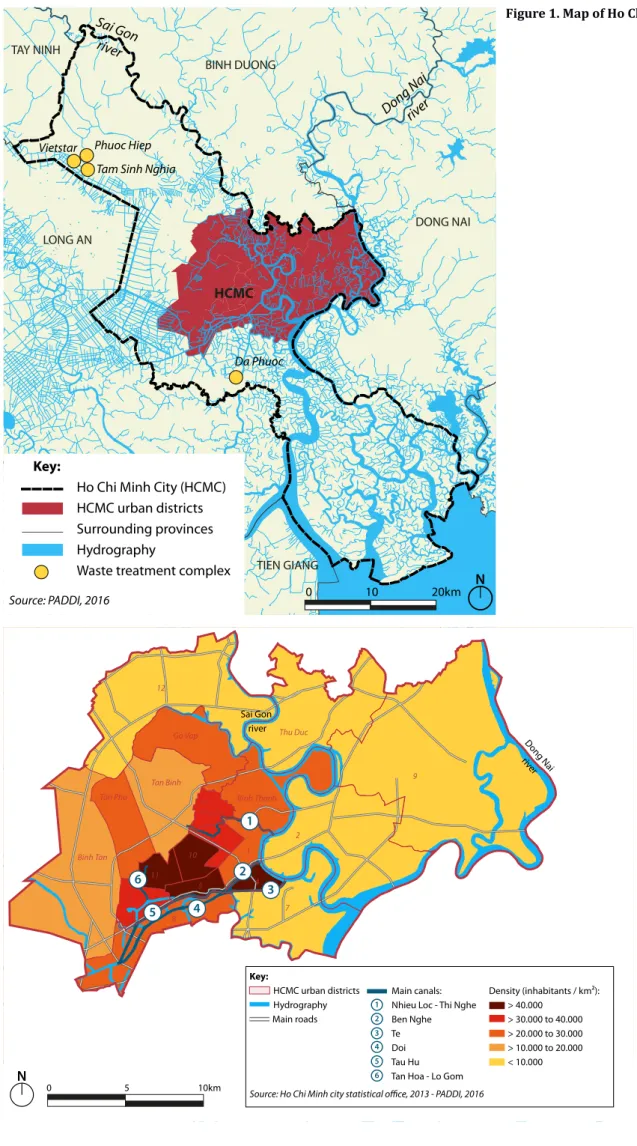
Ho Chi Minh City (HCMC hereafter), located in the Southern part of Vietnam in the transitional zone between the South East and Mekong River Delta, is the economic capital of Vietnam and the most dynamic city in terms of economy and demography (Figure 1). The official population of more than 8 million (HCMC Statistical Office, 2014) is increasing rapidly and resides in an area of 2,095 km2 (IEGS, 2007; EIXI, 2015) leading to
an average population density of 3,809 people/ km2 (2014, HCMC Statistical Office, Figure 2).
The city is webbed by many rivers, arroyos and canals with the biggest river named Saigon River. The Saigon River empties into the Nha Be River which in its turn empties into the East Sea 20 ki-lometers northeast of the Mekong Delta. Similar-ly to other typical cities built on marshy islands and coastal wetlands such as Venice, Amsterdam, St. Petersburg in Europe, and Fort Lauderdale in the U.S., the establishment and development of HCMC are interconnected with the rivers and canals network (Givental, 2014). The rivers and canals are used for water supply, flood control, and as a transport connection of the city with ocean ports in the Mekong Delta region.
HCMC is on its way of rapid industrialization and modernization, thanks to a 9.8 % GDP growth (HIDS, 2013). The industrialization process has led to a fast urban and demographic growth (3
% per year according to HCMC Statistical Office in 2013). Consequently, numerous related pro-blems have occurred, such as flooding and envi-ronmental pollution. Indeed, the rapid demogra-phic growth has a strong impact on HCMC spatial development. On average, 16 km² of its 2,095 km² territory are urbanized on a yearly basis since 2000 (DONRE, 2013). The city expands filling up waterways, wetlands and converting them into urban areas with combined effects: urban fringe development, denser central core, inundation, subsidence, soil sealing. Every year, HCMC and its surrounding provinces are welco-ming new inhabitants, companies and factories which participate in the increase of solid waste amount. For information, HCMC registered a 7 % industrial growth in 2014 (HIDS, 2014).
If HCMC is actually estimating the amount of waste collected every day to more than 7,500 tons (DONRE, 2016), it is also observed a 7 % to 8 % growth per year. Unlike other metropo-lises of its size, HCMC waste collection mainly involves informal sector which raises the urge of modernization. Therefore, local authorities are facing difficulties to establish a global state of HCMC waste collection. It represents a strong constraint in the effort of technical departments to reach an overall management of this urban service, from waste producers to treatment plants. This public and informal management of waste collection explains the weaknesses of the infrastructures, vehicles and equipments. The
Foreword
This paper is based on a research project conducted between researchers from LEESU1, IGE2 and CARE on the
esti-mation of floating plastic debris in the canals of HCMC. The presented data are from the Master Fellowship of Lisa LAHENS (UPEC3 and CARE) who conducted fieldtrips in Nhieu Loc – Thi Nghe and Tau Hu canals in spring 2016,
un-der the supervision of Bruno TASSIN and Johnny GASPERI from LEESU and Emilie STRADY from IGE and CARE. It was enriched by meetings with various stakeholders involved in waste collection (technical departments, canal waster companies, districts…) and by the participation of the authors of the PADDI’s workshop on “Domestic garbage’s service management in HCMC”. This study has been conducted under the framework of CARE-RESCIF4 initiative and
funded by incitative grants from IRD and CARE.
1 - LEESU: Labora-toire Eau Environ-nement et Systèmes Urbains. 2 - IGE: Institute of Geoscience and Environment. 3 - UPEC: Université Paris Est Créteil. 4 - RESCIF: Réseau d’Excellence des Sciences de l’Ingénieur et de la Francophonie.
Figure 1. Map of Ho Chi Minh city
Figure 2. Population density and canal system in HCMC urban districts in 2016
Vietstar
Tam Sinh Nghia
Da Phuoc Phuoc Hiep
0 10 20km N
Key:
Ho Chi Minh City (HCMC) HCMC urban districts Surrounding provinces Hydrography
Waste treatment complex Source: PADDI, 2016 HCMC BINH DUONG DONG NAI TIEN GIANG LONG AN TAY NINH Sai Gon river
Dong Nairiver
0 5 10km N Key: HCMC urban districts Hydrography Main roads
Source: Ho Chi Minh city statistical office, 2013 - PADDI, 2016 Main canals: Nhieu Loc - Thi Nghe Ben Nghe Te Doi Tau Hu Tan Hoa - Lo Gom Density (inhabitants / km²): > 40.000 > 30.000 to 40.000 > 20.000 to 30.000 > 10.000 to 20.000 < 10.000 1 2 3 6 4 5 9 2 Thu Duc 12 Go Vap Tan Binh
Tan Phu Binh Thanh
Binh Tan 1 3 Phu Nhuan 10 11 6 5 4 7 8 1 2 3 6 4 5 Sai Gon river Dong Nai river
fieldtrips and measurements conducted during our research project have also shown the remar-kable amount of garbage introduced to the wate-rway network and then transferred to the ocean. It seems that HCMC waste management is at once part of the problem and part of the solution to reduce Vietnam amount of waste discharged into the oceans, especially plastics, an emerging ubi-quitous contaminant for aquatic life.
Plastic debris environmental issues
The durability of plastics along with inappro-priate waste management has induced a remar-kable impact to the environment. Plastics, by voluntary or involuntary discarding, end up into the landscape and rivers. Once introduced into the rivers, plastic debris may sink, be deposited on river banks and/or undergo transfer to the marine environment.
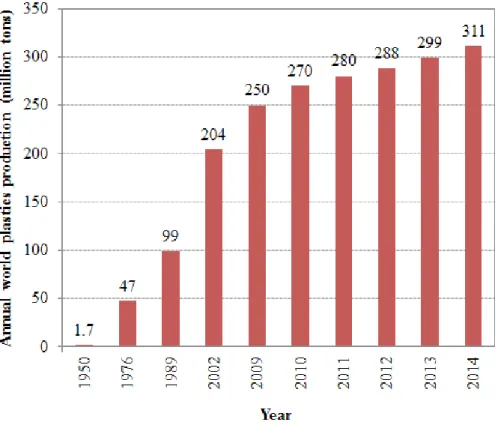
Due to their numerous properties such as resis-tance to corrosion and chemicals, light weight, good durability, low cost, ease of manufacture, plastics has become superior to other materials in many applications. The global annual produc-tion of plastics has grown tremendously from 1.7 in 1950 to 311 million tons in 2014 (Figure 3; PlasticsEurope 2015), leading to a dramatic change of the nature of solid wastes from human society (Sheavly, 2005). Furthemore, plastics are non-biodegradable materials. Under the ultra-violet light and weathering agents like current or wind, they are broken into smaller and smaller fragments over time. The plastic fragments smal-ler than 5 mm, i.e. called micro-plastics, can be ingested by the wildlife and impose many pro-blems on the biota.
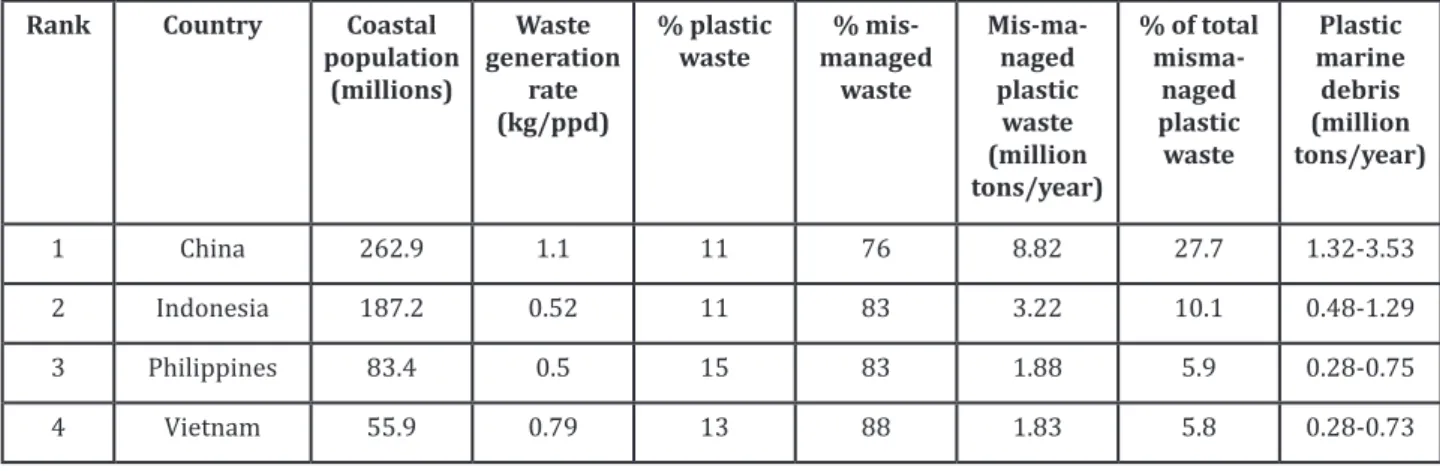
The serious impact of plastic waste to the envi-ronment has been moderately studied and in many countries, especially in Europe and North America, where utilization of plastic bags has been restricted. In Asia, plastic is an important economy, from production to recycling (LeMeur, 2016). But it is also becoming an environmental issue, especially because of its visual impact. In the ocean, it is estimated that 80% of garbage debris originate from the land-based sources (the 20% left coming from boat, cruises, etc). Ac-cording to Jambeck et al. (2015), approximately 11% (275 million tons, MT) of the waste gene-rated by the total population of the world’s 192 countries is plastic. In 2010, the authors estima-ted that 99.5 MT of plastic waste was generaestima-ted in coastal regions (e.g. regions within 50 km of a coast worldwide) and that at least 31.9 MT were mismanaged (e.g. 32%), leading to 4.8 to 12.7 MT plastic wastes entering the ocean, correspon-ding to an estimation of 1.7 to 4.6% of the total plastic waste generated by these countries. The countribution of countries to plastic waste into the ocean are unequal: it was estimated that 60% comes from the five Asian countries, i.e. China, In-donesia, the Philippines, Vietnam and Thailand. In fact, Vietnam ranks 4th in the top 20 countries
discharging a huge amount of plastic waste into the ocean, after China, Indonesia and the Philip-pines (Table 1, Jambeck et al. 2015). With the exception of China’s unavoidable first position due to its world’s most populous country and top ranked largest economy, a comparison can be made among Vietnam, Indonesia and the Philip-pines. The latter two countries have higher popu-lations and much longer coastlines than Vietnam. However, these authors evidenced that despite
Figure 3. World’s plastic production from 1950 to 2014 (Plastics Europe 2015)
the lower coastal population and coastline, the problem of mismanagement of plastic waste in Vietnam is much more severe. Therefore, if there is no urgent and comprehensive study and stra-tegy on plastics and stainable and appropriate waste management, plastic-related environmen-tal issues in Vietnam watershed will be terrible in the near future.
Objectives
This paper aims to provide a better understan-ding of the life cycle of floating debris in the ca-nals in of HCMC and its daily management. It also aims to focus on the plastic floating debris, an emerging contaminant in aquatic environment, based on scientific knowledge and data produc-tion.
This paper originated from a research project on the estimation of floating plastic debris
conduc-Table 1 Waste estimates for 2010 for the top 4 countries ranked by mass of mismanaged plastic waste (adapted from Jambeck et al 2015)
Figure 4. Non hazardous solid waste life cycle in HCMC Kieu Le Thuy Chung, 2016
Rank Country Coastal
population (millions) Waste generation rate (kg/ppd) % plastic
waste managed % mis-waste Mis-ma-naged plastic waste (million tons/year) % of total misma-naged plastic waste Plastic marine debris (million tons/year) 1 China 262.9 1.1 11 76 8.82 27.7 1.32-3.53 2 Indonesia 187.2 0.52 11 83 3.22 10.1 0.48-1.29 3 Philippines 83.4 0.5 15 83 1.88 5.9 0.28-0.75 4 Vietnam 55.9 0.79 13 88 1.83 5.8 0.28-0.73
ted in spring 2016 during the Master Fellowship of Lisa LAHENS (UPEC and CARE). This project arised the necessity of understanding the floa-ting waste management in the canals, and then the solid waste management in HCMC. Informa-tions about waste management in HCMC being scattered, the authors gathered information with the Department of Natural Resources and Envi-ronment and with transportation public compa-nies to provide a global overview of waste mana-gement in HCMC. The authors do hope that this review will help technical departments to define adapted local policies.
Thus, this paper introduces first the global over-view of garbage management in HCMC. Then, after presenting the canal’s systems, the paper displays on the specific waste management in the canals and focus on the macroplastic estimation weight in the canals and the environmental bene-fits and fallout on aquatic plastic waste cycle life.
2. SOLID WASTE MANAGEMENT IN HCMC
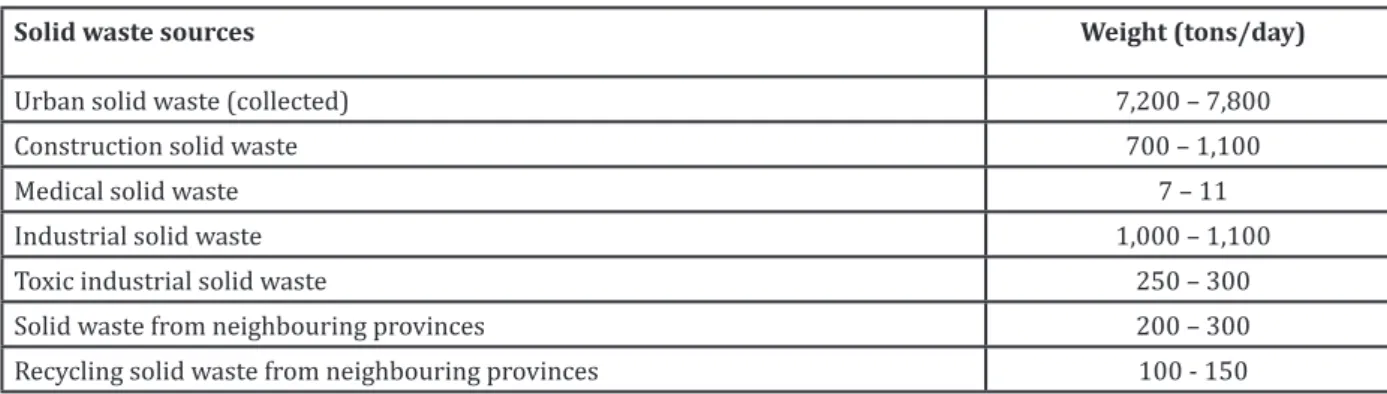
The solid waste management in HCMC is under the supervision of the Department of Natural Re-sources and Environment. The global solid waste life cycle in HCMC, from sources to the dump sites or recycling factories is sketched in Figure 4. The solid waste sources in HCMC are separated into several sectors: residential, institutional, health care, schools, hotels and restaurants, com-mercial, industrial and municipal services. The daily amount and composition of solid waste for each sector are shown in Table 2 and Table 3, res-pectively (PADDI, 2012). To notice, food waste is the major components 61 to 96.6% of total waste in HCMC. Non hazardous solid wastes are collec-ted by both public companies (40%) and private companies (60%). The public companies, inclu-ding Citenco and the 22 public service companies of the 22 districts, collect wastes at the sources such as houses locating along big roads and mercial sectors. The private companies, com-posed of individual workers, collect the wastes in
houses locating in small alleys. The geographical sector controlled by public or private companies is not set and is fluctuating according to accessi-bility, residential needs, unofficial agreement and private workers uncontrollable management. Transportation from sources to final deposit is composed of several steps such as gathering sites and transfer stations (Figure 4). Solid wastes are collected from sources and transported by vehi-cles to 1,000 gathering points composed of 5 to 10 dustbins of 240 liters or 660 liters for each. The transportation vehicles can be 2,500 gar-bage handcarts, 1,000 self-made tricycle motor-cycle wagons and 200 500-kg garbage trucks. At the gathering sites, the waste are lifted up on 2,500-kg garbage trucks and transported to the transfer stations. There are 31 transfer stations in which only 18 stations are equipped with a system of enclosed self-contained garbage com-pactor with an environmental treatment process. At the transfer stations, solid wastes are pushed into the garbage trucks and transported to the final landfills and recycling factories.
In HCMC, the collected solid waste can end up at four sites: Vietstar and Tam Sinh Nghia recy-cling factories in Cu Chi district, Da Phuoc Solid Waste Treatment Complex (referred to as Da Phuoc SWTC hereafter) in Binh Chanh district and Phuoc Hiep landfill in Cu Chi district. The capacity of these sites is: 5,000 tons/day at Da Phuoc SWTC; 1,500 tons/day at Tam Sinh Nghia and 1,500 tons/day at Vietstar Recycling Factory (DONRE, 2016). Recyclable garbage are collec-ted and sold to appropriate companies (except plastic bags which are recycled at Vietstar) whe-reas organic garbage is used for manufacturing compost. The remaining is then transported to garbage dump sites for burrying. Apart from this planed system, informal waste pickers are col-lecting daily the economic valuable waste (cans, paper, glass, plastic bottles) all along the solid waste life cycle and are selling them to private re-cycling companies. Also, beside public and infor-mal waste collecting and sorting, a decree issued in 2007 (n°59/2007/ND-CP) has established the principle of waste sorting by producers, meaning
Solid waste sources Weight (tons/day)
Urban solid waste (collected) 7,200 – 7,800
Construction solid waste 700 – 1,100
Medical solid waste 7 – 11
Industrial solid waste 1,000 – 1,100
Toxic industrial solid waste 250 – 300
Solid waste from neighbouring provinces 200 – 300
Recycling solid waste from neighbouring provinces 100 - 150 Table 2 Total weight of solid waste of HCMC (PADDI, 2012)
by households. This decree is actually non effec-tive despite public campaigns of solid waste sor-ting by inhabitants have been carried out in some districts of HCMC to emphasize the individual sorting. Feedbacks show that such local and tem-porary initiatives have limited impact.
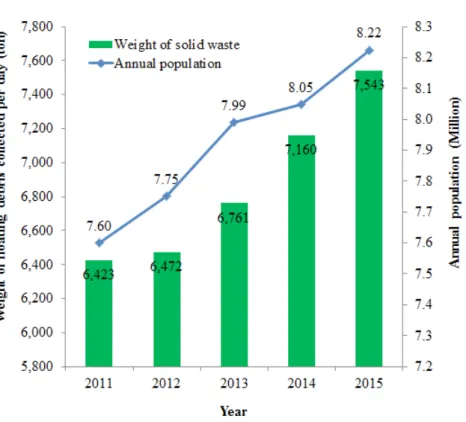
To conclude this part on the solid waste mana-gement in HCMC, we present the past evolution of the increasing collected non-hazardous mu-nicipal solid wastes along with the increasing population. The yearly 7 to 8% waste increase highlights the adaptation of the solid waste col-lection by HCMC to the increasing demography and waste production but it also points out that the management required to be constantly adap-ted and improved in terms of technology and
labor law to improve the quality of life of HCMC residents (Figure 5; DONRE, 2016).
3. CANAL SYSTEM IN HO CHI MINH CITY
Located at the downstream of Dong Nai River and Saigon River, HCMC has an extensive waterway network of 3268 rivers and canals with the total length of 5076 km (Figure 1). The flow regime of the canal and river network in HCMC depends on not only the tide of the East Sea but also the discharging flow rate of the upstream reservoirs such as Tri An and Dau Tieng.
The rivers and canals system play an important
Categories Solid waste composition
Households Transfer stations
Organic food 61.0 – 96.6 72.0 – 94.0 Plastics 0 – 10.0 0.5 – 5.8 Textile 0 – 14.2 0 – 13.0 Wood 0 – 7.2 0 – 5.8 Paper 0 – 14.2 0 – 5.5 Glass 0 – 4.25 0 – 5.6 Metal 0.9 – 3.3 0 – 0.5 Leather 0 – 0.2 0 – 1.9 Earthenwares 0 – 0.2 0 – 0.8 Bottles, boxes 0 – 10.2 0 – 4.3 Batteries 0 – 0.1 0 – 0.1 Cotton 0 0 – 2
Table 3 Percentage of compositions of solid waste of HCMC at sources and at transfer stations (PADDI, 2012)
Figure 5. Weight of solid waste and annual population of HCMC in recent years (DONRE, 2016)
role in the stages of HCMC development by drai-nage, water transportation and agricultural acti-vities and are under the management of many different departments. Waterway network is also a conveyor of untreated wastewater discharged directly from households and industrial activi-ties. Domestic wastewater usually goes through septic tank to the collection system of the city and is then discharged to the city’s canal network whereas the factories have no wastewater treat-ment system or have one but ineffective opera-tion. Therefore, environmental pollution of the city’s waterway network is unavoidable (Hoang Thi Thanh Thuy et al, 2007; Vo Le Phu, 2009). In addition, the width of some canals becomes nar-rower due to the invasion from both sides of the canals and by garbage improperly discarded into the canals.
The five main canal systems in the urban area include Nhieu Loc – Thi Nghe, Doi – Te, Ben Nghe – Tau Hu, Tan Hoa – Lo Gom and Tham Luong – Ben Cat – Vam Thuat. Excepting an upcoming flooding control project for the Tham Luong – Ben Cat canal (EIXI, 2015), the others have been supported by international organisations to construct and operate facilities relating to drai-nage, flood control and pollutants removal, such as the Nhieu Loc – Thi Nghe canal and Tan Hoa – Lo Gom canal funded by the World Bank, Ben Nghe – Tau Hu canal and Doi – Te canal funded by the Japan International Cooperation Agency – JICA (EIXI, 2015; Worldbank, 2012; BTC, 2014). This paper mentions in detail the floating debris in the Nhieu Loc – Thi Nghe and Doi – Te, Ben Nghe – Tau Hu canals as follow.
3.1. Nhieu Loc – Thi Nghe canal
The natural Nhieu Loc – Thi Nghe canal plays an important role in the establishment and develop-ment of the city. At the beginning of the reclama-tion of the South of Vietnam, together with Ben Nghe arroyo, the Nhieu Loc – Thi Nghe canal was well-known as Sai Gon’s most beautiful canal where cultural, commercial and transportation activities used to be really busy. However, until the 1970s, the canal became terribly polluted by the discharge of solid waste and waste water by the residents migrating from other places to live in the slumbs along the canals. Moreover, since the end of the 1980s, the city’s urbanization and industrialization again induced a boom in migra-tion of the residents from other regions to the city and the establishment of a series of factories without any care to the environment had brought canals to a moribund state (Vu Nhat Tan, 2013). The Nhieu Loc – Thi Nghe canal is the main canal of the Nhieu Loc – Thi Nghe canal system which has a basin of about 3,000 ha with the length of the main canal of 9,470 m and the total length of its sub-canals of 8,716 m. The Nhieu Loc – Thi
Nghe canal, starting from the box culvert near the No. 1 bridge (in Tan Binh district) pouring to the Sai Gon river at Ba Son gate, meanderingly flows through many urban districts of HCMC, i.e. Phu Nhuan, Go Vap, Binh Thanh, Tan Binh, 10, 3 and 1. In 1993, The World Bank and the City funded the first HCMC Environmental Sanitation Pro-ject to resurrect the Nhieu Loc – Thi Nghe canal (120 and 256 Million USD, respectively) from its moribund state. In 2012, after a decade of reha-bilitation of the drainage system, wastewater collection and riverbank urban masterplan, the benefits of the project are significant not only for the residents’ quality of life but for the tourism activity and the increase in property values. Currently, a second HCMC Environmental Sani-tation Project funded by the World Bank aims to build a wastewater treatment plant for the was-terwater collected around the Nhieu Loc – Thi Nghe canal and the rapidly growing District 2 area (World Bank, 2014).
The Nhieu Loc – Thi Nghe canal has many sub-canals such as the Bong Bridge canal, Van Thanh canal, Bung Binh canal and Phan Van Han canal. However, most of the sub-canals are terribly pol-luted and nearly clogged by the invasion of the slums along both sides of the sub-canals.
3.2. Doi – Te and Ben Nghe – Tau Hu canal systems
The Ben Nghe – Tau Hu and Doi – Te canal sys-tems locating in the South of the urban area of HCMC flow through the districts 1, 4, 7 and 8 and are the waterway connecting the city with Mekong River Delta. Commercial activities used to be really dense on the whole canals. Currently, there are some bustling places on Doi, Te and Tau Hu canals, where agricultural products such as coconuts, bananas and flowers transported from the Mekong River Delta are sold.
The canals have been rehabilitated by the HCMC Water Environment Improvement Project for Tau Hu - Ben Nghe – Doi – Te Canal Basin fun-ded JICA. The canal environment has been signi-ficantly improved too. Beside the visual aspect, the banks were reinforced by concrete embank-ments in Ben Nghe, Tau Hu and Te canals, the densely stilt house areas were removed around the “Y confluence” and Nguyen Van Cu bridges and the inhabitants relocated. The relocation is still in progress along the Doi – Te canal.
4. CANAL FLOATING DEBRIS COLLEC-TION
The floating debris in the canals may origi-nate from two sources: human discarding solid wastes, and natural vegetal such as water
hya-cinths floating in the Sai Gon River and drifted into the canals during high tide. The people living along or in the neighborhood of the canals are responsible via voluntarily/involuntarily and di-rectly/indirectly improperly discard of garbage into the canals and sewage system. These people are the habitants of stilts, house or boat along the canal and subcanals, pedestrians enjoying the riverbanks, or people throwing waste directly in sewage system ending up in the canals. Because of the insufficient solid waste management, the lack of public garbage bins along the canal and the lack of education regarding environmental issues of the population, the throwing of garbage in the water is a common habit.
The collection of floating debris in the canals of HCMC is a recent activity, which started in 1999 in the Doi – Te and Ben Nghe – Tau Hu canals and in 2012 in Nhieu Loc – Thi Nghe. In the Doi – Te and Ben Nghe – Tau Hu canals, before 2014, the work was done absolutely manually. Since then, machine-based process has been applied to the in-canal waste collection procedure, more waste has been collected and the work becomes easier. We’ve heard from the inhabitants and the wor-kers that before the collection starts, the amount of floating waste was so huge that people could walk on it to cross the canals. Beside the visual aspect, the collection is important to maintain the canal drainage, to prevent the clogging of the waterways, to reduce the flooding in the city/ municipal areas, to improve the living environ-ment and to stimulate the economic develop-ment via tourism, and for our concern, to reduce the plastics flowing into the ocean.
As for the solid waste management, the floating debris management of the main city canals, inclu-ding Nhieu Loc – Thi Nghe, Tan Hoa – Lo Gom, Doi – Te, and Ben Nghe – Tau Hu is under the super-vison of the DONRE, and is undertaken by public companies: the Transportation Enterprise No.3 (referred to as the TE3 hereafter), belonging to the Citenco, collects floating debris in the Nhieu Loc – Thi Nghe and Tan Hoa – Lo Gom canals, and the District 8 Public Service Co., Ltd. (referred to as the DVCIQ8 hereafter) collects floating debris in the Doi – Te and Ben Nghe – Tau Hu canals. The floating debris life cycle in HCMC’s canals is specific to each canal and do not interfere with the solid waste management procedure. Therefore, its procedure is fully described and sketched in Figure 6. The environmental wor-kers, are equipped with some certain collecting tools/machines as well as safety working clo-thing and so on, directly and continuously touch the hazardous debris and breathe the foul odors from all kinds of debris. In addition, the working shift is really long and they have to work almost every day. Especially in the New Year, they have no day off and even need to work harder. It is a really tough work.
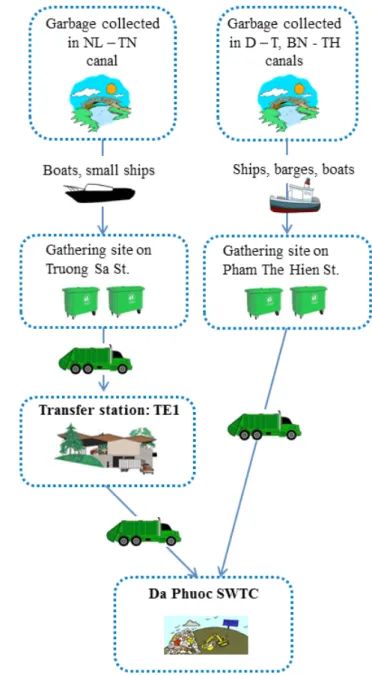
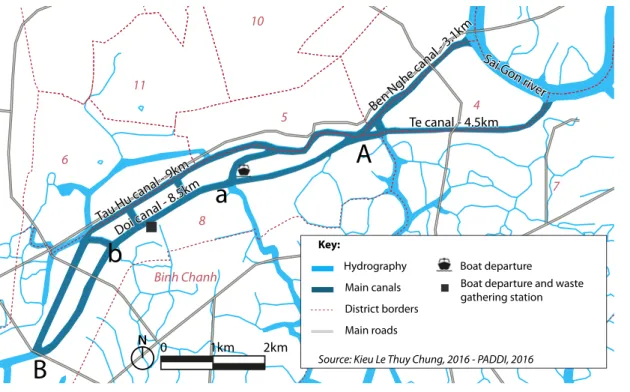
4.1. Floating debris collection in the Nhieu Loc – Thi Nghe canal
At the beginning in 2012, floating debris collec-tion was done every two days. Recently, due to the need to clean the canal for tourism purpose, the workers work every day. There are 50 envi-ronmental workers working on 12 engine com-posite boats in which 3 boats are equipped with a crank. The working shift starts from 6:00 am to 6:00 pm with a one-hour break at noon. The work is temporally stopped if the water level is too low for the vehicles to move in the canal or heavy rain.
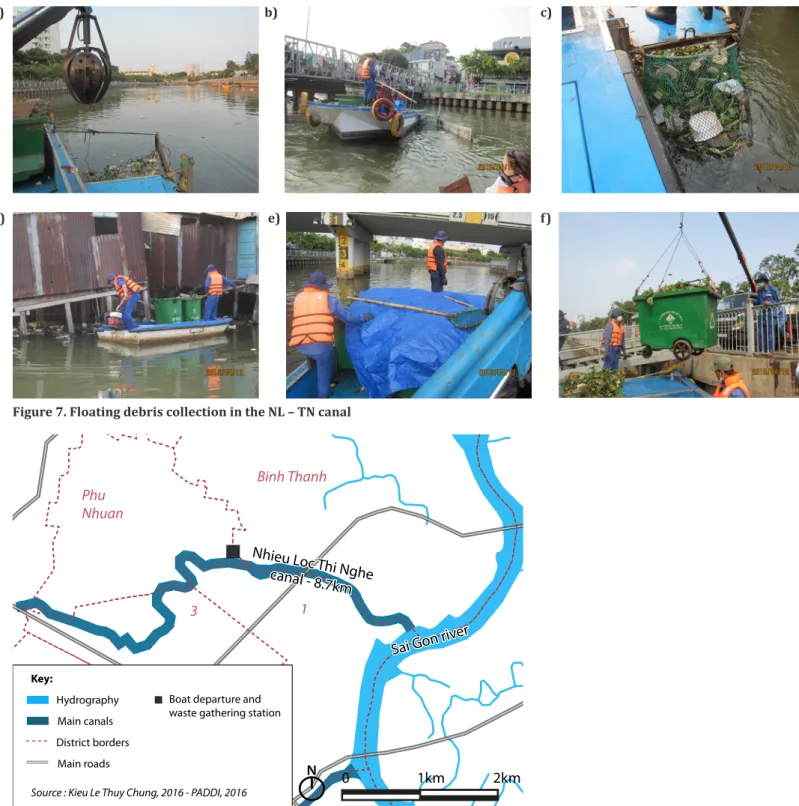
For each big boat with crank, there are three workers, i.e. one boat-driver/crank-operator and two workers picking up the big-size debris. Small size debris will be caught by two nets fixed on both sides of the boat (Figure 7a & b). Once the net has been filled, it will be lifted up by a
spe-Figure 6. Life cycle of canal floating debris Kieu Le Thuy Chung, 2016
cial small crank and the debris is poured into the containers (Figure 7c). In addition, small boats are used for collection under stilt houses or any other areas that cannot be accessed by big boats. On each small boat, two workers on small boats without engine use handhold nets and manually pick up the debris (Figure 7d). Once the contai-ners are full, the workers cover the contaicontai-ners with a big mat so that the debris cannot fly, and other people cannot see nor feel bad smell (Figure 7e). The containers on the boats are lif-ted up on land at the gathering station locating next to the Rach Mieu sport center on Truong Sa street (Figure 7f & Figure 8) and then trans-ported to a transfer station on Quang Trung St.,
Go Vap district (the Transportation Enterprise No.1 – the TE1 hereafter) and then transported to Da Phuoc. The collection on this canal is very efficient: the group leader is daily checking by motorbike if there is any area that still has some floating debris left, and it is rare to observe any residual floating debris in the canal right after their shift.
4.2. Floating debris collection on the Doi – Te and Ben Nghe – Tau Hu canals
The floating debris collection in the Doi – Te and Ben Nghe – Tau Hu canals, undertaken by the DV-CIQ8 has a different organization than the Nhieu
Figure 7. Floating debris collection in the NL – TN canal
Figure 8. Garbage collection in the Nhieu Loc – Thi Nghe canal Nhieu Loc Thi Nghe canal - 8.7k
m Nhieu Loc Thi Nghe canal - 8.7k
m
Sai Gon river
Sai Gon river 2
Binh Thanh 1 3 Phu Nhuan 10 N Key: Hydrography Main canals District borders Main roads
Source : Kieu Le Thuy Chung, 2016 - PADDI, 2016 0 1km 2km
Boat departure and waste gathering station
b) a) d) c) f) e)
Loc – Thi Nghe canal. Because of the length of the canals, different teams are working in the same time on a specific area. The Figure 9 represents the organization set by the DVCIQ8 for the col-lection. Some ships are collecting the floating debris daily at sites A, B, a, and b, whereas other collect the along the canal every two days. The gathering station, where all debris collected from the canals are brought to and then lifted on-shore to the garbage trucks, are located at the address 1724 Pham The Hien street. Then the wastes are transported to Da Phuoc for burrial, without any sorting.
At this company, there are 87 workers working on vehicles with crank such as barges, ships, composite boats and small boats. At the gathe-ring station, there is one crank for lifting the gar-bage from ships/barges up to onshore. The wor-king shift starts from 6:00 am to 6:00 pm with one-hour break at noon. When the water level is too low for the vehicles to go, garbage collection is temporally stopped.
Compared to the Nhieu Loc – Thi Nghe canal, garbage collection carried out by the DVCIQ8 is more mechanical. On each big ship/barge, there are about five workers – one driver (group lea-der), one crank operator, two to three workers handling the nets. The ship run slowly with two nets attached at its both sides so that the floating debris can flows into. Once the net is full, it will be lifted up by a crank and put in the ship hold (Figure 10a). Then, another net is again attached to the side of the ship. There is 1 or 2 small boats going ahead to push the debris near shore out to the center of the canal so that the big ship can collect easily. The ships/barge go back to the
ga-thering station twice a day, i.e. before noon and at late afternoon so that full net will be lifted up on land and then the waste will be poured down to a cask and again lifted up to the garbage truck by a crank standing on the station and then transpor-ted to Da Phuoc. The empty net is then washed and put in the ship hold for the next use.
The collection efficiency on this canal is poorer, as seen by the constant floating debis observed, even if the operation is more machine-based (Fi-gure 10b). In fact, the equipment is less adapted to track the debris near the bank where the wa-ter depth is low, and more attention is received to large patches of grasses and water hyacinth rather than plastic bags and bottles, probably for nagivation purpose.
5. FLOATING WASTE ESTIMATION IN THE HCMC CANALS
To estimate the amount of floating plastic
collec-Figure 10. a) Floating debris collection in Doi canal; b) Floating debris remai-ned in Tau Hu canal after collection of large patches of garbage
Figure 9. Garbage collection on Doi – Te and Ben Nghe – Tau Hu canals
b) a)
A
B
a
b
Ben Nghe cana l - 3.1k m Te canal - 4.5km Doi canal - 8.5k m Tau Hu canal - 9k m
Ben Nghe cana l - 3.1k m Te canal - 4.5km Doi canal - 8.5k m Tau Hu canal - 9k m Sai G on r iver Sai G on r iver N Key:
Hydrography Boat departure Main canals
District borders Main roads
Source: Kieu Le Thuy Chung, 2016 - PADDI, 2016
0 1km 2km
Boat departure and waste gathering station Binh Tan 1 3 10 11 6 5 4 7 8 Binh Chanh
ted in the canals, we combined data achieved dai-ly by the companies, i.e. the TE3 and the DVCIQ8, and data achieved by measurement of the wastes themselves.
5.1. Amount of collected floating debris
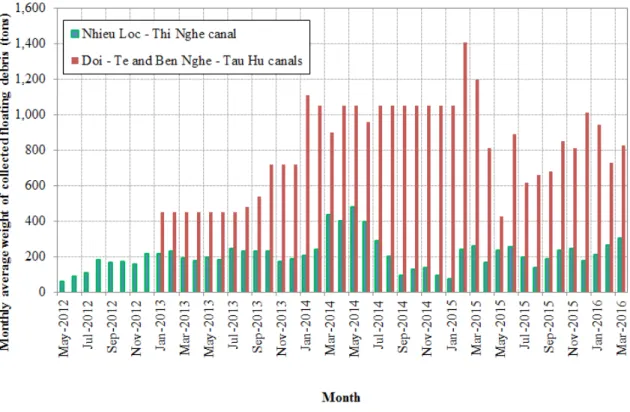
Monthly data of the amount of collected floating debris were provided for each canal by the two companies, i.e. the TE3 and the DVCIQ8. The amount collected differed between the canals, being naturally higher in Doi – Te and Ben Nghe – Tau Hu canals, the bigger system (Figure 11 and Table 4). In contrary to the time evolution of col-lected solid waste in HCMC, the colcol-lected floating wastes do not increase through time. This state-ment can evidence two different matters. First, in the Nhieu Loc – Thi Nghe canal, where the col-lection is highly efficient, it seems that the waste discarding either by waste water or by the popu-lation do not increase through time. The rehabi-litation of the system looks sustainable through time concerning this issue. In contrary, in the Doi – Te and Ben Nghe – Tau Hu canals, the remain of a large amount of floating debris and the absence of increasing amount of collection rather suggest that the collection is not adapted to this specific environment and the technical and staff capacity are under evaluated.
5.2. Types of collected floating debris
Floating debris found in the urban canals in-cludes many types of materials: vegetal (mainly
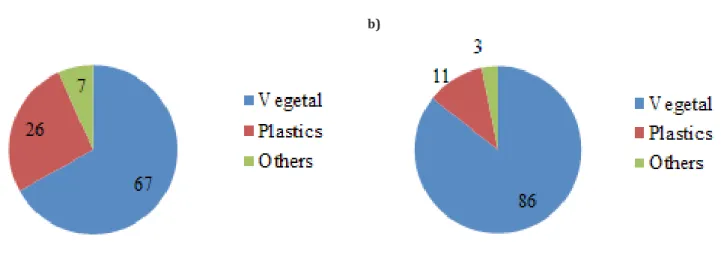
hyacinths and coconuts), beverage bottles, food wrapping boxes, straws, plastic bags, alumi-num foils, cans, glass bottles, medicines and man-made woods. We collected representative subsamples of collected floating debris on each canals by the workers and sorted them in order to better estimate the proportion of vegetal, plas-tic items and other materials (Figure 12 & 13). Unexpectedly, the mass proportion of plastic items collected in water is high, from 11-26%, especially knowing the low density and weight of these materials. The observations differed and could be linked both to the different waste col-lection method and efficiency and to the inhabi-tant’s habits in the neighbourhood.
In the Nhieu Loc – Thi Nghe canal, we have obser-ved variable types and percentage of floating de-bris according to the location. At the Bong Bridge canal, stilt houses area, we found more plastic items such as plastic bags and unexpected debris such as bed mattresses. During low tide, floating debris from the Bong Bridge canal flows in to the Nhieu Loc – Thi Nghe canal and is picked up at the confluence by the workers. From Ba Son gate to solid waste station at Rach Mieu sport center, most of the debris is composed of vegetal coming from the Sai Gon river whereas in the upstream area, we found mainly plastic bottles, food boxes, straws, and plastic bags. We also observed a va-riation of floating debris items through the part of the day, with more plastic bags, bottles and food plastic boxes collected in the morning, cor-responding to the garbage discarded by the
destrians from the previous night. The workers also noticed to us that from Tet to end of April, hyacinths flowing into the canal are more impor-tant whereas more plastic items are collected during holidays.
In the Doi – Te and Ben Nghe – Tau Hu canals, it is more difficult to observe the variation of floating debris types because of the omnipresence of de-bris in the canals and the low efficiency and the specific sorting of the collection. In fact, house-hold floating debris can be found everywhere in the canals, especially in the stilthouse slums. Ve-getal such as hyacinths, green coconut husks and shells, soaked with water, are present all year and contribute to a large amount of the wastes. From the data achieved by the TE3 and the DV-CIQ8 (Table 4) and by our observations (Figure 12), we estimated a global annual amount of col-lected plastic waste in the canals of 1,300 tons to 2,100 tons (Table 5) from 2013 to 2015 res-pectively. We note that this is a first global esti-mation that required to be specified and deepe-ned in the future investigations. Furthermore, considering the low density of plastics, i.e. light weight, the annual amount of estimated collected plastics in the canals is huge. In fact, in the Seine River, the river crossing Paris megacity (10 mil-lions inhabitants) in France, the Department of Development and Prospective intercept annually between 22 and 36 tons of floating plastic debris
in its boom network (Gaspéri et al., 2014), which is two order of magnitude lower than in HCMC canals. Moreover, in HCMC, it can be sure that a large amount of uncollected plastic is still left in the canals and drifts to the ocean everyday. This is easily understandable because (1) not all the canal’s debris is collected by the environmental workers (especically in Doi – Te, Ben Nghe – Tau Hu canals); (2) the collected is just the floating debris on the water surface and there is still a lot of garbage that submerges under water surface. Therefore, the real plastic waste in the canals is even much higher than the calculated in Table 5 and should be received more careful study. In ad-dition, although the environmental workers have been trying to work hard, the present debris collection seems not to be sufficient enough and needs more consideration from the city govern-ment as well as the citizens.
Consequently, if there is no long-term and sustai-nable program on garbage collection along with raising the people’s awareness of environmental protection, in the near future, the canal garbage related problems, such as clogging of the wate-rway leading more flooding in the urban areas and environmental pollution, will become too terrible to deal with.
Figure 12. Percentage mass of debris types of samples collected in April 2016 in a) Nhieu Loc - Thi Nghe canal and b) Doi – Te and Ben Nghe – Tau Hu canal. Vegetal: water hyacinths and coconut shells; Plastics: plastic bags, polystyrene food packaging, bottles, straws; Others: papers, manufactured wooden planks, aluminum cans, glass bottles (Lahens, 2016)
Table 4 Yearly canals’s collected floating debris (data provided by the TE3 & the DVCIQ8)
Year
Collected floating debris (tons)
Nhieu Loc – Thi Nghe Doi – Te,
Ben Nghe – Tau Hu Total
2013 2,484 6,330 8,814
2014 3,101 12,420 15,521
2015 2,407 10,413 12,820
b) a)
6. CONCLUSIONS
During the last decades, the rapid urbanization and industrialization process has generated high quantity of solid wastes and more diversified wastes, creating new environmental and public health challenges for local authorities. Floating waste in the canals is ascertained to contribute to a more and more terrible flooding in the city by clogging the waterways. Not only the city resi-dents but also the aquatic canal environment is seriously impacted. While most floating waste is
collected and transported to the garbage dump, other non-floating waste cannot be collected and flow out to the sea and imposes many vulnerable impacts to the ecosystem on its way.
By discarding garbage improperly, many people live near the canals or even far away from the canals can be the culprits who have to be res-ponsible for the degradation of the environment of the canals or even the remote oceans. Furthe-more, while organic waste makes up more than 60 % up to 96% of the garbage and although the
Figure 13 a) Plastic bags; b) Polystyrene; c) Others: papers, medicine, glass bottle, etc.; d) Collected floating debris at transfer station in Truong Sa Street
Year
Collected plastic waste (tons)
Nhieu Loc – Thi Nghe Doi – Te,
Ben Nghe – Tau Hu Total
2013 653 703 1,356
2014 816 1,379 2,194
2015 633 1,156 1,789
Table 5 Yearly canals’s collected plastic waste (calculated from Table 4 and Figure 12)
a) b)
city government has paid much more attention and carried out many projects to make use of the benefit from organic waste, most of the organic waste is still buried in the garbage dump every day leading to inefficient land-use and more environmental problems. If there is no urgent, deep and effective program on waste sorting at sources, benefit from organic waste is still being wasted.
While HCMC wants to become an international megacity, attracting foreign and local investment, middle-class population and high services activi-ties, the requirements for a better quality of life are increasing. The current legal and institutional framework for solid waste management needs to be strengthened to provide a clear public policy framework for all stakeholders. Improving the environmental situation also requires a better engagement from private sector, by implementa-ting regulations and new technology standards. In the same time, the awareness of local popu-lation has to be accentuated and supported by public authorities (Department of Natural Res-sources and Environment, Department of Educa-tion and Training, Department of Public Health etc., under People Committee) and civil society agencies.
REFERENCES
BTC (2014), Unexpected social impact of an infrastructure project, Reflection paper on Ur-ban Upgrading in HCMC, available at [http:// www.btcctb.org/files/web/publication/002_ Urban%20upgrading%20in%20Ho%20Chi%20 Minh%20City_Tan_Hoa_Lo_Gom_Canal_EN.pdf], accessed in October 04, 2016
DONRE (2013), Báo cáo tiến độ hoạt động năm 2012 và báo cáo hoạt động cho năm 2013. Unpu-blished, 14 p.
DONRE (2016), Hiện trạng quản lý chất thải rắn sinh hoạt tại Tp.HCM, in Vietnamese.
EIXI(2015), ESIA Draft Report – Package FRM-PPTAF 02: Environmental and Social Impact As-sessment, and Environmental and Social Mana-gement Plan, Ho Chi Minh City Steering Center of the Urban Flood Control Program.
Gasperi, J., Dris, R., Bonin, T., Rocher, V., Tassin, B. (2014), Assessment of floating plastic debris in surface water along the Seine River. Environmen-tal Pollution, Volume 195, December 2014, Pages 163–166.
Givental, E. (2014), The Ho Chi Minh City Canals: Assessing Vulnerability and Resilience Factors, Association of Pacific Coast Geographers.
HIDS (2013), Báo cáo tóm tắt quy hoạch tổng thể phát triển kinh tế - xã hội thành phố hồ chí minh đến năm 2020, tầm nhìn đến năm 2025. 115 p.
Hoang Thi Thanh Thuy, Tu Thi Cam Loan, Nguyen Nhu Ha Vy (2007), Nghiên cứu địa hóa môi trường một số kim loại nặng trong trầm tích sông rạch Tp.HCM, Tạp chí Phát Triển KH&CN, tập 10, số 01 – 2007.
IGES (2007), Sustainable Groundwater Manage-ment in Asian Cities, Japan.
Jambeck, J.R., Geyer, R., Wilcox, C., Siegler, T.R., Perryman, M., Andrady, A., Narayan, R. and Law, K.L. (2015), Plastic wasteinputs from land into the ocean, Science, Vol. 347, Issue 6223.
Lahens, L. (2016), Study of Macroplastic and Mi-croplastic Pollution in the Saigon River and Ca-nals in Ho Chi Minh City, Vietnam, Master Thesis. Available on request.
Le Meur, M. (2016), « Sous la montagne de plastique, une mine d’or ? Le mythe du recy-clage à l’épreuve d’une filière vietnamienne.», Techniques&Culture nº65-66 « Réparer le monde : excès, reste et innovation », FMSH Editions : Pa-ris.
PlasticsEurope (2015), Plastics – the Facts 2015: An analysis of European plastics production, de-mand and waste data.
Sheavly S.B. (2005), Sixth Meeting of the UN Open-ended Informal Consultative Processes on Oceans & the Law of the Sea. Marine debris – an overview of a critical issue for our oceans. Avai-lable at [http://www.un.org/depts/los/consul-tative_process/documents/6_sheavly.pdf] Accessed in October 04, 2016.
Vo Le Phu (2009), Water Resource Management in HCMC, Vietnam: an Overview, Tạp chí Phát triển KH&CN, tập 12, số 02 – 2009.
Vu Nhat Tan (2013), Lịch Sử Kênh Nhiêu Lộc-Thị Nghè, Tạp chí Khoa Học Xã Hội, số 3(175)-2013 Worldbank (2012), Report No: ICR2375: Imple-mentation Completion and Results Report (IDA-34750 IDA-47080)
Worldbank (2014), Report No: PAD889: Pro-ject Appraisal Document on a Proposed Loan in the Amount of US$250 Million and on a Pro-posed Credit in the Amount of SDR135.3 Mil-lion (US$200 MilMil-lion Equivalent) to the Socialist Republic of Vietnam for the Second Ho Chi Minh City Environmental Sanitation Project.