HAL Id: hal-00303217
https://hal.archives-ouvertes.fr/hal-00303217
Submitted on 18 Dec 2007HAL is a multi-disciplinary open access
archive for the deposit and dissemination of sci-entific research documents, whether they are pub-lished or not. The documents may come from teaching and research institutions in France or abroad, or from public or private research centers.
L’archive ouverte pluridisciplinaire HAL, est destinée au dépôt et à la diffusion de documents scientifiques de niveau recherche, publiés ou non, émanant des établissements d’enseignement et de recherche français ou étrangers, des laboratoires publics ou privés.
Modeling the effect of plume-rise on the transport of
carbon monoxide over Africa and its exports with
NCAR CAM
H. Guan, R. B. Chatfield, S. R. Freitas, R. W. Bergstrom, K. M. Longo
To cite this version:
H. Guan, R. B. Chatfield, S. R. Freitas, R. W. Bergstrom, K. M. Longo. Modeling the effect of plume-rise on the transport of carbon monoxide over Africa and its exports with NCAR CAM. Atmospheric Chemistry and Physics Discussions, European Geosciences Union, 2007, 7 (6), pp.18145-18177. �hal-00303217�
ACPD
7, 18145–18177, 2007Modelling the effect of plume-rise on the transport of CO H. Guan et al. Title Page Abstract Introduction Conclusions References Tables Figures ◭ ◮ ◭ ◮ Back Close
Full Screen / Esc
Printer-friendly Version Interactive Discussion
EGU Atmos. Chem. Phys. Discuss., 7, 18145–18177, 2007
www.atmos-chem-phys-discuss.net/7/18145/2007/ © Author(s) 2007. This work is licensed
under a Creative Commons License.
Atmospheric Chemistry and Physics Discussions
Modeling the effect of plume-rise on the
transport of carbon monoxide over Africa
and its exports with NCAR CAM
H. Guan1,2, R. B. Chatfield2, S. R. Freitas3, R. W. Bergstrom1, and K. M. Longo3
1
Bay Area Environmental Research Institute, Sonoma, CA, USA
2
NASA Ames Research Center, Moffett Field, CA, USA
3
Center for Weather Forecasting and Climate Studies (CPTEC), INPE, Cachoeira Paulista, Brazil
Received: 21 September 2007 – Accepted: 16 November 2007 – Published: 18 December 2007
ACPD
7, 18145–18177, 2007Modelling the effect of plume-rise on the transport of CO H. Guan et al. Title Page Abstract Introduction Conclusions References Tables Figures ◭ ◮ ◭ ◮ Back Close
Full Screen / Esc
Printer-friendly Version Interactive Discussion
EGU
Abstract
We investigated the effects of fire-induced plume-rise on the predicted export of carbon monoxide (CO) over Africa during SAFARI 2000 using the NCAR Community Atmo-sphere Model (CAM) with a CO tracer and plume-rise parameterization scheme. The plume-rise parameterization scheme simulates the consequences of strong buoyancy 5
of hot gases emitted from biomass burning, including both dry and cloud-associated (pyrocumulus) lofting. The scheme was first adapted from a regional model. The cur-rent implementation of the plume-rise parameterization scheme into the global model provides an opportunity to examine the effect of plume-rise on long-range transport. The CAM simulation with the plume-rise parameterization scheme shows a substantial 10
improvement of the agreements between the modeled and aircraft-measured vertical distribution of CO over southern Africa biomass burning area. The plume-rise mecha-nism plays a crucial role in lofting biomass burning pollutants to the middle troposphere. In the presence of deep convection we found that the plume-rise mechanism results in a decrease of CO concentration in the upper troposphere. The plume rise depletes the 15
boundary layer, and thus leaves lower concentrations of CO to be lofted by the deep convection process. The effect of the plume-rise on free troposphere CO concentration is more important for the source area (short-distance transport) than for remote areas (long-distance transport). The plume-rise scheme also increases the CO export fluxes from Africa to the Atlantic and Indian Oceans. These results further confirm and extend 20
previous findings in a regional model study. Effective lofting of large concentration of CO by the plume-rise mechanism also has implication for local air quality forecast in areas affected by other fire-related pollutants.
1 Introduction
Carbon Monoxide (CO) is one of the principal pollutants in the atmosphere and has an 25
ACPD
7, 18145–18177, 2007Modelling the effect of plume-rise on the transport of CO H. Guan et al. Title Page Abstract Introduction Conclusions References Tables Figures ◭ ◮ ◭ ◮ Back Close
Full Screen / Esc
Printer-friendly Version Interactive Discussion
EGU as a sensitive tracer of incomplete combustion, enabling the tracking of long-distance
transport (Pickering et al., 1996; Wang et al., 1996; Li et al., 2005; Staudt at al., 2001; Bey et al., 2001; Sinha at al., 2004; Chatfield el al., 1997; Freitas at al., 2006; Damoah et al., 2006; Duncan et al., 2007). The biomass burning of the natural vegetation is a significant source of CO in Central and Southern Africa (Hao et al., 1990; Andreae, 5
1991; Matichuk at al., 2007). During the southern hemispheric dry season, farmers across the region burn savanna and forest to clear land and revitalize the soil. The region is subject to some of the highest levels of biomass burning emissions in the world during August–September.
Biomass burning releases a large amount of thermal energy which creates a strong 10
updraft. This updraft has a huge impact on tracer distribution through a direct and rapid injection into the free troposphere as well as the stratosphere (Fromm et al., 2000; Jost et al., 2004; Freitas et al., 2006; Rosenfeld et al., 2007). Various models (Liousse et al., 1996; Freitas et al., 2006; Turquety, 2007; Matichuk et al., 2007; Wang et al., 2006) have estimated the impact of the biomass burning in the free troposphere on 15
CO or aerosol simulations. However, most of the researchers assumed a constant injection-height in their simulation domains. For example, Wang et al. (2006) assumed an injection-height of 1.2 km in their mesoscale modeling of Central America smoke transport. Similarly, Matichuk et al. (2007) also used constant injection height within the study domain to examine the sensitivity of injection height on aerosol optical depth 20
during the Southern African Regional Science Initiative (SAFARI 2000) (Swap et al., 2003). Previous studies suggest various values of injection height that range from 1.2 km for Central American fires to 8 km in Canadian intensive “crown” fires (Wang et al., 2006). The actual injection height depends on environmental conditions (stability, the amount of water vapor, and wind speed), heat flux (Freitas et al., 2006) and the 25
size of the fire, and thus the use of constant injection height in global models is not realistic. The accurate injection height for biomass burning emissions is of fundamental importance for plume transport and therefore we need a more accurate way to create the correct injection height for biomass burning.
ACPD
7, 18145–18177, 2007Modelling the effect of plume-rise on the transport of CO H. Guan et al. Title Page Abstract Introduction Conclusions References Tables Figures ◭ ◮ ◭ ◮ Back Close
Full Screen / Esc
Printer-friendly Version Interactive Discussion
EGU Recently, Freitas et al. (2006, 2007b) implemented a plume-rise parameterization
scheme in the CATT-BRAMS model (Coupled Aerosol and Tracer Transport model to the Brazilian developments on the regional Atmospheric Modeling System) and demon-strated the impact of the plume-rise mechanism on the regional model simulation. In this study, we examine the effects of this plume-rise parameterization scheme on the 5
CO simulation by a large-scale global model. Our simulations are focused on the biomass burning plume observed during the SAFARI 2000 Dry Season Campaign of September 2000 (Swap et al., 2003).
This paper is organized as follows: the 3-D global model and implementations of CO chemistry and plume-rise parameterization schemes are summarized in Sect. 2; 10
model results are compared to ground-based, aircraft, and MOPITT (Measurements Of Pollution In The Troposphere) satellite measurements in Sect. 3; in Sect. 4, the effects of plume-rise mechanism on CO exports to the Southern Atlantic and Indian Oceans are examined, and finally a summary is given in Sect. 5.
2 Model description
15
The model used in this study is an offline version of the NCAR CAM3.1 and a complete description can be found from the NCAR website athttp://www.ccsm.ucar.edu/models/ atm-cam/docs/description/description.pdf. Here we only highlight the main features and modifications to the model. The CAM is a global general circulation model that can run in three different dynamical cores. In this work, we have chosen the finite 20
volume (FV) dynamical core (Lin, 2004) since Rasch et al. (2006) have demonstrated that the FV dynamical core is conservative, less diffusive, and maintains the nonlin-ear relationships among variables required by thermodynamic and mass conserva-tion constraints more accurately compared to the other two dynamical cores (spec-tral and semi-Lagrangian cores). In addition to the new implementation of the plume-25
rise scheme, the vertical transport processes of tracer gases also include larger-scale vertical motion, deep convection (Zhang and McFarlane, 1995), and vertical
turbu-ACPD
7, 18145–18177, 2007Modelling the effect of plume-rise on the transport of CO H. Guan et al. Title Page Abstract Introduction Conclusions References Tables Figures ◭ ◮ ◭ ◮ Back Close
Full Screen / Esc
Printer-friendly Version Interactive Discussion
EGU lent mixing (Holtslag and Boville, 1993). The model employs a 2◦×2.5◦ regular
lati-tude/longitude grid with 26 vertical layers, having a model top layer located at between 2 and 4 hPa. The meteorological fields used to drive the model were obtained from the NCEP (National Center for Environmental Prediction) reanalysis with 6-h resolution (Kalnay et al., 1996). The 13-day simulation was performed from 1 September 2000 5
until 13 September 2000. The initial conditions were created from a one-year spin-up run driven by the NCEP meteorological data.
2.1 CO chemistry
The 3-D source of CO throughout the atmosphere results from the reaction between hydroxyl radicals (OH) and methane. The major sink of CO occurs through its re-10
action with OH. We simulate the sink with a monthly averaged OH data generated from GMI/GISS (Goddard Institute of Space Science) simulations with a full chem-istry model. The monthly surface emissions include fossil fuel, biofuel, biomass burn-ing, continental biogenic and oceanic net sources, which were derived by P ´etron et al. (2004) based on an inverse modeling method using the MOPITT data for a specific 15
month.
Emissions from biomass burning are known to be a large source of CO over the tropical and subtropical regions (Crutzen et al., 1979; Koppmann et al., 1997, 2005; Andreae at al., 1997; Sinha et al., 2004), while biomass burning emissions are highly variable in time and space. The monthly averaged biomass burning emission, which 20
was generally used by many previous researchers, cannot represent fires that last just a fraction of month. For example, Chin et al. (2007) attributed the missed high black and organic carbon episode in their GOCART (Goddard Chemistry Aerosol Radiation and Transport) simulation to the coarser time resolution of emission data (monthly fire emission data). To account for the day-to-day variation of biomass burning CO emis-25
sions, here we have used the Terra-MODIS (the MoDerate Resolution Imaging Spec-troradiometer) daily fire count data as a solution. Fire detections are gleaned using MODIS’s thermal band for twice within a day (∼10:30 a.m. and 10:30 p.m.
equator-ACPD
7, 18145–18177, 2007Modelling the effect of plume-rise on the transport of CO H. Guan et al. Title Page Abstract Introduction Conclusions References Tables Figures ◭ ◮ ◭ ◮ Back Close
Full Screen / Esc
Printer-friendly Version Interactive Discussion
EGU crossing times). The daily biomass burning CO emission rate is simply approximated
as the product of monthly CO emission and the ratio between daily and monthly fire counts for each grid.
2.2 Plume-rise parameterization scheme
The plume-rise parameterization scheme was originally developed by Latham (1994) 5
and implemented into a regional forecast model by Freitas et al. (2006, 2007a). The vertical transport of hot gases and particles emitted from biomass burning in low reso-lution atmospheric-chemistry transport models is simulated by embedding a 1-D cloud resolving model with appropriate lower boundary conditions in each column of the 3-D host model. MODIS/Terra fire counts provide the fire location, and land use datasets 10
are used to characterize the fire properties. The CAM model provides the environmen-tal conditions and, finally, the plume rise is explicitly simulated. The lower and upper limits of the final rise of the plume are then used in the source emission field of the CAM model to determine the vertical injection range during the flaming phase for each time step.
15
Land-cover data were derived from the MODIS land-cover product at 1-km resolu-tion. The primary land-cover types in this product are 17 land cover classes following the International Geosphere-Biosphere Programme (IGBP) scheme. Since there is not enough data available to determine the typical heat flux of fires in each MODIS class, here we aggregate the classes into three major vegetation types: forest (evergreen 20
needleleaf forest and evergreen broadleaf), savanna (deciduous needleleaf forest, de-ciduous broadleaf forest, closed shrubland, open shrubland, woody savannas, and savanna), and grassland (grassland, cropland, cropland natural vegetation, barren or sparsely vegetation). Following Freitas et al. (2007a), the minimum (maximum) heat fluxes for forest, savanna, and grassland fires are taken as 30.0 (80.0), 4.4 (23), and 25
3.3 (3.3) kW m−2, respectively. Similar to the work in Freitas et al. (2005), a constant fire size (20 ha) is used in this study. Preliminary test runs, using fire sizes of 10, 20, and 40 ha have shown that the patterns and magnitudes of simulated biomass plumes
ACPD
7, 18145–18177, 2007Modelling the effect of plume-rise on the transport of CO H. Guan et al. Title Page Abstract Introduction Conclusions References Tables Figures ◭ ◮ ◭ ◮ Back Close
Full Screen / Esc
Printer-friendly Version Interactive Discussion
EGU are very similar. The existence of a diurnal cycle of fire activity has been established
through both ground-based observations and satellite data (Prins and Menzel, 1992; Langaas, 1993; Prins et al., 1998; Eva and Lambin, 1998; Pack et al., 2000; Justice et al., 2002). Following Freitas et al. (2005), the emission diurnal cycle is defined by a Gaussian function with a peak value at local afternoon (13:45 p.m.) and width of 8 h. 5
The peak time is consistent with that typically observed by Tropical Rainfall Measuring Mission (TRMM) Visible and Infrared Scanner (VIRS) (Giglio and Pinzon, 2003).
3 Evaluation of CAM simulation
The CAM simulation was evaluated using ground-based, aircraft, and MOPITT satellite measurements made during SAFARI 2000. The corresponding locations of ground-10
based and airborne CO measurements are displayed in Fig. 1. 3.1 Evaluation with MOPITT CO measurements
The MOPITT instrument, onboard EOS/Terra, makes nadir observations of CO. The CO mixing ratios are retrieved for 7 pressure levels from the surface to 150 hPa with the highest sensitivity at 700 hPa and a 10% precision (Deeler et al., 2003; Li et al., 15
2005). Here we focus on the comparison between the model and MOPITT Level-3 (L3) CO at 700 hPa. The model data is interpolated to the MOPITT grid (1◦×1◦). Retrievals are performed using the optimal estimation technique (Pan et al., 1998, Edwards at al., 1999). To make a proper comparison between the MOPITT retrievals with the
CAM simulation, the modeled CO profile (x) must be transferred using the MOPITT 20
a priori CO profile (ax) and averaging kernel matrix A. The retrieved CO (x’) profiles can be approximately as:
x′
= ax+ A(x -ax).
A single, global a priori profile is used for the L3 retrieval (Deer et al., 2003), while the averaging kernel depends on the temperature profile, surface temperature, and 25
ACPD
7, 18145–18177, 2007Modelling the effect of plume-rise on the transport of CO H. Guan et al. Title Page Abstract Introduction Conclusions References Tables Figures ◭ ◮ ◭ ◮ Back Close
Full Screen / Esc
Printer-friendly Version Interactive Discussion
EGU surface emissivity, and is thus a function of temporal and spatial coordinates. The
transferred mean CO concentrations during 10–12 September 2000 at 696 hPa for the runs with and without the plume-rise parameterization are compared with the corre-sponding MOPITT 3-day composite CO at 700 hPa (Fig. 2). The general patterns in CO concentration are strikingly consistent among the simulations and satellite mea-5
surements. Elevated CO concentrations are seen over the biomass burning source regions (southern Africa and South America). Both of the simulations and MOPITT measurements also show that CO flowed into the Southern Atlantic Ocean from south-ern Africa directly from the east. Similar to other model/MOPITT CO comparison work (Allen et al., 2004; Richards et al., 2006), the model generally has lower CO concen-10
tration than MOPITT measurements. It is also evident that the agreement between the modeled and MOPITT CO is improved when the plume-rise sub-grid mechanism is included.
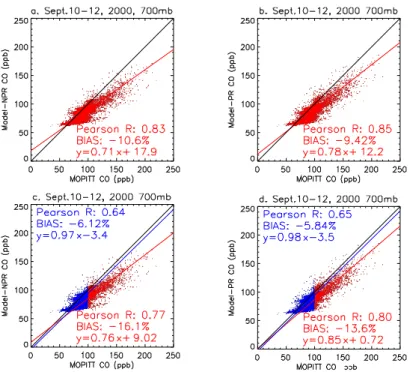
To quantitatively compare the model and MOPITT CO, scatter plots of the two datasets within the domain of Fig. 2 for the no plume rise (NPR) and plume rise (PR) 15
runs are depicted in Fig. 3a and b, respectively. There is a strong correlation be-tween the model and MOPITT CO. The correlation coefficients (R) for the NPR and PR runs are 0.83 and 0.85, respectively. The model tends to underestimate (nega-tive mean bias) MOPITT CO. The mean biases for the NPR and PR runs are −10.6% and −9.42%, respectively. The negative biases for the dataset with higher MOPITT 20
CO mixing ratio (red color in Fig. 3c–d) (−16.11% and −13.6%) are significantly larger than those with lower MOPITT CO mixing ratio (blue color in Fig. 3c–d) (−6.12% and −5.84%), implying the larger challenge in biomass burning CO prediction. When the plume-rise scheme is included, the detectable improvement in CO forecast mainly oc-curs in the dataset with higher MOPITT CO mixing ratio, with mean bias reduced from 25
−16.1% to −13.6% , correlation coefficient increased from 0.77 to 0.80, the slope of re-gression line increased from 0.76 to 0.85, and y-intercept decreased from 9.02 to 0.72. As the results indicate, the plume-rise parameterization does not substantially improve the difference between the retrieved model and MOPITT CO at 700 hPa level. Since
ACPD
7, 18145–18177, 2007Modelling the effect of plume-rise on the transport of CO H. Guan et al. Title Page Abstract Introduction Conclusions References Tables Figures ◭ ◮ ◭ ◮ Back Close
Full Screen / Esc
Printer-friendly Version Interactive Discussion
EGU the retrieved CO concentrations also include the contributions from other levels, the
increased CO concentration due to the plume-rise parameterization at 700 hPa level is partly offset by the decreased CO at lower levels.
The discrepancy between the modeled and MOPITT measured CO may be partly due to the coarse model resolution (2◦×2.5◦). Use of inaccurate emissions is another 5
possible reason. The modeled day-to-day variation of biomass burning emission de-pends on the MODIS fire count data. The presence of cloud cover with only two instan-taneous MODIS/Terra observations per day often induced missing detections of some temporal fire events, possibly, leading to emission error. Furthermore, the comparisons and validations against in-situ aircraft (Jacob et al., 2003; Emmons et al., 2004) and 10
TES satellite measurements (Luo et al., 2007; Zhang et al., 2006) indicate positive MOPITT bias. The approaches in selecting a priori profiles and averaging kernels can significantly affect the retrieval results (Luo et al., 2007). Consequently, better consid-eration of the profile retrieval process and utilization of additional data describing the retrievals would improve the accuracy in CO retrievals.
15
3.2 Evaluation with CMDL ground measurement at cape point
The ground-based CO measurements with 10-min resolution were obtained at the CMDL site at Cape Point, South Africa (34.4◦S, 18.5◦E) through the world Data Center for Greenhouse Gases (WDCGG, http://gaw.kishou.go.jp/wdcgg.html). Daily average surface CO mixing ratios at Cape Point for 1–12 September 2000 were compared to 20
daily modeled surface mixing ratios (Fig. 4). The model CO matches the observed CO for the most of simulated days well. The averaged absolute difference is only 6.4%. Cape Point samples the Southern Ocean more effectively than other southern Africa sites. The good agreement between the model and ground measurement at Cape Point implies the simple formulations of the model can simulate the background CO. 25
ACPD
7, 18145–18177, 2007Modelling the effect of plume-rise on the transport of CO H. Guan et al. Title Page Abstract Introduction Conclusions References Tables Figures ◭ ◮ ◭ ◮ Back Close
Full Screen / Esc
Printer-friendly Version Interactive Discussion
EGU 3.3 Evaluation with aircraft measurements
During the SAFARI 2000 dry-season airborne campaign, the South African Weather Bureau Aerocommander aircraft (JRA and JRB) extensively sampled smoke plumes over southern Africa. In association with the SAFARI 2000 Dry Season Campaign in Africa, the Commonwealth Scientific and Industrial Research Organization (CSIRO) 5
division of Atmospheric Research conducted aircraft measurements downwind, over Australia. The coordinated aircraft measurements provide an opportunity to check the model performance for simulating long-range transport of CO. To assess the model abilities to simulate CO concentrations and identify the effects of plume-rise processes on short- and long-range CO transports, we compared the model CO with the air-10
craft measurements for 3 and 13 September, made near the biomass burning source (South Africa and Botswana) and remote downwind (Melbourne, Australia) areas, re-spectively. A previous study (Chatfield et al., 2002) shows that the high temporal and spatial variations of plumes and relatively low spatial coverage of flight tracks make the point-to-point comparison unrealistic. Therefore, in this study, we focus on the compar-15
ison over the flight domains. Specifically, we would look at whether, within the vicinity of the flights, the model is capable of predicting plumes with similar mixing ratios and distributions.
Figure 5 shows the MISR (the Multiangle Imaging SpectroRadiometer) images of Sun Pan, Botswana (20.53◦S, 26.07◦E) in 18 August and 3 September 2000, respec-20
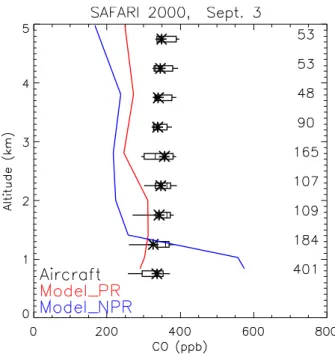
tively. It is apparent that wild and man-made grass fires that erupted earlier at several spots near the pan increased haziness in 3 September (Abdou et al., 2006). The CO vertical profiles around Sun Pan, Botswana (20–24◦S and 24–30◦E) for 3 September 2000 between the model runs and aircraft observations is compared in Fig. 6. The ob-served CO displays less variation with altitude. The averaged CO is close to 350 ppb 25
through all levels. The simulation without the plume-rise process fails to reproduce the observed vertical distribution and magnitudes. The biomass burning emissions are not effectively transported to the middle troposphere, consequently, the CO mixing ratios
ACPD
7, 18145–18177, 2007Modelling the effect of plume-rise on the transport of CO H. Guan et al. Title Page Abstract Introduction Conclusions References Tables Figures ◭ ◮ ◭ ◮ Back Close
Full Screen / Esc
Printer-friendly Version Interactive Discussion
EGU near the surface (at upper-level) are significantly higher (lower) than measurements.
Better agreement between the modeled and aircraft-measured CO is obtained for the PR run. As demonstrated in the regional model simulation over South America (Freitas et al., 2006), the plume-rise mechanism tends to loft more CO to the middle tropo-sphere. For the PR run, the simulated CO at lower levels (1 km–3 km) is closer to the 5
observation than upper levels (3 km–5 km). It should be also mentioned that the accu-racy of aircraft measurements above 3 km are less reliable (personal communication with D. Stein, 2006).
Compared to the effects of the plume-rise mechanism on source region or short-range transport, the effect on long-short-range transport is small. Figure 7 shows the 10
observed and simulated CO around Melbourne, Australia for 5 and 13 September, representing local background and polluted days, respectively. As noted in Sinha et al. (2004), the elevated CO (approximately 20 ppb higher than background values) over Melbourne, for 13 September is mainly due to long-distance transport (more than 10 000 km) from southern Africa and South America. Both the PR and NPR simula-15
tions are comparable with the observations for the clear and polluted atmosphere over Melbourne. The simulations capture the observed increase of CO mixing ratio with altitude for 13 September, and the relative uniform vertical distribution for 5 September well. The CO mixing ratio for 13 September is slightly higher for the PR run with a maximum enhancement of 6–7 ppb at 5 km, significantly lower than that for the short-20
range transport case (87 ppb at 2 km in 3 September). The smaller effect of plume-rise on CO mixing ratio for long-range transport could be explained by greater mixing with clean background atmosphere. In other words, the enhancement is spread over a large volume with time.
4 The effect of plume-rise mechanism on the CO exports
25
During the southern Africa’s dry spring season from July through October, a large amount of CO from African fires is transported to the southern Atlantic and Indian
ACPD
7, 18145–18177, 2007Modelling the effect of plume-rise on the transport of CO H. Guan et al. Title Page Abstract Introduction Conclusions References Tables Figures ◭ ◮ ◭ ◮ Back Close
Full Screen / Esc
Printer-friendly Version Interactive Discussion
EGU Oceans. The 13-day simulation in this study covers the CO exports from southern
Africa northwestward to the Atlantic and southeastward to the Indian Ocean. For the period 3–7 September, the fire that raged across southern Africa produced a thick biomass plume that was transported toward the south-west across Botswana and South Africa and ultimately to the Indian Ocean. This phenomenon has been desig-5
nated the “River of Smoke”. However, for 8–13 September, the “Great African Plume” (Chatfield et al., 1997) was directly transported westward to the Equatorial Atlantic Ocean as seen in Fig. 2.
4.1 The effect of the plume-rise mechanism on the CO Export to the Atlantic Ocean
To estimate the effects of the plume-rise on the CO export from southern Africa to the 10
southern Atlantic Ocean, we display the modeled CO concentrations (Fig. 8) for the runs with and without the plume-rise mechanism for 13 September 2000 at 696 hPa when the “Great Africa Plume” flowed into the southern Atlantic Ocean. In the simu-lation with the plume-rise scheme, the region over southern Africa and the southern Atlantic Ocean with a CO mixing ratio greater than 300 ppb is much larger than that 15
without the plume-rise scheme. Both near and distant concentrations are enhanced due to greater lofting to the lower-middle troposphere.
Figure 9a, b, and c show the vertical cross sections of CO concentrations for the NPR and PR runs and the concentration difference along the red reference lines in Fig. 8. Both of the NPR and PR runs show that CO can be lofted to higher altitudes 20
(∼200 hPa) over South America due to prevailing deep convection. In contrast, biomass burning plumes over the Southern Africa seldom reach higher troposphere because during austral spring season, anticyclonic flow is dominant over the southern African subcontinent and injection height is determined by large-scale motion, vertical mixing, and plume rise mechanisms. Significant CO enhancement by the plume rise process 25
is mainly located in the lower-middle troposphere over the biomass source regions (Southern Africa and South America) and downwind of Southern Africa. The maximum enhancements for Southern Africa and South America are more than 140 ppb and
ACPD
7, 18145–18177, 2007Modelling the effect of plume-rise on the transport of CO H. Guan et al. Title Page Abstract Introduction Conclusions References Tables Figures ◭ ◮ ◭ ◮ Back Close
Full Screen / Esc
Printer-friendly Version Interactive Discussion
EGU 100 ppb, respectively. Plume tops are also higher in the PR run than those in the NPR
run over the biomass source regions. For example, the plume top (>150 ppb) at 27◦E is 700 hPa for the NPR run, while the corresponding altitude for the PR run can reach to 550 hPa level. A similar situation can be also noted over South America. Since more CO is lofted to the lower-middle troposphere for the PR run, significant reduction in CO 5
concentration occurs at the lower troposphere near the biomass burning source areas. The CO reduction distribution in the lower troposphere is closely related to the biomass burning emission distribution (Fig. 9d).
A smaller CO reduction (less than 20 ppb) is also detected in the upper troposphere (200–500 hPa) over South America (Fig. 9c), that should be linked to deep convection 10
process. Deep convection draws mostly in the boundary layer. The CO depletion by plume-rise process in the lower troposphere leads to less CO lofting by deep convec-tion process.
The vertical cross sections of CO flux for the NPR (Fig. 10a) and PR runs (Fig. 10b) along the blue reference lines (10◦E) in Fig. 8, more clearly indicate the effect of the 15
plume-rise on CO export. Similar to the simulations in Sinha (2004), the westward (eastward) flux prevailed over the 0–18◦S (18–30◦S) latitude band. An evident feature is the westward flux core for the PR run is stronger than NPR run. The maximum difference between the PR and NPR runs (Fig. 10c) is 127 kg s−1 or 28% at 3◦S and 650 hPa. The larger westward flux of CO for the PR run induced the higher middle-20
tropospheric CO in the Southern Atlantic Ocean (Fig. 9c).
4.2 The Effect of the plume-rise mechanism on the CO export to the Indian Ocean
Figure 11 show the CO concentration at 510 hPa for the NPR run and PR run in 5 September 2000. Again the PR run produces more CO than the NPR run over both the source region and remote East Indian Ocean during the river of smoke. In addition, 25
biomass CO from Africa fires was transported to Northern Madagascar in the PR run which dose not appear in the NPR run, implying an impact of the plume-rise mecha-nism on the horizontal transport pattern. The plume-rise parameterization also leads
ACPD
7, 18145–18177, 2007Modelling the effect of plume-rise on the transport of CO H. Guan et al. Title Page Abstract Introduction Conclusions References Tables Figures ◭ ◮ ◭ ◮ Back Close
Full Screen / Esc
Printer-friendly Version Interactive Discussion
EGU to a denser smoke plume over the eastern Indian Ocean. The area with a CO
concen-tration larger than 125 ppb is substantially larger in the PR run. Figure 12 displays the zonal CO flux for the NPR run, PR run, and CO flux difference along the eastern coast of southern Africa (40◦E) for 5 September 2000. The large eastward flux near 30◦S between 600 and 750 hPa (Fig. 2a and b) characterized the river of smoke event (Sinha 5
et al., 2004). Another small eastward flux core near 16◦S between 500 and 700 hPa is embedded in the westward flux band. The two eastward flux cores are stronger in the PR run than the NPR run (Fig. 12c). The maximum enhancement of the eastward flux near 30◦S reaches 88 kg s−1(20%), which is similar to the maximum enhancement of the westward export to the Atlantic Ocean (28%) (see Sect. 4.1). To a greater degree, 10
the corresponding enhancement near 16◦S reaches 200 kg s−1(over 240%). The rea-son for the larger enhancement is that the biomass CO was lofted to the higher altitude (∼510 hPa) at the source region where the prevailing westerlies further transported CO to the Indian Ocean and Northern Madagascar in the PR run.
5 Summary
15
In this paper, we have used the NCAR CAM3 global model driven by assimilated me-teorology during SAFARI 2000 to show how the plume-rise parameterization affects the CO transport over southern Africa and exports. Source-region comparisons with aircraft data suggest that the parameterization improves the distribution in CO with al-titude and magnitude in Southern Africa as the regional model does in South America. 20
The plume-rise scheme tends to loft more biomass burning CO into the lower-middle troposphere and leads to simulations of greater export of carbon monoxide than non plume rise. Effective lofting by the plume-rise mechanism has important implications for local air quality forecast in areas affected by fire-related pollutants. In the presence of deep convection, the plume rise decreases CO concentration in the upper tropo-25
sphere. In terms of magnitude, the effect of the plume-rise mechanism on short-range transport is more significant than long-range transport during the simulation period due
ACPD
7, 18145–18177, 2007Modelling the effect of plume-rise on the transport of CO H. Guan et al. Title Page Abstract Introduction Conclusions References Tables Figures ◭ ◮ ◭ ◮ Back Close
Full Screen / Esc
Printer-friendly Version Interactive Discussion
EGU to CO dilution by clean background atmosphere.
The comparison between the model and MOPITT satellite CO indicates the CAM model can reasonably simulate the MOPITT CO patterns over South America, south-ern Africa, and corresponding exports during 10–12 September 2000 with a correlation coefficient of 0.85 for the PR run at 700 hPa level. As found in other model/MOPITT 5
comparison work, the CAM model tends to underestimate MOPITT CO by ∼10%. The coarser model resolution, inaccurate emission data, and retrieval error of MO-PITT could be potential reasons for the observed differences between the model and MOPITT CO.
Future work will simulate and understand the effect of the plume-rise parameteriza-10
tion on fire-related carbonaceous aerosols. The goal is to improve the vertical distri-bution of aerosols, which is recognized as one of the biggest challenges for aerosol simulation (ICCP, 2000). The work will also include estimating the effect of the plume-rise mechanism on various geographic fires. The CALIPSO (Cloud-Aerosol Lidar and Infared Pathfinder Satellite Observations) spaceborne lidar provides unprecedented 15
high resolution measurements of aerosol profiles on a global scale, which will help to validate the modeled vertical distribution of aerosols.
Acknowledgements. We would like to acknowledge P. Rasch, P. Hess, and D. Bundy Coleman for kindly providing their utility program for mapping NCEP reanalysis data to FV grid. We are grateful to G. P ´etron for allowing us to use her CO emission data. We appreciate R. Namani
20
and H. Hashimo for helping us to obtain MODIS land cover data. We thank the tropospheric radiation program and Terra-Aqua validation program for supporting this research. The simula-tions were performed on the Columbia supercomputer at NASA’s Ames Research Center.
References
Allen, D., Pickering, K., and Fox-Rabinovitz, M.: Evaluation of pollutant outflow and CO sources
25
during TRACE-P using model-calculated, aircraft-based, and Measurements of Pollution in the Troposphere (MOPITT)-derived CO concentrations, J. Geophys. Res., 109, D15S03, doi:10.1029/2003JD004250, 2004.
ACPD
7, 18145–18177, 2007Modelling the effect of plume-rise on the transport of CO H. Guan et al. Title Page Abstract Introduction Conclusions References Tables Figures ◭ ◮ ◭ ◮ Back Close
Full Screen / Esc
Printer-friendly Version Interactive Discussion
EGU
Abdou, W. A., Stuart H., Pilorz, M. C., Helmlinger, M. C., Conel, J. E., Diner, D. J., Bruegge, C. J., and Martonchik, J. V.: Sua Pan surface Bidirectional Reflectance: A case study to evaluate the effect of atmospheric correction on the surface products of the Multi-angle Imaging Spec-troRadiometer (MISR) during SAFARI 2000, IEEE Trans., Geoscience and Remote Sensing, 44, (7), 1699–1709, 2006
5
Andreae, M. O.: Biomass burning. Its history, use, and distribution and its impact on environ-mental quality and global climate, in: Global Biomass Burning: Atmospheric, Climatic, and Biospheric Implications, edited by: Levine, J. S., MIT Press, Cambridge, Massachusetts, pp. 3–21, 1991.
Andreae, M. O.: Emissions of trace gases and aerosols from savanna fires, Fire in the Southern
10
African Savanna: Ecological and Environmental perspectives, edited by: van Wilgen, B. W., Andreae, M. O., Goldammer, J. G., and Lindersay, J. A., Witwatersrand University Press, Johannesburg, South Africa, 161–183, 1997.
Andreae, M. O. and Merlet, P.: Emissions of trace gases and aerosols from biomass burning, Glob. Biogeo. Cycles, 15, 955–966, 2001.
15
Bey, I., Jacob, D. J., Logan, J. A., and Yantosca, R. M.: Asian chemical outflow to the Pacific in spring: Origins, pathways, and budgets, J. Geophys. Res., 106, 23 097–23 114, 2001. Chatfield, R. B., Vastano, J. A., Li, L., Sachse, G. W., and Connors, V. S.: The Great African
plume from biomass burning: Generalizations from a three-dimensional study of TRACE A carbon monoxide, J. Geophys. Res., 103, 28 059–28 078, 1998.
20
Chatfield, R. B., Guo, Z., Sachse, G. W., Blake, D. R., and Blake, N. J.: The subtropical global plume in the Pacific Exploratory Mission-Tropics A (PEM-Tropics A), PEM-Tropical B, and the Global Atmospheric Sampling Program (GASP): How tropical emissions affect the remote Pacific, J. Geophys. Res., 107, D16, 4278, doi:10.1029/2001JD000497, 2002.
Chin Mian, Diehl, T., Ginoux, P., and Malm, W.: Intercontinental transport of pollution and dust
25
aerosols: implications for regional air quality, Atmos. Chem. Phys., 7, 5501–5517, 2007,
http://www.atmos-chem-phys.net/7/5501/2007/.
Crutzen, P. J., Heidt, L. E., Krasnec, J. P., Pollock, W. H., and Seiler, W.: Biomass burning as a source of atmospheric trace gases: CO, H2, N2O, NO, CH3Cl, and COS, Nature, 282, 253–256, 1979.
30
Damoah, R., Spichtinger, N., Servranckx, R., Fromm, M., Eloranta, E. W., Razenkov, I. A., James, P., Shulski, M., Foster, C., and Stohl, A.: A case study of pyro-convection using transport model and remote sensing data, Atmos. Chem. Phys., 6, 173–185, 2006,
ACPD
7, 18145–18177, 2007Modelling the effect of plume-rise on the transport of CO H. Guan et al. Title Page Abstract Introduction Conclusions References Tables Figures ◭ ◮ ◭ ◮ Back Close
Full Screen / Esc
Printer-friendly Version Interactive Discussion
EGU
http://www.atmos-chem-phys.net/6/173/2006/.
Deeler, M. N., Emmons, L. K., Francis, G. L., et al.: Operational carbon monoxide retrieval algorithm and selected results from the MOPITT instrument, J. Geophys. Res., 108, 4399, doi:10.029/2002JD003186, 2003.
Duncan, B. N., Strahan, S. E., Yoshida, Y., et al.: Model study of the cross-tropopause transport
5
of biomass burning pollution, Atmos. Chem. Phys. Discuss., 7, 2197–2248, 2007,
http://www.atmos-chem-phys-discuss.net/7/2197/2007/.
Edwards, D. P., Halvorson, C. M., and Gille, J. C.: Radiative transfer modeling for the EOS Terra satellite Measurement of Pollution in the Troposphere (MOPITT) instrument, J. Geophys. Res., 104, 16 755–16 775, 1999.
10
Emmons, L. K., Deeler, M. N., Gille, J. C., et al.: Validation of Measurements of Pollution In the Troposphere (MOPITT) CO retrievals with aircraft in situ profiles, J. Geophys. Res., 109, D03309, doi:10.1029/2003JD004101, 2004.
Eva, H. D. and Lambin, E. F.: Remote sensing of biomass burning in tropical regions: Sampling issues and multisensor approach, Remote Sens. Environ., 64, 292–315, 1998.
15
Freitas, S. R., Longo, K. M., Silva Dias, M. A. F., Silva Dias, P. L., Chatfield, R., Prins, E., Artaxo, P., and Recuero, F. S.: Monitoring the transport of biomass burning emissions in South America, Environ Fluid. Mech., doi:10.1007/s10652-005-0243-7, 5(1–2), 135–167, 2005.
Freitas, S. R., Longo, K. M., and Andreae, M. O.: Impact of including the plume rise of
vegeta-20
tion fires in numerical simulations of associated atmospheric pollutants, Geophys. Res. Lett., 33, L17808, doi:10.1029/2006GL026608, 2006.
Freitas, S. R., Longo, K. M., Chatfield, R., Latham, D., Silva Dias, M. A. F., Andreae, M. O., Prins, E., Santos, J. C., Gielow, R., and Carvalho Jr., J. A. : Including the sub-grid scale plume rise of vegetation fires in low resolution atmospheric transport models, Atmos. Chem.
25
Phys., 7, 3385–3398, 2007a.
Freitas, S. R., Longo, K. M., Silva Dias, M. A. F., Chatfield, R., Silva Dias, P., Artaxo, P., Andreae, M. O., Grell, G., Rodrigues, L. F., Fazenda, A., and Panetta, J.: The Coupled Aerosol and Tracer Transport model to the Brazilian developments on the Regional Atmospheric Model-ing System (CATT-BRAMS). Part 1: Model description and evaluation, Atmos. Chem. Phys.
30
Discuss., 7, 8525–8569, 2007b.
Fromm, M., Alfred, J., Hoppel, K., Hornstein, J., Bevilacqua, R., Shettle, E., Servranckx, R., Li, Z., and Stocks, B.: Observations of boreal forest fire smoke in the stratosphere by POAM III,
ACPD
7, 18145–18177, 2007Modelling the effect of plume-rise on the transport of CO H. Guan et al. Title Page Abstract Introduction Conclusions References Tables Figures ◭ ◮ ◭ ◮ Back Close
Full Screen / Esc
Printer-friendly Version Interactive Discussion
EGU
SAGE II, and lidar in 1998, Geophys. Res. Lett., 27, 1407–1410, 2000.
Giglio, L., Pinzon, J., and Kasibhatla, P.: Comment on Seasonal intraseasonal, and interannual variability of global land fires and their effects on atmospheric aerosol distribution by Y. Ji and E. Stocker, J. Geophys. Res., 108, D24, 4754, doi:10.1029/2003JD003548, 2003.
Hao, W. M., Liu, M. H., and Crutzen, P. J.: Estimates of annual and regional releases of CO2and
5
trace gases to the atmosphere from fires in the tropics, based on the FAO statistics for the period 1975–1980, Fire in the Tropical Biota: Ecosystem Processes and Global Challenges, Ecol. Studies 84 (ed. Goldammer), 440–462, Springer-Verlag, New York, 1990.
Holtslag, A. A. M. and Boville, B. A.: Local versus nonlocal boundary-layer diffusion in a global climate model, J. Climate, 6, 1825–1842, 1993.
10
Jacob, D. J., Crawford, J. H., Kleb, M. M., Connors, V. S., Bendura, R. J., Raper, J. L., Sachse, G. W., Gille, J. C., Emmons, L., and Heald, C. L.: The Transport and Chemical Evolution over the Pacific (TRACE-P) aircraft mission: Design, execution, and first results, J. Geophys. Res., 108, D20, 9000, doi:10.1029/2002JD003276, 2003.
Jost, H.-J., Drdla, K., Stohl, A., Pfister, L., Loewenstein, M., Lopez, J. P., Hudson, P. K., Murphy,
15
D. M., Cziczo, D. J., Fromm, M., Bui, T. P., Dean-Day, J., Gerbig, C., Mahoney, M. J., Richard, E. C., Spichtinger, N., Pittman, J. V., Weinstock, E. M., Wilson, J. C., and Xueref, I.: In-situ observations of midlatitude forest fire plumes deep in the stratosphere, Geophys. Res. Lett., 31, L11101, doi:10.1029/2003GL019253, 2004.
Justice, C. O., Giglio, L., Korontzi, S., Owens, J., Morisette, J., Roy, D., Descloitres, J.,
Al-20
leaume, S., Petitcolin, F., and Kaufman, Y.: The MODIS fire products, Remote Sens. Envi-ron., 83(1–2), 244–262, 2002.
Kalnay, E., Kanamitsu, M., Kistler, R., et al.: The NCEP/NCAR 40-year reanalysis project, B. Am. Meteorol. Soc., 77, 437–471, 1996.
Koppmann, R., Khedim, A., Rudolph, J., Poppe, D., Andreae, M. O., Helas, G., Welling, M., and
25
Zenker, T.: Emissions of organic trace gases from savanna fires in southern African during SAFARI 92 and their impact on the formation of tropospheric ozone, J. Geophys. Res., 102, 18 879–18 888, 1997.
Koppmann, R., Czaplewski, K. V., and Rald, J. S.: A review of biomass burning emissions, part I: gaseous emissions of carbon monoxide, methane, volatile organic compounds, and
30
nitrogen containing compounds, Atmos. Chem. Phys. Discuss., 5, 10 455–10 516, 2005. Langaas, S.: A parameterised bispectral model for savanna fire detection using AVHRR night
ACPD
7, 18145–18177, 2007Modelling the effect of plume-rise on the transport of CO H. Guan et al. Title Page Abstract Introduction Conclusions References Tables Figures ◭ ◮ ◭ ◮ Back Close
Full Screen / Esc
Printer-friendly Version Interactive Discussion
EGU
Lavou ´e, D., Liousse, C., Cachier, H., Stocks, B. J., and Goldammer, J. G.: Modeling of carbona-ceous particles emitted by boreal and temperate wildfires at northern latitudes, J. Geophys. Res., 105, 26 871–26 890, 2000.
Latham, D. J.: PLUMP: A one-dimensional plume predictor and cloud model for fire and smoke managers, Research General Technical Report INT-GTR-314, Intermountain Research
Sta-5
tion, November 1994.
Li, Q., Jiang, J. H., Wu, D. L., Read, W. G., Livesey, N. J., Waters, J. W., Zhang, Y., Wang, B., Filipiak, M. J., Davis, C. P., Turquety, S., Wu, S., Park, R. J., Yantosca, R. M., and Jacob, D. J.: Convective outflow of South Asian pollution: A global CTM simulation compared with EOS MLS observations, J. Geophys. Lett., L14826, doi:10.1029/2005GL022762, 2005.
10
Liousse, C., Penner, J. E., Chuang, C., Walton, J. J., Eddleman, H., and Cachier, H.: A global three-dimensional model study of carbonaceous aerosols, J. Geophys. Lett., 101, 19 411– 19 432, 1996.
Lin, S. J.: A vertically Lagrangian finite-volume dynamical core for global models. Mon. Wea. Rev., 132, 2293–2307, 2004.
15
Luo, M., Rinsland, C. P., Rodgers, C. D., Logan, J. A., Worden, H., Kulawik, S., Eldering, A., Goldman, A., Shephard, M. W., Gunson, M., and Lampel, M.: Comparison of carbon monoxide measurements by TES and MOPITT in the influence of a priori data and instrument characteristics on nadir atmospheric species retrievals, J. Geophys. Res., 112, D09303, doi:10.1029/2006JD007663, 2007.
20
Matichuk, R. I., Colarco, P. R., Smith, J. A., and Toon, O. B.: Modeling the transport and op-tical properties of smoke aerosols from African savanna fires during the Southern African Regional Science Initiative campaign (SAFARI 2000). J. Geophys. Res., 112, D08203, doi:10.1029/2006JD007528, 2007.
Pack, D. W., Rice, C. J., Tressel, B. J., Lee-Wagner, C. J., and Oshika, E. M.: Civilian uses of
25
surveillance satellites, Crosslink, 1(1), 2–8, 2000.
Pan, L., Gille, J. C., Edwards, D. P., Bailey, P. L., and Rodgers, C. D.: Retrieval of tropospheric carbon monoxide for the MOPITT experiment, J. Geophys. Res., 103, 32 277–32 290, 1998. Pans, E. M., Feltz, J. M., Menzel, W. P., and Ward, D. E.: An overview of GEOS-8 diurnal fire
and smoke results for SCAR-B and the 1995 fire season in South America, J. Geophys. Res.,
30
103, 31 821–31 836, 1998.
P ´etron, G., Granier, C., Khattatov, B., Yudin, V., Lamarque, J., Emmons, L., Gille, J., and Edwards, D. P.: Monthly CO surface sources inventory based on the 2000–2001 MOPITT
ACPD
7, 18145–18177, 2007Modelling the effect of plume-rise on the transport of CO H. Guan et al. Title Page Abstract Introduction Conclusions References Tables Figures ◭ ◮ ◭ ◮ Back Close
Full Screen / Esc
Printer-friendly Version Interactive Discussion
EGU
satellite data, Geophys. Res. Lett., 31, L21107, doi:10.1029/2004GL020560, 2004.
Pickering, K. E., Thompson, A. M., Wang, Y., Tao, W.-K., McNamara, D. P., Kirchhoff, J. H., Heikes, B. G., Sachse, G. W., Bradshaw, J. D. , Gregory, G. L., and Blake, D. R.: Convec-tive transport of biomass burning emissions over Brizil during TRACE-A, J. Geophys. Res., 101(D19), 23 993–24 012, 1996.
5
Prins, E. M. and Menzel, W. P.: Geostationary satellite estimation of biomass burning in South America, Int. Jour. of Remote Sensing, 13, 2783–2799, 1992.
Prins, E. M., Feltz, J. M., Menzel, W. P., and Ward,D. E.: An overview of GEOS-8 diurnal fire and smoke results for SCAR-B and the 1995 fire season in South America, J. Geophys. Res., 103, 31 821–31 836, 1998.
10
Rasch, P. J., Coleman, D. B., Mahowald, N., Williamson, D. L., Lin, S.-J., Boville, B. A., and Hess, P.: Characteristics of atmospheric transport using three numerical formulations for atmospheric dynamics in a single GCM framework, J. Climate, 19, 2243–2266, 2006. Richards, N. A. D., Li, Q., Bowman, K. W., Worden, J. R., Kulawik, S. S., Osterman, G. B.,
Worden, H. M., Lamarque, J.-F., and Khattatov, B. V.: Assimilation of TES CO into a global
15
CTM: first results, Atmos. Chem. Phys. Discuss., 6, 11 727–11 743, 2006.
Rosenfeld, D., Fromm, M., Trentmann, J., Luderer, G., Andreae, M. O., and Servranckx, R.: The Chisholm firestorm: observed microstructure, precipitation and lightning activity of a pyro-Cb. Atmos. Chem. Phys. Discuss., 6, 9877–9906, 2007,
http://www.atmos-chem-phys-discuss.net/6/9877/2007/.
20
Sinha, P., Jaegle, L., Hobbs, P. V., and Liang, Q.: Transport of biomass burning emissions from southern Africa, J. Geophys. Res., 109, D20204, doi:10.1029/2004JD005044, 2004.
Staudt, A. C., Jacob, D. J., Logan, J. A., Bachiochi, D., Krishnamurti, T. N., and Sachse, G. W.: Continental sources, transoceanic transport, and interhemispheric exchange of carbon monoxide over the Pacific, J. Geophys. Res., 106, 32 571–32 590, 2001.
25
Swap, R. J., Annegarn, H. J., Suttles, T., King, M. D., Platnick, S., Privette, J. L., and Scholes, R. J.: Africa burning: A thematic analysis of the Southern African Regional Science Initiative (SAFARI 2000), J. Geophys. Res., 108, 8465, doi:10.1029/2003JD003747, 2003.
Turquety, S., Logan, J. A., Jacob, D. J., et al.: Inventory of boreal fire emissions for North America in 2004, Importance of peat burning and pyroconvective injection, J. Geophys. Res.,
30
112, 12S03, doi:10.1029/2006JD007281, 2007.
Wang, J., Christopher, S. A., Nair, U. S., Reid, J. S., Prins, E. M., Szykman, J., and Hand, J. L.: Mesoscale modeling of Central American smoke transport to the United States: 1.
Top-ACPD
7, 18145–18177, 2007Modelling the effect of plume-rise on the transport of CO H. Guan et al. Title Page Abstract Introduction Conclusions References Tables Figures ◭ ◮ ◭ ◮ Back Close
Full Screen / Esc
Printer-friendly Version Interactive Discussion
EGU
down assessment of emission strength and diurnal variation impacts, J. Geophys. Res., 111, D05S17, doi:10.1029/2005JD006416, 2006.
Wang, Y., Tao, W.-K., Pickering, K. E., Thompson, A. M., Adler, R., Simpson, J. Keehn P., and Lai, G.: Mesoscale model (MM5) simulation of TRACE and PRESTORM Convective Systems and Associated Tracer Transport, J. Geophys. Res., 101, 24 013–24 027, 1996.
5
Zhang, G. J. and McFarlane, N. A.: Sensitivity of climate simulations to the parameterization of cumulus convection in the Canadian Climate Centre General Circulation Model. Atmos.-Ocean, 33, 407–446, 1995.
Zhang, L., Jacob, D. J., Bowman, K. W., Logan, J. A., Turquety, S., Hudman, R. C., Li, Q., Beer, R., Worden, H. M., Worden, J. R., Rinsland, C. P., Kulawik, S. S., Lampel, M. C., Shephard,
10
M. W., Fisher, B. M., Eldering, A., and Avery, M. A.: Ozone-CO correlations determined by the TES satellite instrument in continental outflow regions, Geophys. Res. Lett., 33, L18804, doi:10.1029/2006GL026399, 2006.
ACPD
7, 18145–18177, 2007Modelling the effect of plume-rise on the transport of CO H. Guan et al. Title Page Abstract Introduction Conclusions References Tables Figures ◭ ◮ ◭ ◮ Back Close
Full Screen / Esc
Printer-friendly Version Interactive Discussion
EGU Fig. 1. Ground-based station (red star) and aircraft flight tracks for CO measurements (red
ACPD
7, 18145–18177, 2007Modelling the effect of plume-rise on the transport of CO H. Guan et al. Title Page Abstract Introduction Conclusions References Tables Figures ◭ ◮ ◭ ◮ Back Close
Full Screen / Esc
Printer-friendly Version Interactive Discussion
EGU Fig. 2. Mean concentrations (ppb) of CO at 700 hPa observed by MOPITT in 10–12 September
2000 (a) and model values at 696 hPa for the NPR run (b) and PR run (c). White areas are regions not seen by MOPITT during this period.
ACPD
7, 18145–18177, 2007Modelling the effect of plume-rise on the transport of CO H. Guan et al. Title Page Abstract Introduction Conclusions References Tables Figures ◭ ◮ ◭ ◮ Back Close
Full Screen / Esc
Printer-friendly Version Interactive Discussion EGU Figure 1 Fig Figure 3
Fig. 3. Scatter plots of modeled versus MOPITT CO at 700 hPa in 10–12 September 2000
within the Fig. 2 domain for the NPR (a and c) and PR (b and d) runs. The black lines represent a 1:1 correlation. The red lines for a and b are the linear regression for CO data. The red and blue lines for c and d represent the linear regression for higher (≥100 ppb) and lower (<100 ppb) MOPITT CO data, respectively. The Pearson correlation coefficients R, mean biases, and regression equations are indicated.
ACPD
7, 18145–18177, 2007Modelling the effect of plume-rise on the transport of CO H. Guan et al. Title Page Abstract Introduction Conclusions References Tables Figures ◭ ◮ ◭ ◮ Back Close
Full Screen / Esc
Printer-friendly Version Interactive Discussion
EGU Fig. 4. Daily surface concentrations (ppb) of measured (red) and modeled CO (blue) over Cape
ACPD
7, 18145–18177, 2007Modelling the effect of plume-rise on the transport of CO H. Guan et al. Title Page Abstract Introduction Conclusions References Tables Figures ◭ ◮ ◭ ◮ Back Close
Full Screen / Esc
Printer-friendly Version Interactive Discussion
EGU Fig. 5. MISR images of Sun Pan, Botswana (20.53◦S, 26.07◦E) in 18 August (left panel) and 3
ACPD
7, 18145–18177, 2007Modelling the effect of plume-rise on the transport of CO H. Guan et al. Title Page Abstract Introduction Conclusions References Tables Figures ◭ ◮ ◭ ◮ Back Close
Full Screen / Esc
Printer-friendly Version Interactive Discussion EGU
Figur
Figure 6
Fig. 6. CO vertical profiles averaged over 20–24◦S and 24-30◦E for 3 September 2000 from the model (red and blue lines) and South African aircraft measurement (black stars). The 25, 50, and 75 percentiles of the measured CO (ppb) are denoted by the vertical bars. The horizontal lines indicate the measurement ranges. The aircraft measurements are averaged over 500-m height range. The observation numbers in each height range are indicated.
ACPD
7, 18145–18177, 2007Modelling the effect of plume-rise on the transport of CO H. Guan et al. Title Page Abstract Introduction Conclusions References Tables Figures ◭ ◮ ◭ ◮ Back Close
Full Screen / Esc
Printer-friendly Version Interactive Discussion
EGU Fig. 7. CO vertical profiles averaged over 36–42◦
S and 142–148◦
E from the model (red and blue lines) and aircraft measurements near Melbourne, Australia for 5 and 13 September 2000. Black diamonds and stars represent measurements for 5 and 13 September 2000, respectively. The 25, 50, and 75 percentiles of the measured CO (ppb) are denoted by the vertical bars. The horizontal lines indicate the measurement ranges. The aircraft measurements are averaged over 500-m height range.
ACPD
7, 18145–18177, 2007Modelling the effect of plume-rise on the transport of CO H. Guan et al. Title Page Abstract Introduction Conclusions References Tables Figures ◭ ◮ ◭ ◮ Back Close
Full Screen / Esc
Printer-friendly Version Interactive Discussion
EGU Fig. 8. Simulated CO concentrations for (a) the NPR run and (b) the PR run at 696 hPa in 13
September 2000. 3-day (10–12 September 2000) averaged streamlines in white are superim-posed. The red and blue reference lines, used in Figs. 9 and 10, are drawn. Thick black line is the 300 ppb contour.
ACPD
7, 18145–18177, 2007Modelling the effect of plume-rise on the transport of CO H. Guan et al. Title Page Abstract Introduction Conclusions References Tables Figures ◭ ◮ ◭ ◮ Back Close
Full Screen / Esc
Printer-friendly Version Interactive Discussion
EGU Fig. 9. Vertical cross sections of CO (ppb) along the red reference lines in Fig. 8 for the
NPR run (a), PR run (b), and the concentration difference between PR and NPR runs (c). (d) Corresponding CO emission rate (kg s−1). White areas indicate topography.
ACPD
7, 18145–18177, 2007Modelling the effect of plume-rise on the transport of CO H. Guan et al. Title Page Abstract Introduction Conclusions References Tables Figures ◭ ◮ ◭ ◮ Back Close
Full Screen / Esc
Printer-friendly Version Interactive Discussion
EGU Fig. 10. Vertical cross sections of eastward CO flux (kg s−1) over each latitude-altitude grid
along the blue reference lines in Fig. 8 for the NPR run (a), PR run (b), and the corresponding difference between the PR and NPR runs (c).
ACPD
7, 18145–18177, 2007Modelling the effect of plume-rise on the transport of CO H. Guan et al. Title Page Abstract Introduction Conclusions References Tables Figures ◭ ◮ ◭ ◮ Back Close
Full Screen / Esc
Printer-friendly Version Interactive Discussion
EGU Fig. 11. Simulated CO concentrations for (a) the NPR run and (b) the PR run at 510 hPa in
5 September 2000. 3-day (3–5 September 2000) averaged streamlines in white are superim-posed. The blue reference lines, used in Fig. 12, are drawn.
ACPD
7, 18145–18177, 2007Modelling the effect of plume-rise on the transport of CO H. Guan et al. Title Page Abstract Introduction Conclusions References Tables Figures ◭ ◮ ◭ ◮ Back Close
Full Screen / Esc
Printer-friendly Version Interactive Discussion
EGU Fig. 12. Vertical cross sections of eastward CO flux (kg s−1) over each latitude-altitude grid
along the blue reference lines in Fig. 11 for the NPR run (a), PR run (b), and the corresponding difference between the PR and NPR runs (c).