Cytosolic Aspartate Availability Determines
Cell Survival When Glutamine Is Limiting
The MIT Faculty has made this article openly available.
Please share
how this access benefits you. Your story matters.
Citation
Alkan, H. Furkan et al. “Cytosolic Aspartate Availability Determines
Cell Survival When Glutamine Is Limiting.” Cell Metabolism 28
(2018): 706-720 © 2018 The Author(s)
As Published
10.1016/j.cmet.2018.07.021
Publisher
Elsevier BV
Version
Author's final manuscript
Citable link
https://hdl.handle.net/1721.1/124929
Terms of Use
Creative Commons Attribution-NonCommercial-NoDerivs License
Cytosolic Aspartate Availability Determines Cell Survival When
Glutamine Is Limiting
H. Furkan Alkan1,2, Katharina E. Walter1, Alba Luengo2, Corina T. Madreiter-Sokolowski3, Sarah Stryeck3, Allison N. Lau2, Wael Al-Zoughbi4, Caroline A. Lewis5, Craig J. Thomas6,7, Gerald Hoefler4,8, Wolfgang F. Graier3,8, Tobias Madl3,8, Matthew G. Vander Heiden2,9,*, and Juliane G. Bogner-Strauss1,8,10,*
1Institute of Biochemistry, Graz University of Technology, Humboldtstrasse 46/III, 8010 Graz,
Austria
2The Koch Institute for Integrative Cancer Research and Department of Biology, Massachusetts
Institute of Technology, Cambridge, MA 02139, USA
3Gottfried Schatz Research Center, Molecular Biology and Biochemistry, Medical University of
Graz, Neue Stiftingtalstrasse 6/6, A-8010 Graz, Austria
4Diagnostic and Research Institute of Pathology, Medical University of Graz, Neue
Stiftingtalstraße 6, A-8010 Graz, Austria
5Whitehead Institute for Biomedical Research, 455 Main Street, Cambridge, MA 02142, USA 6Division of Preclinical Innovation, National Center for Advancing Translational Sciences, National
Institutes of Health, Bethesda, MD 20892, USA
7Lymphoid Malignancies Branch, National Cancer Institute, Bethesda, MD 20892, USA 8BioTechMed-Graz, Graz, Austria
9Dana-Farber Cancer Institute, Boston, MA 02115, USA
Summary
Mitochondrial function is important for aspartate biosynthesis in proliferating cells. Here, we show that mitochondrial aspartate export via the aspartate-glutamate carrier 1 (AGC1) supports cell proliferation and cellular redox homeostasis. Insufficient cytosolic aspartate delivery leads to cell death when TCA cycle carbon is reduced following glutamine withdrawal and/or glutaminase
*Correspondence: [email protected] (M.G.V.H.), [email protected] (J.G.B.-S.). 10Lead Contact
Author Contributions
H.F.A. designed and performed the majority of the experiments. K.E.W. and A.L. assisted with some in vitro and in vivo experiments, respectively. C.T.M.-S. and W.F.G. determined oxygen consumption. S.S. and T.M. performed NMR measurements and data analysis. A.N.L. assisted with flow cytometry experiments and generated the AL1376 cell line. W.A.-Z. and G.H. assessed
immunohistochemistry slides. C.A.L. performed liquid chromatography-mass spectrometry measurements. C.J.T. supplied critical reagents. H.F.A. and J.G.B.-S. constructed the study and M.G.V.H. provided substantial guidance and shared lab space and equipment. H.F.A., M.G.V.H., and J.G.B.-S. wrote the manuscript.
Declaration of Interests
Author Manuscript
Cell Metab. Author manuscript; available in PMC 2019 February 26.
Published in final edited form as:
Cell Metab. 2018 November 06; 28(5): 706–720.e6. doi:10.1016/j.cmet.2018.07.021.
Europe PMC Funders Author Manuscripts
inhibition. Moreover, loss of AGC1 reduces allograft tumor growth that is further compromised by treatment with the glutaminase inhibitor CB-839. Together, these findings argue that mitochondrial aspartate export sustains cell survival in low-glutamine environments and AGC1 inhibition can synergize with glutaminase inhibition to limit tumor growth.
Introduction
Proliferation increases the energetic and biosynthetic needs of cells. To meet these demands, proliferating cells alter their metabolism and utilize nutrients differently than
non-proliferating cells (Vander Heiden and DeBerardinis, 2017; Cantor and Sabatini, 2012; Warburg, 1956). In culture, most proliferating cells depend on two main carbon sources: glucose and glutamine (Hosios et al., 2016). Although oxidative glucose catabolism is energetically the most efficient means to produce ATP, proliferating cells often exhibit increased lactate production—also known as aerobic glycolysis (Cantor and Sabatini, 2012; Vander Heiden et al., 2009). In addition, glutamine is a primary anaplerotic tricarboxylic acid (TCA) cycle substrate for many cells, making those cells vulnerable to glutamine withdrawal or glutaminase inhibition by drugs such as CB-839 (Gross et al., 2014; Yuneva et al., 2007).
Despite prominent lactate production, mitochondrial function remains important for
proliferating cells (DeBerardinis and Chandel, 2016). Mitochondrial one-carbon metabolism is strongly upregulated in many cancer types to maintain purine and thymidine biosynthesis (Vyas et al., 2016; Zong et al., 2016). Initiating de novo lipogenesis in mitochondria through citrate production is also vital for proliferation in some contexts (Catalina-Rodriguez et al., 2012; Jiang et al., 2017). Another important role for mitochondrial respiration in
proliferating cells is to support aspartate production, as aspartate is essential to make protein as well as for purine and pyrimidine biosynthesis (Birsoy et al., 2015; Gui et al., 2016; Sullivan et al., 2015). Because of these biosynthetic roles of mitochondria, movement of macromolecule precursors across the mitochondrial membranes might also become a limitation for tumor growth. For instance, blocking the mitochondrial citrate transporter impairs de novo lipogenesis and inhibits cell proliferation in some contexts (Catalina-Rodriguez et al., 2012). In addition, transferring electrons between the cytosolic and mitochondrial compartments may also be important because accumulation of reducing equivalents in either compartment could cause proliferation defects. For instance, inhibiting mitochondrial electron transport leads to NADH accumulation in mitochondria, which hampers oxidation reactions, impairs aspartate synthesis, and slows proliferation (Sullivan et al., 2015). Regenerating cytosolic NAD+ is also vital for glycolysis and the biosynthesis of certain amino acids and nucleotides (Lunt and Vander Heiden, 2011). Therefore,
understanding the role of mitochondrial transporters in proliferating cells could not only provide insight into cancer metabolism, but also suggest novel cancer drug targets. The malate-aspartate shuttle (MAS) is important for transferring electrons from cytosolic NADH to the mitochondria, where they can be transferred to oxygen via the electron transport chain (Greenhouse and Lehninger, 1976). Exchange of mitochondrial aspartate for cytosolic glutamate and a proton by the aspartate-glutamate carrier (AGC) is proposed to be
Europe PMC Funders Author Manuscripts
the only irreversible step of the MAS (del Arco et al., 2002). Both AGC isoforms are predicted to be functionally identical (Thangaratnarajah et al., 2014), yet many tissues selectively express one isoform: AGC1 (SLC25A12, Aralar) is abundant in brain, skeletal muscle, and pancreatic beta cells, while AGC2 (SLC25A13, Citrin) is primarily found in liver and kidney (Begum et al., 2002; Palmieri et al., 2001). Previous studies have shown that AGC1 is involved in neuronal development, supports aspartate and N-acetylaspartate production, and reduces lactate secretion (Jalil et al., 2005; Rubi et al., 2004).
Although MAS activity in tumors has been reported (Greenhouse and Lehninger, 1976) and the expression of AGCs in cancer has been predicted (Amoedo et al., 2016), the functional importance of mitochondrial aspartate-glutamate transport in proliferating cells has not been extensively studied. Here, we show that AGC1 knockdown (KD) slows cell proliferation, reduces the cellular NAD+/NADH ratio, and impairs aspartate delivery to the cytosol. We also show that mitochondrial aspartate export is essential for cell survival in glutamine-limited conditions, and that loss of AGC1 can synergize with glutaminase inhibitors to suppress tumor growth. These findings argue that sustaining cytosolic aspartate levels is required for cell survival in low-glutamine environments and suggest that AGC1 might be a target to treat some cancers.
Results
Knockdown of AGC1 Reduces Proliferation Due to Impaired Aspartate Synthesis
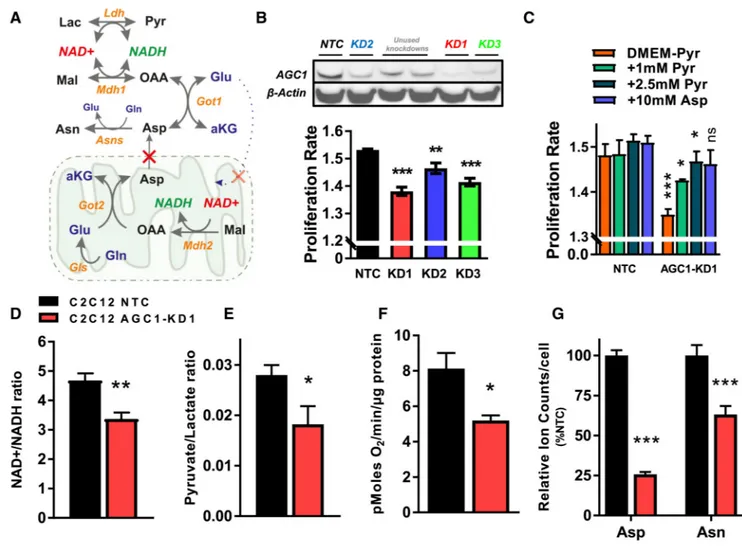
AGC1 exports aspartate produced in mitochondria to the cytosol, where it can be used for nucleotide, amino acid, and protein synthesis. In addition, mitochondrial aspartate export can contribute to cytosolic redox homeostasis by serving as a substrate for cytosolic glutamate-oxaloacetate transaminase (Got1, producing oxaloacetate from aspartate) and malate dehydrogenase (Mdh1, reducing oxaloacetate to malate while oxidizing NADH) as part of the MAS (Figures 1A and S1A). mRNA expression analysis suggests that
proliferating cells in culture display robust expression of MAS components (Figure S1B). To test whether AGC1 is important for cell proliferation, we used short hairpin RNA (shRNA) to knock down AGC1 in non-transformed mouse C2C12 myoblasts because AGC1 levels in these cells are about 8-fold higher than AGC2 levels (Figure S1B). We observed that AGC1-KD leads to a slight, yet significant, proliferation rate reduction when cells are cultured in standard DMEM containing 1 mM pyruvate (Figure 1B). Because extracellular pyruvate can act as an electron acceptor to provide oxidized NAD+ to cells (Figure 1A), we excluded pyruvate from the media for subsequent experiments unless otherwise indicated. The effect of AGC1-KD on cell proliferation becomes more apparent following pyruvate withdrawal, and this change is rescued by pyruvate or aspartate supplementation (Figure 1C), as reported previously for cells with mitochondrial dysfunction (Birsoy et al., 2015; Sullivan et al., 2015). Interestingly, however, AGC1-KD cells remain viable and retain the ability to proliferate slowly in pyruvate-free media (Figure 1C).
Disruption of the MAS is expected to decrease the NAD+/NADH ratio in the cytosol and increase the NAD+/NADH ratio in the mitochondria (del Arco et al., 2002). Indeed, the whole-cell NAD+/NADH ratio is lower in AGC1-KD cells compared to non-targeting
Europe PMC Funders Author Manuscripts
control (NTC) cells, hereafter referred to as control cells (Figure 1D). In addition, because the lactate dehydrogenase reaction is coupled to cytosolic NAD+/NADH, the pyruvate/ lactate ratio is sometimes used as a proxy for this ratio (Christensen et al., 2014; Williamson et al., 1967), and indeed AGC1-KD cells have a lower pyruvate/lactate ratio (Figure 1E). Basal oxygen consumption rate is also lower in AGC1-KD cells (Figure 1F), a finding that is consistent with the expected increase in mitochondrial NAD+/NADH ratio. To determine whether AGC1-KD leads to similar phenotypes in transformed cells, we examined mouse Lewis lung carcinoma (LLC1) cells. As observed in C2C12 cells, AGC1-KD LLC1 cells proliferate slower than control LLC1 cells and have reduced NAD+/NADH and pyruvate/ lactate ratios (Figures S1C–S1E).
The low NAD+/NADH ratio of AGC1-KD cells is accompanied by reduced aspartate levels in both C2C12 and LLC1 cells (Figures 1G and S1F). To assess whether cytosolic aspartate is changed, we examined how AGC1-KD affects asparagine levels, an amino acid that is not present in the culture media, because the conversion of aspartate to asparagine is mediated by the cytosolic enzyme asparagine synthetase (Asns) (Ahn and Metallo, 2015). KD of AGC1 leads to reduced asparagine levels, indicative of lower cytosolic aspartate levels in these cells (Figures 1G and S1F).
We also tested the effects of increased AGC1 expression and found that overexpression of mouse AGC1 promotes C2C12 cell proliferation (Figure S1G). Increased expression of mouse AGC1 elevates whole-cell NAD+/NADH ratio and aspartate levels, the opposite of what was observed following AGC1 KD using three independent shRNAs (Figures S1H– S1J). Furthermore, expression of human AGC1 that is resistant to KD rescues the proliferation defect observed in AGC1-KD C2C12 cells (Figure S1K).
AGC1-KD Increases Cellular Dependence on Glutamine
We hypothesized that AGC1-deficient cells maintain proliferation by rewiring metabolism to obtain cytosolic aspartate from a different source. To test this hypothesis, we individually removed glucose or select amino acids from the media and assessed whether these interventions further affected cell proliferation upon AGC1 KD. We found that culturing cells in low glucose (0.5 mM, instead of 25 mM contained in regular DMEM) or with the glycolysis inhibitor 2-deoxyglucose (2-DG) does not affect proliferation or survival of AGC1-KD cells more than control cells (Figure 2A). However, survival of AGC1-KD cells was compromised more than control cells in Hank’s Buffered Salt Solution (HBSS) that contains 5.5 mM glucose but lacks amino acids (Figure 2B). Addition of essential amino acids did not rescue this phenotype, but addition of essential amino acids and glutamine to HBSS was able to rescue AGC1-KD cell proliferation to the same degree as control cells (Figure 2B). To further explore whether AGC1-KD alters dependence on glutamine, we cultured cells in DMEM-based low-glutamine media (0.1 mM instead of 4 mM). In line with previous studies (Wise and Thompson, 2010), low glutamine impairs cell proliferation, but in contrast to control cells, AGC1-KD cell survival is compromised in low-glutamine conditions (Figure 2C). Glutamine depletion (0.1 mM) significantly increased the percent of dead and apoptotic cells as measured by Annexin V/promidium iodide (PI) staining in both control and AGC1-KD cells (Figure S1L). Interestingly, AGC1-KD also induced cell death
Europe PMC Funders Author Manuscripts
in glutamine-replete media that is further exacerbated by glutamine starvation (Figure S1L). Furthermore, cleaved caspase 3 levels, a marker of apoptotic cells, were increased in low-glutamine conditions, suggesting that low-glutamine starvation promotes cell death in AGC1-KD cells (Figure S1M).
Glutamine has several fates in cells: it can serve as an exchange factor for import of other amino acids (Pochini et al., 2014), it provides nitrogen for nucleotide biosynthesis (Cory and Cory, 2006), or it can be converted to α-ketoglutarate (α-KG, also known as 2-oxoglutarate) via glutamate to provide carbon for TCA cycle intermediates (anaplerosis) (Wise and Thompson, 2010) (Figure 2D). To narrow down which fate of glutamine is important for proliferation and viability of AGC1-KD cells, we used the glutaminase inhibitor CB-839 to limit glutamine to glutamate conversion. CB-839 treatment phenocopies the effects of culture in low glutamine on AGC1-KD cells (Figure 2C). These data argue that AGC1-KD cells require glutamine anaplerosis for survival, rather than for other downstream reactions that do not require glutaminase activity.
We next hypothesized that the increased vulnerability of AGC1-KD cells to glutaminase inhibition could be due to an inability to oxidize glucose. To test this, we treated C2C12 cells for 6 hr with CB-839 and measured oxygen consumption. Interestingly, CB-839 treatment reduces mitochondrial oxygen consumption by 50% in both AGC1-KD and control cells, arguing that AGC1-KD cells do not require more glutamine for mitochondrial respiration than control cells (Figure 3A). In addition, there is also no difference in the uptake or consumption rate of glucose and glutamine except that AGC1-KD C2C12 cells show slightly elevated glutamate release (Figures 3B, 3C, and S2A–S2C). Of note, only a small fraction of the consumed glutamine could be accounted for by glutamate excretion in either group, suggesting that the elevated glutamate excretion could be a consequence of an increased cytosolic glutamate pool in AGC1-KD cells and is not the cause of glutamine dependency. Consistent with this interpretation, exposure to Erastin, which inhibits activity of the plasma membrane glutamate exporter xCT (Slc7a11) (Dixon et al., 2014), has no specific impact on glutaminase-inhibited AGC1-KD cells (Figures S2D and S2E).
Hypoxia and mitochondrial dysfunction both alter the cell NAD+/NADH ratio and promote reductive glutamine metabolism (Metallo et al., 2011; Mullen et al., 2011, 2014; Sullivan et al., 2015). To determine whether AGC1-KD cells metabolize nutrients differently, we traced [U13C]glucose or [U13C]glutamine fates using gas chromatography-mass spectrometry (GC-MS). We did not observe a major change in labeling from either nutrient such that glutamine remains the predominant source of aspartate and other TCA intermediates, and the relative contribution of glucose and glutamine to the TCA cycle is not drastically altered in AGC1-KD cells (Figures S2F and S2G). However, in alignment with a high mitochondrial NAD+/ NADH ratio, AGC1-KD C2C12 cells display decreased M+3 aspartate and M+5 citrate from labeled glutamine, consistent with decreased reductive α-KG carboxylation (Figures 3D and 3E). Moreover, at steady state, M+3 species of glutamate and α-KG are increased while M +5 species are decreased in AGC1-KD C2C12 cells without any major differences observed in unlabeled (M+0) species (Figures 3F and 3G). These labeling patterns are consistent with a higher mitochondrial NAD+/NADH ratio promoting increased oxidative TCA cycling (Figure 3H). Also consistent with this interpretation, AGC1-KD C2C12 cells release more
Europe PMC Funders Author Manuscripts
14C-CO
2 from [U14C]glutamine (Figures 3H and 3I). Interestingly, we did not observe the same decrease in reductive carboxylation in LLC1 cells with AGC1 KD (Figure S2G), suggesting that changes in reductive carboxylation are not why AGC-KD cells require glutamine. Together, these findings argue that, although changes are observed in the metabolism of AGC1-KD cells (Figures S2H–S2M), glutamine utilization is not drastically altered in AGC1-KD cells, and glutamine remains the major precursor for aspartate independent of AGC1 expression (Figures S2F and S2G).
AGC1-KD Cells Are Unable to Sustain Cytosolic Aspartate Levels, Leading to Cell Death upon Glutamine Deprivation
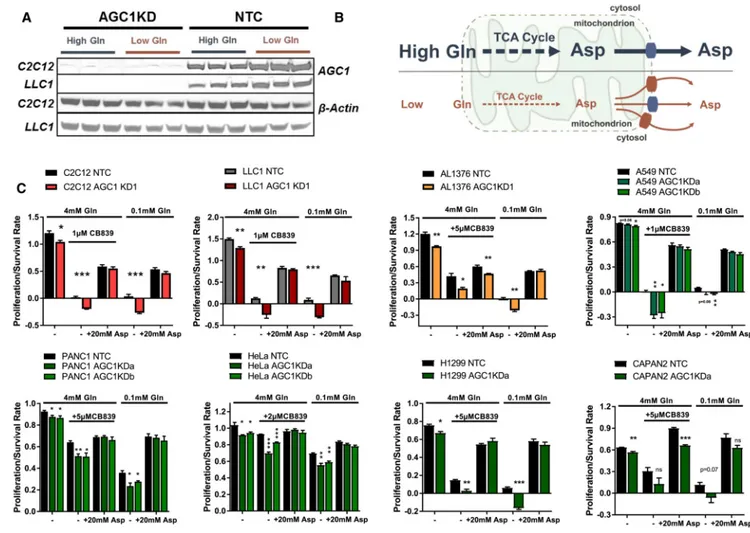
Because cytosolic aspartate production is essential for survival of cells with mitochondrial dysfunction (Birsoy et al., 2015), we hypothesized that aspartate export from mitochondria might be important to survive glutamine limitation. In fact, AGC1 protein expression is higher following glutamine deprivation, suggesting a higher demand for mitochondrial aspartate export in such conditions (Figure 4A). We reasoned that glutamine withdrawal might deplete mitochondrial aspartate levels such that other mitochondrial transporters cannot export it efficiently (Figure 4B). To test whether cytosolic aspartate delivery can be limiting for AGC1-KD cells in low glutamine, we provided cells with exogenous aspartate and found that aspartate supplementation in low-glutamine media rescues AGC1-KD cell viability and proliferation (Figures S3A and 4C). Because aspartate is poorly permeable, non-physiological aspartate concentrations (5–20 mM) are needed to deliver aspartate into the cells (Sullivan et. al., 2018). However, after expressing the aspartate transporter
(SLC1A3), 150 μM aspartate was sufficient to rescue proliferation/survival in low-glutamine conditions (Figure S3B), arguing that cytosolic aspartate delivery can be limiting for AGC1-KD cells.
A requirement for glutamine in cells with AGC1 loss was observed in other cell lines, as was the ability of aspartate to rescue AGC1 loss, despite the fact that the cell lines showed varying responses to glutamine deprivation and glutaminase inhibition (Figure 4C). In addition, CRISPR/Cas9-mediated knockout of AGC1 leads to comparable sensitivity to perturbations that limit glutamine metabolism in C2C12 cells (Figure S3C). Interestingly, total ablation of AGC1 also did not completely block proliferation in glutamine-replete media, suggesting that some cytosolic aspartate delivery is sustained by AGC2 or other mitochondrial transporters when glutamine is present. Of note, glutamate supplementation failed to completely rescue AGC1-KD cells in low-glutamine conditions, suggesting that reduced mitochondrial glutamate uptake may be one factor exacerbating the dependence of AGC1-KD cells on glutamine anaplerosis (Figures S3D and S3E).
AGC1-KD Cells Require High Mitochondrial Aspartate Levels to Maintain Aspartate Export
We next hypothesized that AGC1-deficient cells require high mitochondrial aspartate levels to maintain sufficient aspartate delivery to the cytosol. Therefore, we examined whether AGC1-KD cells are vulnerable to other perturbations that deplete mitochondrial aspartate. Metformin blocks mitochondrial aspartate production by inhibiting mitochondrial complex I and consequently disrupting the NAD+/NADH ratio (Sullivan et al., 2015) (Figure 5A), and AGC1-KD cells are more sensitive to metformin treatment than control cells (Figure 5B).
Europe PMC Funders Author Manuscripts
Furthermore, other anaplerotic carbon sources might support mitochondrial aspartate production (Figure 5A), and both daKG and pyruvate supplementation improve
proliferation/survival of AGC1-KD cells in glutamine limitation (Figure 5C) and increase aspartate levels (Figures 5D and S4A–S4D). These findings suggest that limiting glutamine anaplerosis for aspartate production decreases mitochondrial and cytosolic aspartate levels and inhibits cell proliferation. In AGC1-KD cells, however, the inability to export residual aspartate from mitochondria further reduces cytosolic aspartate and compromises cell proliferation and cell survival (Figure 5E).
Cytosolic Aspartate Is Essential for Nucleotide Biosynthesis, but Not for Non-essential Amino Acids or the TCA Cycle
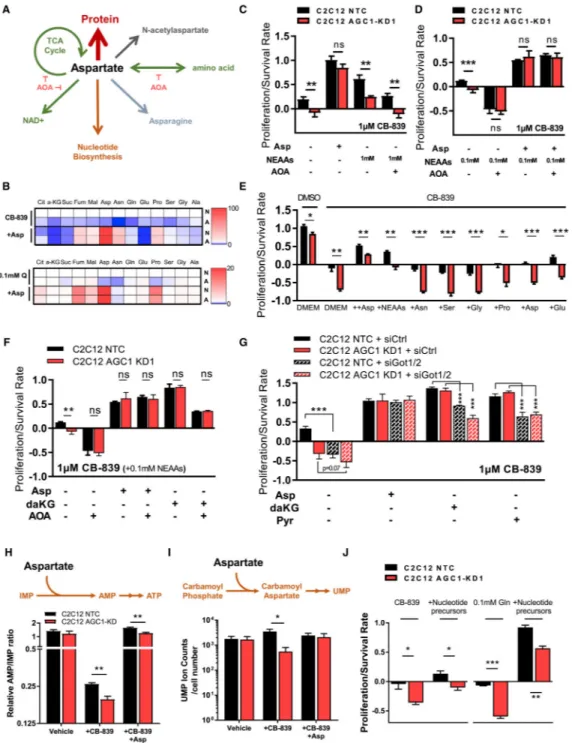
Aspartate is a proteinogenic amino acid that is also involved in several metabolic pathways beyond its use for protein synthesis, some of which have been reported to be associated with cell proliferation (Birsoy et al., 2015; Krall et al., 2016; Sullivan et al., 2015; Zand et al., 2016) (Figure 6A). Cytosolic aspartate could undergo transamination to support non-essential amino acid (NEAA) synthesis, deliver four carbon units to mitochondria for use in the TCA cycle, or recycle NAD+ through the cytosolic part of the MAS. In addition to fates involving transamination, aspartate can accept an amide nitrogen from glutamine for asparagine biosynthesis, is essential for both purine and pyrimidine biosynthesis, and is acetylated to produce N-acetylaspartate (NAA), a brain metabolite that may have roles outside of the central nervous system (Figure 6A). Although NAA was recently reported to have beneficial effects on survival of some cancer cells (Bogner-Strauss, 2017; Lou et al., 2016; Zand et al., 2016), we failed to detect endogenous NAA in either C2C12 or LLC1 cells, suggesting that production of NAA cannot explain why cytosolic aspartate is a limitation for the cells studied here (Figures S5A and S5B).
To explore the role of cytosolic aspartate in NEAA synthesis, we first checked mRNA expression of enzymes involved in amino acid metabolism in low-glutamine conditions. Glutamine starvation (0.1 mM) alters expression of many transaminases regulated by activating transcription factor 4 (Atf4), a component of the amino acid starvation response (Chen et al., 2014) (Figure S5C). Interestingly, the expression of genes encoding enzymes that would use aspartate in the cytosol (Got1 and Asns), but not in the mitochondria (Got2), is upregulated in low-glutamine conditions (Figure S5C). Other cytosolic transaminase isoforms are also upregulated, while mitochondrial isoforms of the same transaminases remain unchanged or are downregulated (Figure S5C). This suggests that cytosolic transamination could be more important following glutamine limitation. In fact, levels of NEAAs (except for serine and glycine that are present in DMEM) are reduced upon CB-839 treatment or in low glutamine (Figure S4A) and are lower in AGC1-KD cells compared to control cells, which is partially rescued by aspartate supplementation (Figure 6B). However, because transamination reactions are highly reversible and the transfer of nitrogen between amino acids is not uni-directional (Wiechert, 2007), NEAAs might also be consumed to make aspartate when aspartate levels drop upon glutamine withdrawal.
To test whether aspartate or other NEAAs are necessary to rescue cells in glutamine
limitation, we provided cells with either a mixture of NEAAs or aspartate, in the presence or
Europe PMC Funders Author Manuscripts
absence of the transaminase inhibitor aminooxyacetate (AOA) (Figure S5D). Similar to aspartate, high levels of NEAAs rescue AGC1-KD cells following glutaminase inhibition; however, this rescue is blunted by AOA, suggesting that NEAA rescue of glutaminase inhibition requires transamination (Figures 6C, 6D, S5E, and S5F). Of note, a 0.1 mM mixture of NEAAs was included when cells were treated with AOA as transaminase activity is needed to produce other NEAAs, and complete loss of NEAAs might impact
proliferation/survival even when glutamine is not limiting (Figures 6D, S5E, and S5F). Notably, none of the amino acids, including asparagine, can rescue glutaminase inhibition individually, except for a partial rescue by glutamate, which is itself the product of
glutaminase (Figures 6E and S5G). On the other hand, AOA treatment reduces the survival of control cells to the level of AGC1-KD cells upon CB-839 treatment (Figures 6D, S5E, and S5F). Importantly, AOA treatment did not affect proliferation/survival of cells rescued with aspartate, arguing that aspartate does not require transamination to rescue glutamine limitation. These data suggest that aspartate is an essential end product of transamination reactions and is not particularly limiting for NEAA synthesis when glutamine anaplerosis is inhibited.
The finding that aspartate rescues proliferation/survival in the presence of AOA argues that aspartate contribution to the TCA cycle or to cytosolic NAD+ regeneration is not essential to rescue proliferation/survival when glutamine is limiting, as these aspartate functions involve transamination reactions (Figure S5D). Similar to NEAAs, neither daKG nor pyruvate can completely rescue glutamine limitation when aspartate aminotransferases are inhibited using AOA or small interfering RNA (siRNA) (Figures 6F, 6G, S5E, and S5F), suggesting that conversion of aspartate to oxaloacetate by transamination reactions either to regenerate cytosolic NAD+ or to donate nitrogen is not limiting in AGC1-KD cells upon glutamine deprivation. These data also argue that a major role of TCA cycle anaplerosis is to produce aspartate. However, it is important to note that these findings do not argue that aspartate does not undergo transamination and/or fuel the TCA cycle, but only suggest that these pathways are not limiting in low-glutamine conditions. In fact, we observed that [U13C] aspartate is incorporated into TCA cycle intermediates in low-glutamine conditions (Figure S5H). Similarly, aspartate supplementation modestly increases some TCA cycle intermediates (Figure 6B), although these changes are inconsistent across different cell lines (Figures S4C and S4D). Notably, [U13C]glutamate labels TCA cycle intermediates more than
[U13C]aspartate (Figure S5I), suggesting that even when transaminases are active, glutamate is a better TCA cycle fuel than aspartate (Figures S5H and S5I).
Another downstream fate of cytosolic aspartate that is not blocked by AOA is the synthesis of asparagine. Asparagine availability can affect cell survival following glutamine
deprivation (Zhang et al., 2014), and intracellular asparagine acts as an exchange factor to import other extracellular amino acids when glutamine metabolism is compromised (Krall et al., 2016). Levels of asparagine are also reduced in AGC1-KD cells upon glutamine
starvation, and these levels are partially recovered by aspartate supplementation (Figure 6B). However, asparagine supplementation, even at concentrations up to 10 mM, failed to rescue CB-839-treated AGC1-KD cells (Figures 6E and S5G), indicating that asparagine
production by itself is not limiting for AGC1-KD cell survival following CB-839 treatment.
Europe PMC Funders Author Manuscripts
Aspartate is required for proliferation partly because it supports nucleotide biosynthesis (Sullivan et al., 2015). Glutaminase inhibition suppresses pyrimidine biosynthesis in Von Hippel-Lindau (VHL)-deficient renal tumors (Okazaki et al., 2017), suggesting that these perturbations might converge on nucleotide metabolism. When aspartate is used for purine biosynthesis, fumarate is generated as a byproduct (Lane and Fan, 2015). We considered that this may account for a greater increase in fumarate levels compared to other TCA cycle intermediates after aspartate supplementation (Figure 6B). To test whether glutaminase inhibition affects nucleotide biosynthesis, we traced [15N-(amide)]glutamine into
nucleotides following CB-839 treatment. Because aspartate donates its nitrogen to IMP for AMP production, AMP synthesis from IMP could be impaired when cytosolic aspartate is limiting (Figure S5J). Consistent with this, the relative AMP/IMP ratio is lower upon CB-839 treatment and is rescued by aspartate supplementation (Figure 6H), arguing that aspartate depletion slows nucleotide biosynthesis. Similarly, intracellular UMP levels are also lower in AGC1-KD cells upon CB-839 treatment compared to controls, suggesting that pyrimidine synthesis is also affected by decreased cytosolic aspartate delivery (Figure 6I). To test whether nucleotides were indeed limiting for AGC1-KD cells, we supplemented AGC1-KD and control cells with thymine, uridine, hypoxanthine, adenine, and guanine. These nucleotide bases improved AGC1-KD cell proliferation/survival in low-glutamine conditions or following glutaminase inhibition (Figures 6J and S5K), although this rescue was less prominent than that observed with aspartate. These data suggest that nucleotide biosynthesis is one limitation caused by decreased cytosolic aspartate delivery.
AGC1 Knockdown Limits Tumor Growth and Sensitizes Tumors to CB-839 Treatment
We next examined whether AGC1 KD would affect tumor growth in vivo. We injected LLC1 cells with or without AGC1-KD into syngeneic C57BL/6 mice and monitored tumor
progression. KD of AGC1 slowed tumor growth over the course of 16 days (Figures S6A and S6B).
CB-839 is ineffective in limiting tumor growth in some cancer models in vivo even when the cells derived from those tumors are sensitive to CB-839 in culture (Biancur et al., 2017; Davidson et al., 2016). To test whether AGC1-KD sensitizes tumors to CB-839 in vivo, we exposed mice with control and AGC1-KD LLC1 tumors to CB-839. CB-839 treatment further reduced the growth of AGC1-KD LLC1 tumors (Figures 7A and S6C) while having a minor effect on control tumors, despite causing comparable drops in glutamate/glutamine ratio in both (Figure 7B). Similar to in vitro culture, pyruvate/lactate ratio was lower in AGC1-KD tumors, highlighting that loss of AGC1 also affects the redox state of cells in vivo (Figure 7C). Interestingly, asparagine levels were increased in CB-839 treated tumors, yet were lower in AGC1-KD tumors compared to controls (Figures 7D and S6D). These findings are consistent with mitochondrial aspartate export being important in tumors when glutaminase is inhibited and consistent with an inability to maintain cytosolic aspartate levels, slowing the growth of AGC1-KD tumors upon CB-839 treatment. These findings also argue that AGC1-KD increases tumor vulnerability to glutaminase inhibition.
To test whether AGC1-KD would have similar effects on another cancer type, we allografted AL1376 pancreatic ductal adenocarcinoma cells that were derived from the LSL-KrasG12D,
Europe PMC Funders Author Manuscripts
p53flox/flox, Pdx1-Cre mouse model (Bardeesy et al., 2006). Consistently, AGC1-KD significantly impaired tumor growth (Figure S6E). In addition, unlike LLC1, AL1376 tumors were completely resistant to CB-839 treatment, yet AGC1-KD promoted CB-839 sensitivity (Figures S6E and S6F). These data suggest that targeting AGC1 may synergize with the glutaminase inhibitors to limit the growth of some tumors.
Because AGC1-KD impaired in vivo growth of mouse lung and pancreas cancer cell lines, we checked whether autochthonous tumors also express AGC1 protein. Although AGC1 protein levels are not increased in either KrasG12D, p53−/− mouse lung (Davidson et al., 2016) or pancreatic (Mayers et al., 2014) tumors that are resistant to CB-839 compared to corresponding healthy tissues, both tumor types had abundant AGC1 expression (Figure S7C). To explore the relevance of our findings in human cancer, we investigated AGC1 expression in several human solid tumors using immunohistochemistry with an antibody against AGC1. AGC1 is expressed in glioblastoma, as well as adenocarcinoma of ovary and pancreas (Figures S7A and S7B). While pancreatic ductal carcinoma (PDAC) cells have heterogeneous AGC1 expression, all healthy pancreatic duct cells are AGC1 negative, suggesting that AGC1 might be upregulated during tumorigenesis in this cancer type (Figure S7B). These observations argue that AGC1 could be a target to treat human cancers.
Discussion
These findings argue that glutamine anaplerosis is important to produce aspartate, and that decreased cytosolic aspartate levels can lead to cell death. These findings are consistent with recent data showing AGC1-deficient neuroblastoma cells proliferate slower in
low-glutamine media (Profilo et al., 2017). From a mechanistic standpoint, it appears that one function of AGC1 is to sustain proliferation/survival of glutamine-deprived cells by providing aspartate to the cytosol. While aspartate may become limiting for nucleotide biosynthesis following glutamine depletion, different aspartate fates could be more limiting in other circumstances. It is important to note that if one fate of aspartate is rescued, more aspartate will be available for other pathways, making it difficult to definitively conclude that nucleotide synthesis is the only critical fate of aspartate, particularly when levels of other NEAAs or TCA cycle intermediates are indirectly affected when cytosolic aspartate is depleted. It is also impossible to rescue aspartate use for protein synthesis in the same way that aspartate use for nucleotides can be rescued by providing exogenous bases, and a role in protein synthesis may be equally important even in the cells examined in this study.
Furthermore, AGC2 is structurally and functionally similar to AGC1 (Thangaratnarajah et al., 2014) and expressed at different levels in various tissues (Begum et al., 2002). Therefore, AGC2 depletion could be more harmful for some cell types than AGC1 depletion, and complete loss of both isoforms could cause more severe limitations to impair cell survival, perhaps even under glutamine-replete conditions.
Glutamine metabolism in cancer can be influenced by the environment (Davidson et al., 2016). For instance, supraphysiological cystine levels in tissue culture media can promote both glutaminase activity and glutamine dependency (Muir et al., 2017). Consistent with these findings, glutamine contributes very little to the oxidative TCA cycle in some cancers in vivo (Davidson et al., 2016). Similar to high-cystine conditions, increased mitochondrial
Europe PMC Funders Author Manuscripts
NAD+/NADH ratio could also enhance oxidative glutamine metabolism and drive glutamine flux into aspartate synthesis. We observed that AGC1-KD suppressed reductive glutamine metabolism in C2C12 cells, and this may also be the case for LLC1 cells in vivo, potentially explaining why AGC1-KD tumors are sensitive to glutaminase inhibition in vivo.
There are three glutaminase isoforms in mammalian cells: liver isoform (LGA), kidney isoform (KGA), and a splice variant of KGA (GAC, also known as glutaminase C) that localizes to mitochondria (Cassago et al., 2012). GAC is the enzymatically most efficient isoform and is often upregulated in cancers, and connected to glutamine anaplerosis (Cassago et al., 2012). Upon CB-839 treatment, which selectively inhibits GAC (Gross et al., 2014), cells may utilize cytosolic glutamate as an alternative source. Because AGC1 exports aspartate from mitochondria in exchange for cytosolic glutamate, decreased glutamate delivery to mitochondria might also contribute to CB-839 toxicity in AGC1-KD cells. Decreased steady-state TCA cycle labeling from [U13C]glutamate in AGC1-KD cells (Figure S5I) could suggest that mitochondrial glutamate entry might indeed be impaired. However, two other glutamate importers are located in the inner mitochondrial membrane, Slc25a22 and Slc25a18 (Palmieri, 2013), and these transporters may maintain some mitochondrial glutamate delivery in AGC1-KD cells. In support of this, the inability of α-KG to fully rescue glutamine limitation when aspartate synthesis is blocked suggests that a potential deficiency in mitochondrial glutamate uptake might be a factor that exacerbates the drop in mitochondrial aspartate levels in AGC1-KD cells.
Although low glutamine and CB-839 treatment lead to similar phenotypes, these two conditions are not identical. Because low glutamine levels will affect more pathways than CB-839 treatment, cell proliferation/survival and the depletion of some NEAAs and TCA intermediates were more pronounced in low glutamine. However, CB-839 synergizes with AGC1-KD similarly to low glutamine, suggesting that decreased TCA cycle anaplerosis is one reason why AGC1-KD cells are sensitive to glutamine withdrawal. Mitochondrial transporters can be promiscuous and transport multiple metabolites across membranes with varying binding efficiencies (Fiermonte et al., 2009; Gutiérrez-Aguilar and Baines, 2013). For instance, uncoupling protein 2 (UCP2) can export four carbon metabolites from mitochondria, including aspartate (Vozza et al., 2014). We speculate that various
mitochondrial transporters, including AGC2, maintain some degree of cytosolic aspartate delivery in AGC1-KD cells as long as aspartate levels in mitochondria are sufficiently high. Interestingly, not all anaplerotic substrates rescue glutamine limitation in AGC1-KD cells. Dimethlymalate (dMal, a cell-permeable form of malate) failed to rescue low glutamine or CB-839 treatment (Figure 5C), was unable to increase aspartate levels (Figures S4A and S4B), and caused a reduction in TCA intermediates in some conditions. These data suggest that dMal might have potentially harmful effects on cells other than solely supplying four carbon units to the TCA cycle.
We used asparagine levels as a proxy for cytosolic aspartate in cell culture experiments; however, the fact that mouse plasma contains asparagine (Rivera et al., 1987) may explain why asparagine levels are unchanged in AGC1-KD tumors compared to controls in vivo. Interestingly, asparagine levels were increased with CB-839 treatment in vivo independently of AGC1 expression, in line with recent reports pointing out that asparagine synthase
Europe PMC Funders Author Manuscripts
expression is upregulated in CB-839-resistant cells (Biancur et al., 2017). This may suggest an independent, antiapoptotic function for asparagine as previously reported (Zhang et al., 2014). In our system, asparagine supplementation had no effect on CB-839-treated cells in vitro; however, this may change when cells are adapted to grow in the presence of
glutaminase inhibitors (Krall et al., 2016). In addition, because asparagine is produced from both cytosolic aspartate and glutamine, in media where glutamine is limited, asparagine levels may not be a good proxy for cytosolic aspartate and could explain why aspartate supplementation did not increase asparagine levels in low glutamine.
Aspartate availability can be limiting for tumor growth in vivo (Gui et al., 2016; Sullivan et al., 2018) and we find that AGC1 deficiency leads to both reduced cytosolic aspartate and increased dependence on glutaminase. Adaptive programs downstream of glutamine withdrawal can also promote the uptake of extracellular aspartate (Tajan et al., 2018). These findings suggest that combination therapies targeting both aspartate and glutamine
metabolism may be synergistic. We found that AGC1 plays a central role in sustaining cytosolic aspartate levels, particularly when mitochondrial glutaminolysis is compromised. This implies that targeting AGC1 could sensitize some cancers to glutaminase inhibitors. It is worth noting that genetic background and tissue of origin are also important aspects to consider for targeting metabolism (Mayers et al., 2016; Yuneva et al., 2012), and additional studies are necessary to define the cancer subsets that are most likely to respond to these interventions.
Environmental nutrients can also impact cancer cell metabolism (Tardito et al., 2015; Cantor et al., 2017; Muir et al., 2017; Muir and Vander Heiden, 2018). Another caveat of our study in this respect is that the mechanistic analysis for why cells require mitochondrial aspartate export used cells in culture that rely on glutamine for TCA cycle anaplerosis. However, glutamine is not the major source of aspartate for all tumor cells in vivo (Davidson et al., 2016; Muir et al., 2017), and some tumors have been shown to synthesize glutamine from glucose in a series of reactions that consume TCA cycle intermediates (Tardito et al., 2015; Hensley et al., 2016). Thus, despite showing that AGC1 loss can sensitize some tumors to glutaminase inhibition, whether tumors that use the TCA cycle to make, rather than
consume, glutamine exhibit a similar dependence on AGC1 remains unknown. Furthermore, potential toxicities of AGC inhibition in healthy cells could limit targeting of AGC1, as AGC1 deficiency in mice and humans leads to loss of motor coordination and neuronal defects (Falk et al., 2014; Jalil et al., 2005; Sakurai et al., 2010; Wibom et al., 2009), while loss-of-function mutations in AGC2 lead to the urea cycle-associated disorder type II citrullinemia (Saheki et al., 2002; Yasuda et al., 2000). Nevertheless, our data provide evidence that in some contexts tumor-specific inhibition of AGC1 can reduce tumor growth, and this effect can be exacerbated by glutaminase inhibition.
Europe PMC Funders Author Manuscripts
Star
⋆
Methods
Key Resources TableREAGENT or RESOURCE SOURCE IDENTIFIER
Antibodies
Mouse monoclonal α-Aralar (AGC1) antibody B2 Santa Cruz Biotechnology Cat#: sc-271056; RRID: AB_10608837
Mouse monoclonal α-Beta actin antibody Sigma-Aldrich Cat#: A5316; RRID: AB_476743 Anti-mouse secondary antibody Dako Österreich GmbH Cat#: P0260; RRID: AB_2636929 Chemicals, Peptides, and Recombinant Proteins
2-deoxyglucose Sigma-Aldrich Cat#: D8375-1G
D-Glucose > 99,5%, CELLPURE Carl Roth GmbH Art.-Nr. HN06.3
L-Glutamine Sigma-Aldrich Cat#: G6392-10VL
MEM 50X Amino Acid Solution Sigma-Aldrich Cat#: M5550
100X Non-essential Amino Acid Solution Sigma-Aldrich Cat#: M7145-100mL
Metformin Sigma-Aldrich Cat#: PHR1084-500MG
Sodium pyruvate Sigma-Aldrich Cat#: P2256-5G
dimethylalpha-ketoglutarate Sigma-Aldrich Cat#: 349631-5G
dimethylmalate Sigma-Aldrich Cat#: 238198-100G
L-Aspartate Sigma-Aldrich Cat#: A7219-100G
L-Asparagine monohydrate Sigma-Aldrich Cat#: A8381-100G
L-Glutamate Sigma-Aldrich Cat#: G1251-100G
L-Serine Sigma-Aldrich Cat#: S54500-1G
L-Glycine Sigma-Aldrich Cat#: G8790-100G
L-Alanine Sigma-Aldrich Cat#: A7627-1G
L-Proline Sigma-Aldrich Cat#: P5607
[13C-U]-D-Glucose Cambridge Isotopes Laboratories Cat#: CLM-1396
[13C-U]-L-Glutamine Cambridge Isotopes Laboratories Cat#: CLM-1822-H
[13C-U]-L-Aspartate Cambridge Isotopes Laboratories Cat#: CLM-1801-H
[13C-U]-L-Glutamate Cambridge Isotopes Laboratories Cat#: CLM-3949-PK
[U-14C]-glutamine American Radiolabeled Chemicals Cat#: ARC 0196
Adenine Sigma-Aldrich Cat#: A8626-5G
Guanine Sigma-Aldrich Cat#: G11950-10G
Hypoxanthine Sigma-Aldrich Cat#: H9377-5G
Thymine Sigma-Aldrich Cat#: T0376-5G
Uridine Sigma-Aldrich Cat#: U6381-5G
O-(Carboxymethyl)hydroxylamine hemihydrochloride (AOA) N/A Cat#: C13408-1G Critical Commercial Assays
Cell Titer Glo Promega Cat #: G7570
NAD/NADH Glo Promega Cat #: G9071
Dead Cell Apoptosis Kit Thermo Fisher Cat #: V13242
Europe PMC Funders Author Manuscripts
REAGENT or RESOURCE SOURCE IDENTIFIER
Deposited Data
Cancer Cell Line Encyclopedia Broad Institute https://portals.broadinstitute.org/ccle
Experimental Models: Cell Lines
Mouse: C2C12 ATCC CRL-1772
Muse: LLC1 ATCC CRL-1642
Mouse: Al1376 Our laboratory N/A
Human: HeLa ATCC CCL-2
Human: A549 ATCC CCL-185
Human: NCI-H1299 ATCC CRL-5803
Human: PANC1 ATCC CRL-1469
Human: CAPAN2 ATCC HTB-80
Experimental Models: Organisms/Strains
C57BL/6 Jackson Laboratories & Janvier Stock No: 000664
Oligonucleotides
mSlc25a12_guide 1:GCCATGCTGTGCTCGGAAGC IDT DNA custom oligo
mSlc25a12_guide 2:CCATGCTGTGCTCGGAAGCC IDT DNA custom oligo
mSlc25a12_guide 3:CTCATGAGGATCACCTCGTT IDT DNA custom oligo
mSlc25a12_guide 4:CAGGTGCATACAACCAAACG IDT DNA custom oligo
mSlc25a12_guide 5:GGCTTCCGAGCACAGCATGG IDT DNA custom oligo
mSlc25a12_guide 6:ACTCGCAGTCCCAGTTAAAA IDT DNA custom oligo
mSlc25a12_guide 7:ACTCGCAGTCCCAGTTAAAA IDT DNA custom oligo
Recombinant DNA
pLKO.1:TRCN0000069911 mouse shRNA targetting AGC1 (KD1)
Sigma-Aldrich Clone ID: NM_172436.2-691s1c1
pLKO.1:TRCN0000069908 mouse shRNA targetting AGC1 (KD2)
Sigma-Aldrich Clone ID: NM_172436.2-1241s1c1
pLKO.1:TRCN0000069912 mouse shRNA targetting AGC1 (KD3)
Sigma-Aldrich Clone ID: NM_172436.2-460s1c1
pLKO.1:TRCN0000044591 human shRNA targetting AGC1 (KDa)
Sigma-Aldrich Clone ID: NM_003705.2-132s1c1
pLKO.1:TRCN0000310089 human shRNA targetting AGC1 (KDb)
Sigma-Aldrich Clone ID: NM_003705.3-212s21c1
pLKO.1-puro Non-Target shRNA Control Sigma-Aldrich Cat #: SHC016V pLentiCRISPRv2 (lentiviral Cas9 expressing vector) Laboratory of Dr. Feng Zhang Addgene Cat #52961 pcDNA4 HisMaxC-mouseAGC1 subcloned into pcDNA4 HisMaxC N/A
PMXS-SLC1A3 Laboratory of Dr. Kivanc Birsoy Addgene Cat #72873
Software and Algorithms
GraphPad Prism 7 for Graphs and statistics GraphPad Software https://www.graphpad.com/
Amdis GCMS Data Analysis Software NIST N/A
xCalibur Software for LCSM Analysis Thermo Fisher Scientific N/A
MATLAB MathWorks https://www.mathworks.com/
FlowJo v10 for Flow Cytometry Data Analysis FlowJo, LLC https://www.flowjo.com/
Europe PMC Funders Author Manuscripts
REAGENT or RESOURCE SOURCE IDENTIFIER
Corel Draw x7 for Figure Preparation Corel Corporation https://www.coreldraw.com/
Other
DMEM, High Glucose, Pyruvate GIBCO Cat #: 11995065
DMEM W/L-Glutamine and 4.5g/L Glucose; w/ot Sodium Pyruvate
Corning Cat #: MT10017CV
DMEM, High Glucose, No Glutamine GIBCO Cat #: 11960044
DMEM, No Glucose, No Glutamine No Sodium Pyruvate Corning Cat #: 17-207-CV
Hank’s Balanced Salt Solution Sigma Cat #: H8264
Phosphate Buffered Saline (Calcium/Magnesium free) GIBCO Ref # 10010-015 500mL
Contact for Reagent and Resource Sharing
Further information and requests for resources and reagents should be directed to the Lead Contact, Juliane G. Bogner-Strauss ([email protected]).
Experimental Model and Subject Details
Cell Lines—All cells were sub-cultured in Dulbecco’s Modified Eagle’s Medium (DMEM, (25mM Glucose, 4mM Glutamine, 1mM Sodium Pyruvate) (GIBCO) supplemented with 10% fetal bovine serum and 50units/mL Penicilin/Streptomycin and incubated at 37°C with 5% CO2. All cells utilized tested negative for Mycoplasma. The AL1376 cell line was derived from the KrasG12D; p53fl/fl; Pdx-cre mouse model as described previously (Mayers et al., 2014).
Animals—The study was approved by the institutional ethics committee and experiments were performed according to the guidelines of the Austrian Federal Ministry of Science and Research. Experiment licenses were granted under BMWF-66.007/0026-WF/V/3b/2015 and BMWF-66.007/0008-WF/V/3b/2016. Mouse experiments with CB-839 were approved by the MIT Committee on Animal Care (IACUC). 500,000 LLC1 or 100,000 AL1376 cells were injected into flanks of 7-8 weeks old female C57BL/6 mice (Janvier and Jackson Laboratories). Tumor sizes were measured using calipers throughout the study and estimated volumes were calculated by using the formula V = (π/6)*(length*width2) (Gui et al., 2016). For CB-839 treatment studies, tumors were grown for 12 or 17 days followed by
administration of 200mg/kg CB-839 or vehicle twice daily as previously described (Gross et al., 2014). Tumors were harvested 4 hours after the final drug dose and metabolites were quantified using LCMS.
Method Details
Stable-knockdown of AGC1—Stable knock-down of AGC1 protein in cells was achieved by using 5 independent mouse Slc25a12 mRNA targeting, 2 independent human SLC25A12 mRNA targeting and 2 mammalian non-targeting lentiviral shRNA particles purchased from Sigma. For the transduction, 5 000 to 10 000 cells/well were seeded into 6-well plates. The following day, fresh media containing virus was added with 8μg/mL Polybrene to each well. One well was incubated without lentivirus for selection control.
Europe PMC Funders Author Manuscripts
After 3-4 days, cells were moved to T25 flasks; and selection was performed using varying concentrations of puromycin (ranging from 1μg/mL to 4μg/mL) for 5-7 days until no viable cells remained in selection control.
Proliferation/Survival Rates—25,000 cells/well (long term proliferation/survival experiments) or 100,000-200,000 cells/well (short term starvation, CB-839 treatment) were seeded into 6-well plates. After adhering overnight, initial cell number was determined from reference wells following trypsinization. Then the experimental wells were washed with PBS at least twice or once (only for LLC1 cells) and media conditions were applied. Due to low-adherent nature of LLC1 cells, both PBS and fresh media was applied very carefully. Final cell numbers were counted 2 or 3 days for C2C12 and LLC1 cells and 4 or 7 days AL1376, A549, H1299, PANC1, CAPAN2, HeLa cells after the treatment for proliferation experiments. Minimum 3mL media was used per well, 4 or 5mL media was used for incubations longer than 3 days. Proliferation/survival rate was calculated by the following formula
Proliferation/Survival Rate = Log2(Final cell count/Initial cell count)/Day
Cell Viability Assays—500 cells (for proliferation assays) or 2,000 cells (for survival assays) were seeded into 96-well plates and allowed to adhere overnight. Media conditions (100μL/well) were applied as indicated. After media change, 40μL (for survival) or 100μL (for proliferation) Cell Titer Glo (Promega) reagent was added into reference wells to get initial values for each replicate. Manufacturer’s recommendations were followed to determine luminescence signals: plates were mixed for 2-3 min, incubated at room temperature for 10 min and signals were measured using a luminometer (Oreon II Microplate Reader Luminometer (Berthold)). The same protocol was used for final day measurements. For survival studies, the final measurement was obtained after two or three days. For growth assays, media was refreshed every second day and final measurements were made at day four or five and growth rate calculated by the following formula:
Proliferation/Survival Rate = Log2(Final measurement/Initial measurement)/Day
Determining Annexin V/Propidium Iodide staining using flow cytometry—
150,000-200,000 cells were seeded into 6-well plates using full DMEM media. The next day, cells were washed and pyruvate-free DMEM with 4mM or 0.1mM glutamine was added. 24hours later cells were collected via trypsinization and stained with Annexin V and propidium iodide using Thermo Fisher Dead Cell Apoptosis Kit with Annexin V Alexa Fluor 488 & Propidium Iodide (PI) (V13241) to determine dead and apoptotic cells following manufacturer’s instructions. Specifically, maximum 1 million/mL cells were diluted with annexin binding buffer after several washing steps and 5μL Alexa Fluor 488-Annexin PI and 1μL 100μg/mL PI solutions were added onto 100μL cell suspensions and incubated at room temperature for 15minutes. After the incubation period, 400μL of Aannexin-binding buffer was mixed gently with the cell suspension and immediately after fluorescence emmisons were measured in FITC (Annexin V) and Texas Red (PI) channels
Europe PMC Funders Author Manuscripts
using a flow cytometer (BD, FACS Diva). The percentages of cells positive for either of these dyes were determined and analyzed using FlowJo software.
Transient overexpression of mouse and human AGC1—In order to investigate the effects of transient overexpression of murine AGC1 on proliferation, wild-type C2C12 cells, 0,5x10⁵ cells were seeded into 1,5mL fresh media containing 6-well plates together with 1:1 mixture of 0.35μg pcDNA HisMax C vectors with or without AGC1 and 2μL Metafectane Pro (Biontex) -each diluted in 100μL serum free DMEM-. Media was refreshed after 24 hours and cells were counted 60-64 hours after transfection. The proliferation rate was calculated as described above.
To rescue AGC1-KD cells by expressing human AGC1, 70% confluent C2C12 cells were sub-cultured from T-75 flasks into 6-well plates while transfecting pHLCX-flag vectors with or without human AGC1 (hAGC1). 12hours later, 2,000 cells were seeded into 96-well plates for a cell viability assay. Media conditions were applied 8-12 hours later and final measurements were obtained 48hours after the reference measurements, as described above.
CRISPR/Cas9-mediated knock-out of AGC1—7 different guide pairs targeting mouse AGC1 (sgAGC1) were cloned individually into the lentiCRISPRv2 vector (Sanjana et al., 2014; Shalem et al., 2014) that includes a Cas9-expressing cassette. Lentivirus was produced using these vectors, as well as from an empty vector using HEK293T cells as described previously (Sanjana et al., 2014; Shalem et al., 2014). In order to avoid single-cell cloning artifacts, we pooled the vectors containing different sgAGC1 and following lentiviral transduction, C2C12 cells were selected in the presence of 2mM pyruvate and 10mM aspartate.
siRNA-mediated knock-down of Got1/2—Universal Negative Control(SIC001) or MISSION esiRNA targeting mouse Got1 (EMU029631) or mouse Got2 (EMU094111) from Sigma-Aldrich were delivered to C2C12 cells using X-tremeGENE siRNA Transfection Reagent (Roche, 04476093001) following the manufacturer’s instructions. Specifically, we gently mixed 100pmol control siRNA or combination of Got1/Got2 esiRNA (50pmol each) with 200μL transfection reagent and applied them onto C2C12 cells that were previously grown to 50%–60% confluency in well plates. 8 hours later, cells were split into new 6-well plates as described for proliferation assays and media conditions were applied 2-hours after all cell plating.
NAD+/NADH Measurements—NAD+/NADH ratio measurement method was adopted from Sullivan et al. (2015). 25,000 cells per well were seeded into 6-well plates using pyruvate-free DMEM, extracted in 120μL 1:1 0.2N NaOH:PBS solution after 24hours and frozen at −80°C immediately. For NADH measurement, 20μL lysate was incubated at 75°C for 30 min, during which oxidized NAD is degraded. For NAD+, 20μL lysate was diluted 1:1 with lysis buffer and 20μL 0.4N HCl was added. Later, NAD+ samples were incubated at 60°C for 15min to selectively degrade the reduced form of NAD. After individual incubations, samples were cooled down to room temperature for 8 min and the degradation reactions were stopped by 20μL 0.25mM Tris in 0.2N HCl (NADH) and 0.5mM Tris base
Europe PMC Funders Author Manuscripts
(NAD+). Manufacturer’s instruction were followed after sample preparation using the NAD/ NADH Glo Assay (Promega).
Mitochondrial Oxygen Consumption—C2C12 cells were seeded in XF96 polystyrene cell culture microplates (Seahorse Bioscience) at a density of 25.000 cells per well. 24 h after plating, cells were washed and preincubated for 30 min in serum-free XF assay medium supplemented with D-glucose (25 mM), sodium pyruvate (1 mM) and glutamine (2 mM) at 37°C in a non-CO2 environment. Oxygen consumption rate (OCR) was
subsequently measured every 7 min using an XF96 extracellular flux analyzer (Seahorse Bioscience). 2.5 μM antimycin A was used to stop mitochondrial respiration (= non-mitochondrial respiration). Basal non-mitochondrial oxygen consumption rate (OCR) was calculated by subtracting average of 3 subsequent non-mitochondrial OCRs from average of three basal OCRs (prior to antimycin treatment) and normalized to individual protein amount (pmol O2/(min x protein per well)).
For CB-839 treatment, 60,000 C2C12 cells were seeded in XF24-well plates and allowed to adhere overnight. The next day, wells were washed twice with PBS and serum-free, pyruvate-free DMEM, in the presence or absence of 1μM CB-839 (or 0.01% DMSO). 6 hours after treatment, OCRs were measured as described above and subsequently
normalized to cell counts and OCRs of individual genotype (control versus AGC1-KD) in DMSO treated conditions.
Isotope Tracing and GCMS Analysis—For metabolic tracing studies 150,000-200,000 cells/well were seeded in 6-well plates overnight. Cells were washed three times and 5mM [U-13C]glucose or 4mM [U-13C]glutamine (Cambridge Isotopes Laboratories) containing DMEM (10% dialysed serum, no pyruvate) was applied. After 24h of culture, metabolites were extracted from cells or media (10μL) in 80% methanol in water containing 1μg/sample norvaline and dried under nitrogen gas. Polar metabolites were derivatized and measured as described previously (Lewis et al., 2014). Relative metabolite abundances were calculated by integrating ion peak area and normalized to norvaline and later to the cell numbers from identical plates. Mass isotopomer distributions of each ion peak were determined after natural abundance corrections adapted from Fernandez et al. (1996).
Metabolic profiling using LCMS—For cells: 200,000 (in 6-well plate, for TCA intermediates and amino acids) (Corning) C2C12 cells were starved for glutamine in the absence or presence of 5mM Aspartate for 24hours. Samples were prepared the same way as described in the above GCMS section. For tumors: each tumor was snap-frozen in liquid nitrogen immediately after harvesting and stored at −80°C. 6 tumors per group were selected randomly and ~10-20mg from each tumor was sampled and extracted in 80% methanol following the abovementioned procedure. Metabolites were quantified as detailed previously (Sullivan et al., 2015; Davidson et al., 2016). Briefly, dried polar samples were resuspended in 50 μL water and 2 μL were injected into a ZIC-pHILIC 150 × 2.1 mm (5 μm particle size) column (EMD Millipore). Analysis was conducted on a QExactive benchtop orbitrap mass spectrometer equipped with an Ion Max source and a HESI II probe, which was coupled to a Dionex UltiMate 3000 UPLC system (Thermo Fisher Scientific, San Jose, CA). External mass calibration was performed using the standard calibration mixture every 7 days.
Europe PMC Funders Author Manuscripts
Chromatographic separation was achieved using the following conditions: Buffer A was 20 mM ammonium carbonate, 0.1% ammonium hydroxide; buffer B was acetonitrile. The column oven and autosampler tray were held at 25°C and 4°C, respectively. The chromatographic gradient was run at a flow rate of 0.150 mL/min as follows: 0–20 min.: linear gradient from 80% to 20% B; 20–20.5 min.: linear gradient from 20% to 80% B; 20.5–28 min.: hold at 80% B. The mass spectrometer was operated in full-scan, polarity switching mode with the spray voltage set to 3.0 kV, the heated capillary held at 275°C, and the HESI probe held at 350°C. The sheath gas flow was set to 40 units, the auxiliary gas flow was set to 15 units, and the sweep gas flow was set to 1 unit. MS data acquisition was performed in a range of 70–1000 m/z, with the resolution set at 70,000, the AGC target at 10e6, and the maximum injection time at 20 msec. Relative quantitation of polar metabolites was performed with XCalibur QuanBrowser 2.2 (Thermo Fisher Scientific) using a 5 ppm mass tolerance and referencing an in-house library of chemical standards.
Metabolite Measurements using NMR—Sub-confluent C2C12 or LLC1 cells were incubated in 15cm dishes with pyruvate-free DMEM containing 5mM [U-13C]glucose or 2mM [U-13C]glutamine (Cambridge Isotopes Laboratories) for 12 hours. Next day, cells were washed twice and lysed in PBS via sonication. For quenching the metabolites; one volume of cell lysate (or media) was mixed with two volumes of cold methanol, incubated at −20°C for at least 1 hour, and centrifuged at 13000 rpm for 30 min to pellet proteins. Supernatants were transferred to fresh vials and dried for 4 hours at room temperature using a speed vac. 500 μL of NMR buffer in D2O were added to the samples, re-dissolved and transferred to 5 mm NMR tubes. Metabolites were measured as described previously (Prokesch et al., 2017; Radović et al., 2016). Briefly, methanol, sodium phosphate, dibasic (Na2HPO4), sodium hydroxide, hydrochloric acid (32% m/v), and sodium azide (NaN3) were obtained from VWR International (Darmstadt, Germany). 3(trimethylsilyl)propionic acid-2,2,3,3-d4 sodium salt (TSP) was obtained from Alfa Aesar (Karlsruhe, Germany). Deuterium oxide (D2O) was obtained from Cambridge Isotope laboratories (Tewksbury, MA). Deionized water was purified using an inhouse Milli-Q Advantage Water Purification System from Millipore (Schwalbach, Germany). All chemicals were used with no further purification. The phosphate buffer solution was prepared by dissolving 5.56 g of anhydrous NaH2PO4, 0.4 g of TSP, and 0.2 g NaN3, in 400 mL of deionized water and adjusted to pH 7.4 with 1M NaOH and HCl. Upon addition of deionized water to a final volume of 500 mL the pH was readjusted to pH 7.4 with 1M NaOH and HCl. The buffer was lyophilized and taken up in 500 mL D2O to obtain NMR buffer in D2O.
All NMR experiments were performed at 310 K on a Bruker Avance III 500 MHz spectrometer equipped with a TXI probe head. The 1D CPMG (Carr–Purcell–Meiboom– Gill) pulse sequence (cpmgpr1d, 512 scans, 73728 points in F1, 12019.230 Hz spectral width, 1024 transients, recycle delay 4 s), with water suppression using pre-saturation, was used for 1H 1D NMR experiments.
Bruker Topspin version 3.1 was used for NMR data acquisition. The spectra for all samples were automatically processed (exponential line broadening of 0.3 Hz), phased, and
referenced to TSP at 0.0 ppm using Bruker Topspin 3.1 software (Bruker GmbH, Rheinstetten, Germany).
Europe PMC Funders Author Manuscripts
The 2D HSQC (heteronuclear single quantum correlation) pulse sequence (hsqcetgpsisp2, 8 scans, 256 points in F1, 2048 points in F2, 12658.228 Hz spectral with in F1, 10026.738 Hz spectral width in F2) was used for 2D 1H-13C experiments. Spectral data were transferred to MestreNova 11.0.2 and processed (exponential line broadening of 0.3 Hz), phased, and referenced to TSP. Integral regions for metabolites of interest corresponding to a certain number of protons and for external standard were defined. Integrals were normalized to the number of protons and concentration was determined using external standard concentration. Concentrations of non-labeled compounds were determined using Chenomx NMR Suite 8.2 using internal standard concentration. For fold changes, the integral ratio of labeled versus unlabelled compounds was calculated for each sample and replicates were averaged.
Immunohistochemistry—For AGC1 immunohistochemistry, Aralar B-2 antibody (Santa Cruz, sc-271056) (diluted 1:50 in Antibody Diluent Solution (Dako, S2022)) was applied on tissue slides that had been previously blocked with 3% H2O2 in methanol and incubated at room temperature for 1h. Afterward, slides were covered with Rabbit/Mouse Detection Solution (Dako 5007) for 30min and subsequently stained with AEC Substrate Chromogen (Dako, K3464) and hematoxylin. Sections were imaged using light microscopy (Olympus) at the specified magnifications.
Radioactive CO2 Release—The day before measurements, 250,000 cells/well were plated into 6-well plates. 1.1μCi [U-14C]-glutamine (ARC 0196) was added into each well and wells were covered with Whatman paper soaked with 5M KOH. After incubating for 1h, wells were treated with 200μL of 2.6N HClO4 for another 2h. Later, papers covering individual wells were cut gently and transferred into vials containing 20mL scintillation cocktail. Following rigorous shaking, radioactive carbon units were measured.
Extracellular Flux Analysis—150,000-200,000 cells were seeded into 6-well plates and let adhere overnight. After 2 washes, media conditions were applied (2ml/well) and cell counts were obtained from reference wells. 48 hours later, media samples were collected, centrifuged at top speed and stored at −80°C and final cell count were obtained from respective wells. Glucose, glutamine, lactate and glutamate concentrations were quantified using Metabolic Flux Analyzer (YSI 2900, YSI Life Sciences) in 96-well format.
Western blot analysis—Cells were harvested by scraping with SDS-lysis buffer (50 mM Tris-HCl, pH 6.8, 10% glycerol, 2.5% SDS, cOmplete protease inhibitor cocktail) and samples were digested by benzonase (Merck Millipore). Protein concentrations were determined with the Pierce BCA Protein Assay Kit (Thermo Fisher Scientific). 15-50 μg of protein lysate were loaded into a 10% or 4%–12% BisTris gel (NuPAGE, Invitrogen, Thermo Fisher Scientific), and gels were blotted to nitrocellulose membranes. Membranes were first blocked with 5%BSA in Tris-Buffered Phospohate Saline (TBST) and then incubated with Aralar B-2 (1:1000) (sc271056, Santa Cruz) and anti β-Actin (1:250000) (A5316, Sigma-Aldrich) antibodies (prepared in the same blocking solution) overnight at 4°C. Later, the primary antibodies were conjugated with horseradish peroxidase using secondary antibody (anti-mouse 1:5000) (Dako Österreich GmbH). SuperSignal West Pico
Europe PMC Funders Author Manuscripts
Chemiluminescent Substrate (Thermo Fisher Scientific, Waltham, MA, US) was used for detection.
Quantitative Real-Time PCR—PeqGOLD Total RNA Isolation Kit was used to extract RNA from cells (Peqlab). cDNA was synthesized using High Capacity cDNA Reverse Transcription Kit (Applied Biosystems). mRNA expression of individual genes was assessed using SYBR-green based qPCR method (Platinum SYBR Green qPCR SuperMix-UDG with ROX, Invitrogen) on a StepOne Plus Real-Time PCR System (Applied Biosystems) in 96-well format (96x0,2ml Plate, Frosted Subskirted Thin-wall) using 5pmol primer mixture and 5ng cDNA per well. Ct values of every gene first subtracted from the ones of TfIIβ and/or Rplp0 (δCt), then normalized to the mean δCt of control group for every gene (δδCt). Fold changes were calculated using the following formula:
Fold change = 2−(δδCt)
In experiments without control groups, such as comparing different cell lines, relative δCt values were projected in logarithmic scale, unless indicated otherwise.
Primers were obtained from Primer Bank Database (https://pga.mgh.harvard.edu/
primerbank/). Pairs that yield smaller than 200bp amplicons and do not projected to amplify non-spesific regions were selected. Melting curve analysis was performed to verify
specificity of the reactions. Primer sequences are available by request.
Quantification and Statistical Analysis
Data are shown as mean ± standard deviation (SD) or mean ± standard error of the mean (SEM). Heat-maps denote medians. Sample size (n) indicates biological replicates within the same experiment. Statistics were calculated using two-tailed paired Student’s t test unless indicated otherwise. Non-parametric t test was used when the data within groups are not normally distributed or the sample size is larger than 6, otherwise parametric t test was applied. Significance levels: *p ≤ 0.05, **p ≤ 0.01, ***p ≤ 0.001.
Supplementary Material
Refer to Web version on PubMed Central for supplementary material.
Acknowledgments
This work was funded by the Austrian Science Fund FWF SFB LIPTOX F3018, P27108, P28854, W1226 DK “Metabolic and Cardiovascular Disease,” the Integrative Metabolism Research Center Graz, and the Austrian infrastructure program 2016/2017. M.G.V.H. acknowledges support from the Lustgarten Foundation, SU2C, the Ludwig Center at MIT, the MIT Center for Precision Cancer Medicine, and the NCI (P30 CA1405141 and R01 CA168653). M.G.V.H. is also an HHMI faculty scholar. H.F.A. was supported by Austrian Marshall Plan Scholarship. A.L. is supported by the Ludwig Center for Molecular Oncology Fund, NSF (GRFP DGE-1122374), and T32GM007287. S.S. was trained within frame of the PhD program Molecular Medicine. A.N.L. is a Robert Black Fellow of the Damon Runyon Cancer Research Foundation, DRG-2241-15. W.A.-Z. is supported by CBmed – Center for Biomarker Research in Medicine. We thank Thales Papagiannakopoulos for sharing CB-839. We are grateful for all the people in the Vander Heiden and Bogner-Strauss labs, especially Aaron Hosios, Lucas Sullivan, Zhaoqi Li, Laura Danai, Ariane Pessentheiner, and Daniel Schmidt, for constructive discussions, experimental advice, and critical reading of the manuscript. We acknowledge the support of NAWI Graz and the technical support of Thomas Schreiner, Wolfgang Krispel, Silvia Schauer, and Bena Chan.