HAL Id: hal-01412611
https://hal.sorbonne-universite.fr/hal-01412611
Submitted on 8 Dec 2016HAL is a multi-disciplinary open access archive for the deposit and dissemination of sci-entific research documents, whether they are pub-lished or not. The documents may come from teaching and research institutions in France or abroad, or from public or private research centers.
L’archive ouverte pluridisciplinaire HAL, est destinée au dépôt et à la diffusion de documents scientifiques de niveau recherche, publiés ou non, émanant des établissements d’enseignement et de recherche français ou étrangers, des laboratoires publics ou privés.
quantification of arterial volumetric flow rate in a single
heartbeat
Mafalda Correia, Jean Provost, Mickael Tanter, Mathieu Pernot
To cite this version:
Mafalda Correia, Jean Provost, Mickael Tanter, Mathieu Pernot. 4D ultrafast ultrasound flow imaging: in vivo quantification of arterial volumetric flow rate in a single heartbeat. Physics in Medicine and Biology, IOP Publishing, 2016, 61 (23), pp.L48. �10.1088/0031-9155/61/23/L48�. �hal-01412611�
This content has been downloaded from IOPscience. Please scroll down to see the full text.
Download details:
IP Address: 134.157.80.136
This content was downloaded on 08/12/2016 at 14:10 Please note that terms and conditions apply.
4D ultrafast ultrasound flow imaging: in vivo quantification of arterial volumetric flow rate in a
single heartbeat
View the table of contents for this issue, or go to the journal homepage for more 2016 Phys. Med. Biol. 61 L48
(http://iopscience.iop.org/0031-9155/61/23/L48)
You may also be interested in:
3D ultrafast ultrasound imaging in vivo
Jean Provost, Clement Papadacci, Juan Esteban Arango et al.
Multiplane wave imaging increases signal-to-noise ratio in ultrafast ultrasound imaging Elodie Tiran, Thomas Deffieux, Mafalda Correia et al.
Echo motion imaging with adaptive clutter filter for assessment of cardiac blood flow Hiroki Takahashi, Hideyuki Hasegawa and Hiroshi Kanai
Echo speckle imaging of blood particles with high-frame-rate echocardiography Hiroki Takahashi, Hideyuki Hasegawa and Hiroshi Kanai
Comparison of blood velocity measurements between UD and accelerated phase-contrast MR angiography Jingfeng Jiang, Charles Strother, Kevin Johnson et al.
Stochastic precision analysis of 2D cardiac strain estimation in vivo E A Bunting, J Provost and E E Konofagou
Development of a custom-designed echo particle image velocimetry system Lingli Liu, Hairong Zheng, Logan Williams et al.
Physics in Medicine & Biology Institute of Physics and Engineering in Medicine Physics in Medicine & Biology
4D ultrafast ultrasound flow imaging:
in vivo quantification of arterial
volumetric flow rate in a single heartbeat
Mafalda Correia, Jean Provost, Mickael Tanterand Mathieu Pernot1
Institut Langevin, ESPCI Paris, PSL Research University, INSERM U979, CNRS UMR 7587, Université Paris Diderot - Sorbonne Paris Cité UMR 7587, UPMC Université Paris 06 - Sorbonne Universités UMR 7587, 17 rue Moreau, 75012 Paris, France
E-mail: mathieu.pernot@espci.fr
Received 31 May 2016, revised 31 July 2016 Accepted for publication 2 September 2016 Published 3 November 2016
Abstract
We present herein 4D ultrafast ultrasound flow imaging, a novel ultrasound-based volumetric imaging technique for the quantitative mapping of blood flow. Complete volumetric blood flow distribution imaging was achieved through 2D tilted plane-wave insonification, 2D multi-angle cross-beam beamforming, and 3D vector Doppler velocity components estimation by least-squares fitting. 4D ultrafast ultrasound flow imaging was performed in large volumetric fields of
view at very high volume rate (>4000 volumes s−1) using a 1024-channel 4D
ultrafast ultrasound scanner and a 2D matrix-array transducer. The precision of the technique was evaluated in vitro by using 3D velocity vector maps to estimate volumetric flow rates in a vessel phantom. Volumetric Flow rate errors of less than 5% were found when volumetric flow rates and peak velocities were
respectively less than 360 ml min−1 and 100 cm s−1. The average volumetric
flow rate error increased to 18.3% when volumetric flow rates and peak
velocities were up to 490 ml min−1 and 1.3 m s−1, respectively. The in vivo
feasibility of the technique was shown in the carotid arteries of two healthy volunteers. The 3D blood flow velocity distribution was assessed during one cardiac cycle in a full volume and it was used to quantify volumetric flow rates (375 ± 57 ml min−1 and 275 ± 43 ml min−1). Finally, the formation of 3D vortices at the carotid artery bifurcation was imaged at high volume rates.
M Correia et al
Printed in the UK
L48
PHMBA7
© 2016 Institute of Physics and Engineering in Medicine 2016
61
Phys. Med. Biol.
PMB
0031-9155
10.1088/0031-9155/61/23/L48
Fast Track Communication
23
L48 L61
Physics in Medicine & Biology
Institute of Physics and Engineering in Medicine
Original content from this work may be used under the terms of the Creative Commons Attribution 3.0 licence. Any further distribution of this work must maintain attribution to the author(s) and the title of the work, journal citation and DOI. 1 Author to whom any correspondence should be addressed.
Keywords: ultrasound, 4D ultrafast imaging, volumetric flow rate, 3D blood velocity vector
S Online supplementary data available from stacks.iop.org/PMB/61/L48/
mmedia
(Some figures may appear in colour only in the online journal)
1. Introduction
The 3D visualization and quantification of complex blood flow patterns in the human cardio-vascular system is a challenging imaging problem that requires the estimation of blood flow velocities along all directions with high spatial and high temporal resolutions within a large field of view. The recent introduction of 4D flow cardiovascular magnetic resonance (CMR) imaging has demonstrated the clinical potential of complete flow analyses that include the
quantification of the three components of the velocity flow vectors (Harloff et al 2009, Markl
et al2012). 4D CMR is a powerful yet expensive tool that can image and quantify blood flows
at any location in the body with a composite temporal resolution of, typically, 30 ms, by com-bining hundreds of heart cycles acquired over tens of minutes. Optical coherence tomography is also a promising blood flow imaging technique but remains limited to superficial tissues application (Makita et al 2008, Srinivasan et al 2010), e.g. the human eye vascularization.
Conventional ultrasound Doppler imaging is used in daily clinical practice to assess in real-time deep and complex blood flow, with sub-millimeter resolution but it is limited to the esti-mation of the flow velocity component along the beam axis. Several ultrasound-based vector flow imaging techniques have been developed over the past decades to quantify and visualize
both the axial and lateral components of the blood velocity (Bohs et al 2000, Capineri et al
2002, Jensen 2003, Ebbini 2006, Tortoli et al 2006, Udesen and Jensen 2006, Xu and Bashford
2013, Jensen 2014, Pihl and Jensen 2014) in a single heartbeat. Real-time implementations
of these approaches have been evaluated in vivo and are now available in clinical scanners
(Hansen et al 2015, Tanaka et al 2015). Such techniques were also extended to 3D vector flow
imaging, but were limited to a small number of imaging planes and the frame-rates achieved
remained relatively low (see Dunmire et al 2000 for a review). To achieve higher frame-rates,
sequences based on the emission of unfocused waves that insonify large fields of view can be used. For instance, 2D ultrafast ultrasound imaging based on plane-wave emissions has been
proposed for high-frame-rate axial velocity (Sandrin et al 1999) or velocity vector (Tanter
et al2002) estimation, in which the increased frame-rate can either be leveraged to map low
velocity blood flow with high sensitivity (Macé et al 2011) or to detect high velocities in large arteries (Bercoff et al 2011). Ultrafast ultrasound imaging has been applied to the vector esti-mation of cardiac (Lovstakken et al 2006) and arterial (Flynn et al 2011, Ekroll et al 2013,
Yiu et al 2014, Fadnes et al 2015, Osmanski et al 2015) blood flow. 2D methods based on
diverging-wave emissions, which provide very large field of views, were also developed for
the mapping of blood flow in real-time, both for a single (Tanaka et al 2008, Osmanski et al
2012) and for both components of the velocity vector (Pihl et al 2012).
The development of standard 3D ultrasound systems opened new possibilities for vec-tor flow imaging in 3-dimensions by assessing new and reliable measurements, such as 3D velocity vector components and the volumetric flow rate. For instance, volumetric
echocar-diographic particle image velocimetry (V-Echo-PIV) (Falahatpisheh et al 2014, Falahatpisheh
and Kheradvar 2016) was shown to assess and quantify in vivo cardiac vector flow in 3D
Likewise, the advent of 3D ultrasound systems containing a large number of program-mable channels has recently opened new possibilities in ultrafast imaging (Tanter and Fink
2014) and blood flow imaging (Jensen et al 2013). For instance, we recently introduced
3D ultrafast Doppler imaging (Provost et al 2014, 2015), which allowed for the
map-ping of one component of the blood velocity in large 3D fields of view, e.g. the entire
heart (Provost 2014) or the carotid bifurcation (Provost 2015) at thousands of volumes per
second. In parallel, the transverse oscillation approach was developed and applied to the estimation of 3D velocity vectors in vitro using a 2D matrix-array probe (Pihl and Jensen
2014, Pihl et al 2014). Holbek et al presented an in vivo carotid artery 3D velocity
vec-tor study in one plane using continuous data and a 3D transverse oscillations approach
(Holbek et al 2015). However, the full 3D mapping of the three components of the velocity
vector in a full volumetric field of view at high frame rate remains an important technical challenge.
In this study, we introduce 4D ultrafast flow imaging based on ultrafast cross-beam vector Doppler imaging for the volumetric mapping of blood flow at high volume-rate. The objec-tives of this study were (1) to establish the experimental methods for volumetric blood flow imaging, (2) to evaluate the accuracy and precision of the technique in vitro in artery phantoms and (3) to show the in vivo feasibility of mapping arterial flows and assessing volumetric flow rates in the human carotid artery.
2. Material and methods
2.1. Multi-angle volumetric ultrafast Doppler acquisition concept
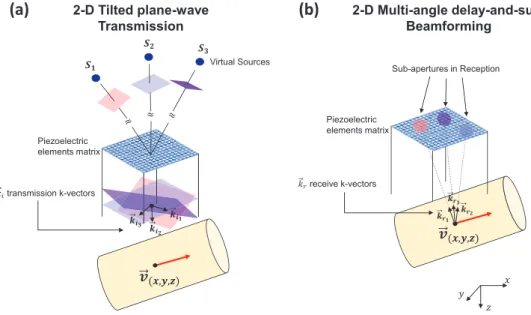
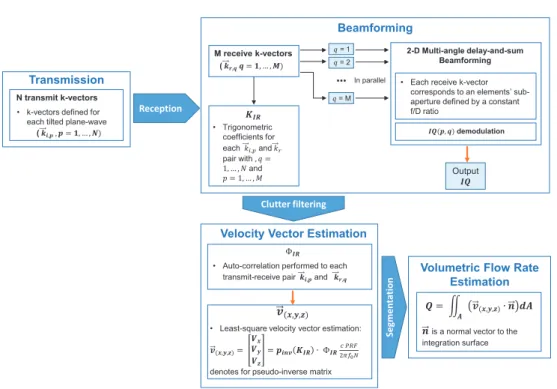
In order to reconstruct the three components of the local velocity vector in a volumetric field of view at thousands of volume per second, 4D ultrafast flow imaging is based on (1) mul-tiple 2D tilted plane-wave insonifications, (2) receive beamforming performed along mulmul-tiple receive angles (figure 1), (3) spatiotemporal clutter filtering, and (4) voxel-wise least-square velocity vector estimation.
2.1.1. 2D tilted plane waves transmission. The 4D ultrafast ultrasound flow imaging sequence is based on the sequential emission of sets of N tilted plane waves with normal vectors
⎯→⎯ ( = )…
ki p, p 1, , N , (figure 1(a)). The emission of the complete set of 2D tilted plane waves
was then repeated to obtain a continuous dataset.
2.1.2. 2D multi-angle-delay-and-sum beamforming. Beamforming was performed using a multi-angle-delay-and-sum approach. Specifically, pre-defined receive angles determined an associated voxel-dependent sub-aperture that was then used in a standard delay-and-sum beamforming algorithm. This voxel-wise calculation was repeated for each transmit, for each receive angle, and for each volume.
A total number of M receive sub-apertures were defined according to two parameters: the f/D ratio, i.e. the ratio of the imaging depth to the aperture size, and the receive angle
( )
→
= …
kr q, q 1, , M . Given the very large number of possible combinations, M was chosen
according to computational considerations. The resulting output of the beamforming algo-rithm was a matrix of size N × M × nx × ny × nz × nt, where nx, ny, and nz are the number
2.1.3. Clutter filtering. Spatiotemporal clutter filtering (Demene et al 2015) was applied individually to each M × N data pair. This clutter filtering technique uses the singular value decomposition of the column-wise form obtained from beamformed demodulated data to remove clutter artifacts according to the highly discriminative spatiotemporal coherence of tissue compared to blow flow signals.
2.1.4. Velocity vector and volumetric flow rate estimation. A phase-shift matrix (ΦIR) was
calculated using an autocorrelation estimator (Kasai et al 1985), for which the following
relationship holds for one (k→ i p, ,k→r q, ) pair
( ) [ ( ) ( )]
Φ p q x y z t, , , , , =argIQ p q x y z t, , , , , ∗IQ p q x y z t∗ , , , , , −t ,
IR PRF
(1)
IQis the 4D beamformed and demodulated data, x and y are the lateral directions, z is
the depth, t is the instantaneous time, tPRF is the time between each transmitted pulse and
= …
p 1, ,N and q=1, …, M. When multiple (k→ i p, ,k→r q, ) pairs are used, equation (1) amounts
to a system of equations with more equations than unknowns and it can thus be solved using a least-squares fitting approach via a pseudo-inverse operation. A NM×3 matrix, KIR, is thus defined as: ⎡ ⎣ ⎢ ⎢ ⎢ ⎤ ⎦ ⎥ ⎥ ⎥ = + + + + + + K k k k k k k k k k k k k IR i r i r i r i N r M i N r M i r M ,1 ,1 ,1 ,1 ,1 ,1 , , , , ,1 , x x y y z z x x y y z z (2) where indices x, y, and z, indicate the three components of the vectors along the x-, y-, and z-directions. The blood velocity vector, v→( )
x y z, , , can then be obtained by the Doppler frequency shift equation, as follows:
Figure 1. 4D ultrafast ultrasound flow imaging: transmission/receive principle. (a) Emission sequence composed of multiple titled plane waves. (b) Receive beamforming step in which different sub-apertures are defined using a constant f/D ratio and multiple receive angles.
( ) ( ) → ⎡ ⎣ ⎢ ⎢ ⎢ ⎤ ⎦ ⎥ ⎥ ⎥ Φ π = = ⋅ v V V V p K c f N PRF 2 x y z x y z IR IR inv , , 0 (3) where pinv =(K KTIR IR)−1KTIR is the pseudo-inverse matrix, c is the speed of sound, f0 is the
transmitted frequency and PRF is the pulse repetition frequency.
The least squares fitting was shown to be robust to noise in 2D implementations (Ekroll
et al2013, Yiu et al 2014).
The volumetric flow rate was computed by integrating the flux in a region of interest (ROI), i.e. the rate of flow of a property per unit area. Specifically, after segmenting a ROI using B-mode volumes, the dot-product between the velocity vector and the normal vector to the cross-sectional area was integrated throughout the volumetric ROI.
A workflow chart with the description steps of the 4D ultrafast ultrasound flow imaging is given in figure 2.
2.2. Experimental methods
2.2.1. 4D ultrafast imaging hardware. A customized, programmable, 1024-channel
ultra-sound system (Provost et al 2014) was used to drive a 32-by-32 matrix-array probe centered at
8 MHz with a 90% bandwidth at −6 dB, a 0.3 mm pitch and a 0.3 mm element size (Vermon,
France). Briefly, the system was composed of four Aixplorer systems (Supersonic Imagine, France), each of which provided 256 transmit channels and 128 multiplexed receive channels. The four systems were assembled and synchronized which resulted in 1024 channels in trans-mission and 512 multiplexed channels in receive. Since the receive channels were multiplexed
to 1 of 2 transducers elements, each emission was repeated twice to synthetize 1024 channels in reception. Specifically, data from two consecutive identical emissions were concatenated to synthetically create one RF data set, which corresponded approximately to an acquisition in which all transducers had received simultaneously, effectively dividing the maximum PRF by 2.
2.2.2. Imaging sequences parameters. The imaging sequences used for both the in vitro and the in vivo studies were built with similar transmit/receive parameters. Each plane wave was defined by a pair of angles between the normal vector of the plane wave and the x- and y-directions of the matrix-array probe. In this study, all the sequences used the following pairs
in transmission: (−7°,0°) and (0°,7°) at 5 MHz frequency. The number of emissions was
small to achieve a high volume-rate (i.e. the PRF divided by N) to limit aliasing effects. The angles used were chosen to be as large as possible while achieving a 8 × 8 mm2 field-of-view (in which both waves propagate) at the 25 mm depth. The following nine receive angles: (−7°, 0°), (0°, −7°), (−7°, −7°), (−7°, 7°), (7°, 0°), (0°, 7°), (7°, −7°), (7°, 7°) and (0°, 0°) were used. The f/D ratio was chosen constant throughout the volume, and was set to its small-est possible value in this geometry, i.e. 5. The effective PRF was 8050 Hz, which corre-sponded to a volume rate equal to 4030 Hz. The acquisitions lasted 124 ms in vitro and 1.24 s
in vivo, which corresponded to 500 and 5000 volumes, respectively.
2.2.3. In vitro experiments: a vessel phantom study. Experiments to evaluate 3D velocities estimation in a full volume were conducted using a silicon tube-vessel phantom with a 4 mm internal diameter embedded at a 20 mm depth in an 1% agar, 99% propanol water-based gel. A gear pump (model 700-D, ATS Laboratories Inc., USA) supplied steady-state flow circula-tion of blood-mimicking fluid (model 707, ATS Laboratories Inc., USA) at flow rates con-trolled by an industrial flowmeter grade (model 700-D, ATS Laboratories Inc., USA), with
a 2% reading accuracy. An 82° angle between the probe surface and the tube was measured
on the B-mode volume. The technique was evaluated for six different volumetric flow rates.
Table 1 indicates the volumetric flow rates used, along with the corresponding maximum peak
velocities, but also the Nyquist limit criteria.
2.2.4. In vivo experiments: common carotid artery and carotid artery bifurcation assessment. The in vivo feasibility was assessed by imaging the human carotid artery in two healthy volunteers. The ultrasonic sequences complied with the Food and Drug Administra-tion (FDA) requirements (510k Track 3, FDA) regarding the mechanical index (MI) and the
spatial-peak time average (ISPTA) with a derating factor of 0.3 dB cm−1 MHz−1. The MI0.3 and
ISPTA0.3 were 0.2 and 96.8 mW cm−2, respectively, when assuming a repetition time of 1 s. The
temperature increase at the surface of the probe was inferior to temperature uncertainty of the
measurement system (±0.1 °C) during the test sequences.
The experiments were conducted and performed by a trained medical doctor. Prior to the 4D ultrafast acquisitions, a real time bi-plane B-mode imaging was used to achieve correct positioning and visualization of the carotid artery vasculature. Simultaneous ECG acquisi-tions were also performed, and all results were presented with a time origin corresponding to the R-wave.
For the common carotid artery measurements, both the 4D velocity vector distribution and the volumetric flow rate were evaluated in both subjects.
2.2.5. Data processing and analysis. All beamforming and velocity vector estimation pro-cessing were performed offline using a graphical propro-cessing unit (Tesla K40, NVidia, USA)
within a Matlab (The MathWorks Inc., USA) interface. The in vitro and in vivo acquisitions required a total post-processing time of approximately 15 min and 1 h, respectively. This duration included all 4D ultrafast data transfers and calculations, i.e. the beamforming, clut-ter filclut-tering, velocity vector components estimation, segmentation, and volumetric flow rate calcul ation. Calculation times were dependent on imaging depth, imaging sampling, number of transmit/receive angles and the total number of acquired volumes.
A trained medical doctor performed the segmentation used for the calculation of the volu-metric flow rate on B-mode volumes reconstructed using a conventional coherent
compound-ing delay-and-sum beamformcompound-ing (Provost et al 2014) applied onto the same data used for 4D
ultrafast flow imaging. 4D rendering of the 4D ultrafast B-mode volumes and 4D smoothed
velocity vector maps were performed using the volume rendering (i.e. ‘volren’) and the
illumi-nated streamlines functions of the Amira software (6.0.1, Visualization Sciences group, MA, USA), respectively.
Finally, in order to evaluate the precision of the velocity vector estimation, a normalized
autocorrelation coefficient r was computed for each transmit–receive pairs, as follows:
∑
∑
∑
= ∗ − − ∗ r IQ x y z t IQ x y z t Nt IQ x y z t IQ x y z t Nt , , , , , , , , , , , , x y z t t Z Z Z , , , , PRF 2 PRF 2 PRF ( ) ( ) ( ) ( ) ( ) (4) where Z is the axial voxel kernel-size in the z-direction (Z was equal to 5 in this study).3. Results
3.1. In vitro experiment: vessel-phantom validation
Figure 3 presents the results of the in vitro experiment. Figure 3(a) shows the experimental
apparatus. Figure 3(b) shows the velocity vector field rendered using streamlines overlaid
onto the B-mode volumes for one representative volumetric flow rate (160 ml min−1). The
streamlines’ orientation indicated a flow direction aligned with the tube axis and their color
showed velocities that are higher in the center and decrease toward the edges of the vessel, which is consistent with a parabolic flow pattern. Indeed, parabolic profiles can be observed
in figure 3(c) for two representative volumetric flow rates (100 and 290 ml min−1). Note that
parabolic patterns are observed in the surface velocity profiles, but also in the velocity profiles obtained in the center of the tube where larger velocities are observed along the y-direction, indicating the main direction of the flow.
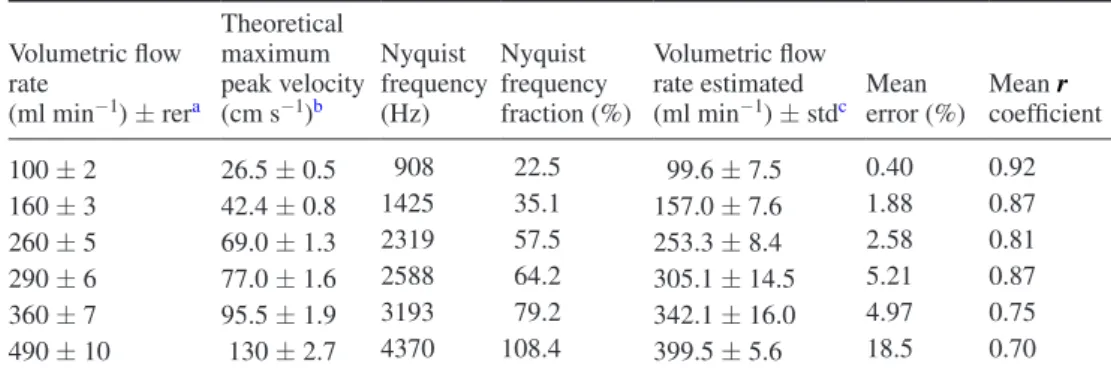
Table 1 shows the volumetric flow rate estimation, their respective mean estimated-error
and mean auto-correlation coefficients for all the measurements.
The volumetric flow rates estimation was in good agreement with the ones measured
exper-imentally by an industrial flowmeter, from 100 to 290 ml min−1. At 360 ml min−1, the
aver-aged volumetric flow rate estimation error was approximately 5%. At 490 ml min−1, the error
made on the flow rate reached 18.5%, which is expected since the associated maximum peak
velocity of 1.3 m s−1 exceeded the Nyquist velocity (i.e. 1.2 m s−1) by 8.4%. These
measure-ments were associated with a decrease of the average auto-correlation coefficient to 0.70.
3.2. In vivo experiment: common carotid artery and carotid artery bifurcation assessment
Figure 4 presents the results of the in vivo common carotid artery experiments. Figure 4(a)
Figure 4(b) shows the velocity vector maps at two time points, i.e. at t = 0.3 s and t = 1.15 s. Figure 4(c) shows the average velocity inside each of the three ROIs of size (1.1 × 1.1 × 0.5)
mm3. ROI A, B, and C were located near the anterior wall, in the center, and near the posterior
wall of the artery, respectively.
Movie 1 (available at: stacks.iop.org/PMB/61/L48/mmedia) shows the corresponding 3D
velocity distribution during an entire cardiac cycle. The direction of the flow was aligned with the vessel axis and the variations observed in the velocity magnitude were consistent with the phases of the cardiac cycle.
Table 2 shows the volumetric flow rate results obtained in the two subjects.
dB cm/s
0 38 0
-30
Flow Rate = 100 ml/min
Flow Rate = 290 ml/min
Flow Rate = 160 ml/min
14 15 16 17 18 Depth [mm] 0 10 20 30 Velocity [cm/s] Theoretical Estimated 14 15 16 17 18 Depth [mm] 0 10 20 30 14 15 16 17 18 Depth [mm] 0 10 20 30 14 15 16 17 18 Depth [mm] 0 10 20 30 14 15 16 17 18 Depth [mm] 0 20 40 60 80 100 Velocity [cm/s] Theoretical Estimated 14 15 16 17 18 Depth [mm] 0 20 40 60 80 100 14 15 16 17 18 Depth [mm] 0 20 40 60 80 100 14 15 16 17 18 Depth [mm] 0 20 40 60 80 100 y [mm] X [mm] Agar Phantom cm/s Depth [mm] 18 16 14 10 y [mm] 5 0 20 30 10 yti col eV ]s/ mc[ 0 5 10 15 20 25 Depth [mm] 18 16 14 10 y [mm] 5 0 20 40 100 60 80 ]s/ mc[ yti col eV 0 20 40 60 80 cm/s (a) (b) (c) 2-D 2-D 0 10 0 10 12 25
Figure 3. In vitro results for three volumetric flow rates. (a) The experimental apparatus. (b) The 3D volume rendering representation of the 160 ml min−1 flow rate. (c) 3D velocity profiles obtained for 100 ml min−1 and 290 ml min−1. The error bars correspond to the standard deviation across the 500 acquired frames. 2D V→ surface velocity profiles are also presented.
dB cm/s 0 100 0 -30 Velocity Profiles 0 0.2 0.4 0.6 0.8 1 1.2 0 20 40 60 80 100 120 Ve locity [cm/s] 0 0.2 0.4 0.6 0.8 1 1.2 0 20 40 60 80 100 120 Ve locity [cm/s] 0 0.2 0.4 0.6 0.8 1 1.2 0 20 40 60 80 100 120 Time [s] Ve locity [cm/s] A B C ± std mean time = 0.3 s time = 1.15 s 1.5-mm 2.4-mm 2.4-mm 1.5-mm 2.4-mm 2.4-mm 3-D Volume Rendering A B C A B C (a) (b) (c) Common Carotid Artery
Figure 4. Common carotid artery flow assessment in one subject. (a) Ultrasound probe positioning and (b) 3D volume rendering in at two different times of the cardiac cycle. (c) Spatially averaged velocity profiles of ROIs A, B, and C.
Table 2. Volumetric flow rate measurements acquired in vivo in two human subjects.
Male subject Female subject
Volumetric flow rate
(ml min−1) ± stda Mean coefficientr Volumetric flow rate (ml min−1) ± stda Mean coefficientr
375 ± 57 0.86 275 ± 43 0.87
astd: standard deviation of the temporal and spatial mean over one cardiac cycle.
Table 1. In vitro volumetric flow rate evaluation.
Volumetric flow rate (ml min−1) ± rera Theoretical maximum peak velocity (cm s−1)b Nyquist frequency (Hz) Nyquist frequency fraction (%) Volumetric flow rate estimated
(ml min−1) ± stdc Mean error (%) Mean coefficientr
100 ± 2 26.5 ± 0.5 908 22.5 99.6 ± 7.5 0.40 0.92 160 ± 3 42.4 ± 0.8 1425 35.1 157.0 ± 7.6 1.88 0.87 260 ± 5 69.0 ± 1.3 2319 57.5 253.3 ± 8.4 2.58 0.81 290 ± 6 77.0 ± 1.6 2588 64.2 305.1 ± 14.5 5.21 0.87 360 ± 7 95.5 ± 1.9 3193 79.2 342.1 ± 16.0 4.97 0.75 490 ± 10 130 ± 2.7 4370 108.4 399.5 ± 5.6 18.5 0.70
a rer: reading error.
b Maximum peak velocities considering a parabolic flow pattern. c std: standard deviation of the arithmetic mean over four acquisitions.
Figure 5 presents the results of the in vivo carotid artery bifurcation experiments. Figure 5(a) shows the positioning of the ultrasound probe used to image the carotid artery bifurcation. Figure 5(b) shows the velocity vector maps at two time points, i.e. at t = 0.4 s and t = 1.1 s and One can note that while a laminar flow is observed at 0.4 s, a vortex flow appeared at 1.1 s, i.e. immediately after peak systole, in the posterior part of the internal carotid artery (ICA). Figure 5(c) shows the average velocity inside each of the three ROIs of size (1.1 × 1.1 × 0.5)
mm3. ROI A, B, and C were located in the external carotid artery (ECA), in the center of the
bifurcation and exist of the CCA, and in the ICA, respectively. It should be noted that the velocity profiles varied from one ROI to another due to the different sizes and orientations of the branches, which in turn lead to different volumetric flow rates.
Movie 2 (available at: stacks.iop.org/PMB/61/L48/mmedia) shows the corresponding 3D
velocity distribution during an entire cardiac cycle. The flow is directed toward the external and ICA branches. Flow patterns differed during the cardiac cycle. Indeed, while laminar flow occurred during diastole, a vortex was visible during systole in the ICA branch.
4. Discussion
In this study, we introduced and demonstrated the feasibility of performing 4D ultrafast ultra-sound flow imaging. More specifically, we have developed the experimental methods for volumetric blood flow imaging, evaluated the technique accuracy and precision in vitro in a tube-vessel phantom, and we have showed the in vivo feasibility in the human carotid artery.
We have imaged the complete volumetric blood velocity vector distribution using 2D steered plane wave emissions at high frame-rates and a 3D multi-angle cross-beam Doppler
dB cm/s 0 100 0 -30 0 0.2 0.4 0.6 0.8 1 1.2 0 20 40 60 80 100 120 Ve locity [cm/s] 0 0.2 0.4 0.6 0.8 1 1.2 0 20 40 60 80 100 120 Ve locity [cm/s ] 0 0.2 0.4 0.6 0.8 1 1.2 0 20 40 60 80 100 120 Time [s] Ve locity [cm/s] B A Velocity Profiles ECA CCA ICA C ± std mean (a) (b) (c) 3-D Volume Rendering time = 0.40 s 1.5-mm 2.4-mm 2.4-mm A B C A B C Zoom box vortex time = 1.1 s 1.5-mm 2.4-mm 2.4-mm Carotid Artery Bifurcation
Figure 5. Carotid artery bifurcation results. (a) Ultrasound probe positioning and (b) 3D volume rendering in at two different times of the cardiac cycle. At time t = 1.1 s, a vortex formation was imaged at internal carotid artery (ICA). (c) Spatially averaged velocity profiles in each ROI.
method, in which a large number of parameter combinations was possible. Indeed, the number and orientation of the transmit/receive angles, as well as the f/D ratio could be chosen. We
used a sequence of two 7° plane wave emissions. The small number of emissions (i.e. two)
allowed for the imaging without aliasing of the expected maximum peak velocities
distribu-tion of the targeted clinical applicadistribu-tion, i.e. the carotid artery. The tilt angle (i.e. 7°) was
chosen to be as large as possible, within element directivity limits, to enhance the precision of the velocity vector (Yiu et al 2014) while allowing for a sufficiently large field of view (i.e.
8 × 8 mm2) in which all waves propagated at the required 25 mm depth. We used nine angles
with a f/D ratio equal to 5 as a compromise between the sensitivity, which is linked to the sub-aperture size, the precision, linked to the tilt angle, and the computational considerations, i.e. memory and speed. A complete and quantitative optimization of this large parameter space is beyond the scope of this study but is the subject of on-going work.
4D ultrafast ultrasound flow imaging was evaluated in vitro in a silicon tube-vessel phan-tom at different volumetric flow rates. An excellent agreement with the theoretical velocity profiles and volumetric flow rates was found in the axial cross-section for velocities below the Nyquist velocity. A flow rate error of less than approximately 5% was achieved for flow
rates below 360 ml min−1, which corresponded to a velocity of 100 cm s−1. When exceeding
the Nyquist velocity, e.g. when the flow peak velocity exceeded 1.2 m s−1, the error increased
rapidly to 18.3%, which was also associated to a reduced auto-correlation coefficient. 4D ultrafast ultrasound flow imaging was then performed in vivo in the carotid artery of two healthy volunteers. The peak velocities were found to be in agreement with the velocities
meas-ured in previous studies using magnetic resonance imaging (MRI) (Harloff et al 2009) or with
2D ultrasound-based techniques (Holdsworth et al 1999, Udesen et al 2007, Jensen 2014, Fadnes
et al2015, Osmanski et al 2015). Similarly, the volumetric flow rates obtained were found to be in
good agreement with the ones reported in the literature (Steinman et al 2002, Marshall et al 2004, Likittanasombut et al 2006). Finally, we imaged turbulent flow patterns at the carotid artery bifur-cation. While it has been shown by 2D ultrasound velocity vector imaging techniques that such vortices can appear in the ICA during approximately 100 ms before the onset of diastole (Udesen
et al2007), it had not been imaged in 4 dimensions using ultrasound imaging.
4D ultrafast blood flow imaging may allow for the operator-independent, non-invasive, and direct determination of arterial volumetric flow rate. In clinical practice, the estimation of volumetric flow rates cannot be performed accurately with ultrasound imaging and is cur-rently estimated by indirect measurements including the luminal cross-sectional area and the
mean spatial velocity that induce important estimation errors (Hoskins 1990). Moreover, in
contrast to MR flow imaging, 4D ultrafast ultrasound flow imaging could be used in a daily practice and at bedside.
4D ultrafast ultrasound flow imaging was developed for the angle-independent mapping of the 3D blood flow velocities distribution in contrast to the clinically used conventional angle-dependent ultrasound Doppler imaging. In a recent study, in vitro 3D velocity vector mapping was achieved with high temporal resolution by a 3D transverse-oscillations technique (Pihl
et al2014), but it was limited to two 2D planes rather than obtained in an entire 3D volume.
Also, the V-echo-PIV technique (Falahatpisheh and Kheradvar 2016) provided 3D maps of
all three components of the velocity vector in the heart in vivo, but this technique was limited
by the imaging volume rate (i.e. 30 volumes s−1) and a contrast-agents injection requisite. In
order to achieve 4D blood flow imaging, a 4D ultrafast ultrasound imaging prototype with 1024 electronic channels was used in this study. Such a high channel count system is required to perform 2D tilted plane wave emissions at high frame rates and 3D multi-angle cross-beam cross-beamforming. To the best of our knowledge, only two research systems have cur rently these capabilities (Jensen et al 2013, Provost et al 2014). We can envision however, that such
systems will be increasingly available with the recent development of high channel count
electronics commercially available (Flynn et al 2011).
Current limitations include the choice and the number of the transmitted tilted angles to the specific clinical application and imaging field-of-view, and the need for manual segmen-tation for the determination of the volumetric flow rate. However, automatic segmensegmen-tation algorithms could be used to provide a fully user-independent flow rate measurement. In order to improve the precision of high velocity estimation, the volumetric rate would need to be increased, which could be done using 1024 simultaneous electronic receive channels, which would double the Nyquist velocity. Inversely, it would also allow the use of a larger number of plane wave emissions to increase the precision of the velocity vector estimation.
5. Conclusion
4D ultrafast ultrasound flow imaging can map in 3D velocity vectors of blood flow in large arteries at high temporal resolution. Its precision and accuracy were respectively evaluated both in terms of velocity and volumetric flow rate measurements in vitro and its feasibility was demonstrated in vivo in the human carotid artery. 4D ultrafast ultrasound flow imaging could become a diagnostic imaging tool for the real-time evaluation of arterial blood flows in clinical practice.
Acknowledgments
This work was supported by the European Research Council under the European Union’s
Seventh Framework Programme (FP/2007–2013)/ERC Grant Agreement no. 311025 and the
ANR-10-IDEX-0001-02 PSL* Research University.
References
Bercoff J, Montaldo G, Loupas T, Savery D, Mézière F, Fink M and Tanter M 2011 Ultrafast compound Doppler imaging: providing full blood flow characterization IEEE Trans. Ultrason. Ferroelectr.
Freq. Control58 134–47
Bohs L N, Geiman B J, Anderson M E, Gebhart S C and Trahey G E 2000 Speckle tracking for multi-dimensional flow estimation Ultrasonics 38 369–75
Capineri L, Scabia M and Masotti L 2002 A Doppler system for dynamic vector velocity maps
Ultrasound Med. Biol.28 237–48
Demene C, Deffieux T, Pernot M, Osmanski B-F, Biran V, Franqui S, Correas J-M, Cohen I, Baud O and Tanter M 2015 Spatiotemporal clutter filtering of ultrafast ultrasound data highly increases Doppler and fUltrasound sensitivity IEEE Trans. Med. Imaging 342271–85
Dunmire B, Beach K W, Labs K-H, Plett M and Strandness D E 2000 Cross-beam vector Doppler ultrasound for angle-independent velocity measurements Ultrasound Med. Biol.
26 1213–35
Ebbini E S 2006 Phase-coupled two-dimensional speckle tracking algorithm IEEE Trans. Ultrason.
Ferroelectr. Freq. Control53 972–90
Ekroll I K, Swillens A, Segers P, Dahl T, Torp H and Lovstakken L 2013 Simultaneous quantification of flow and tissue velocities based on multi-angle plane wave imaging IEEE Trans. Ultrason.
Ferroelectr. Freq. Control60 727–38
Fadnes S, Ekroll I K, Nyrnes S A, Torp H and Lovstakken L 2015 Robust angle-independent blood velocity estimation based on dual-angle plane wave imaging IEEE Trans. Ultrason. Ferroelectr.
Freq. Control62 1757–67
Falahatpisheh A and Kheradvar A 2016 Ultrasound-based volumetric particle tracking method
Falahatpisheh A, Pedrizzetti G and Kheradvar A 2014 Three-dimensional reconstruction of cardiac flows based on multi-planar velocity fields Exp. Fluids 55 1848
Flynn J, Daigle R, Pflugrath L, Linkhart K and Kaczkowski P 2011 Estimation and display for vector Doppler imaging using planewave transmissions 2011 IEEE Int. Ultrasonics Symp. (Orlando, FL) pp 413–8
Hansen K L, Møller-Sørensen H, Pedersen M M, Hansen P M, Kjaergaard J, Lund J T, Nilsson J C, Jensen J A and Nielsen M B 2015 First report on intraoperative vector flow imaging of the heart among patients with healthy and diseased aortic valves Ultrasonics 56 243–50
Harloff A et al 2009 3D blood flow characteristics in the carotid artery bifurcation assessed by flow-sensitive 4D MRI at 3 T Magn. Reson. Med. 61 65–74
Holbek S, Pihl M J, Ewertsen C, Nielsen M B and Jensen J A 2015 In vivo 3D vector velocity estimation with continuous data 2015 IEEE Int. Ultrasonics Symp. (IUS) (Taipei) pp 1–4
Holdsworth D W, Norley C J D, Frayne R, Steinman D A and Rutt B K 1999 Characterization of common carotid artery blood-flow waveforms in normal human subjects Physiol. Meas. 20 219–40
Hoskins P R 1990 Measurement of arterial blood flow by Doppler ultrasound Clin. Phys. Physiol. Meas.
11 1–26
Jensen J 2014 Transverse spectral velocity estimation IEEE Trans. Ultrason. Ferroelectr. Freq. Control
61 1815–23
Jensen J A 2003 Directional velocity estimation using focusing along the flow direction. I: theory and simulation IEEE Trans. Ultrason. Ferroelectr. Freq. Control 50 857–72
Jensen J A et al 2013 SARUS: a synthetic aperture real-time ultrasound system IEEE Trans. Ultrason.
Ferroelectr. Freq. Control60 1838–52
Kasai C, Namekawa K, Koyano A and Omoto R 1985 Real-time two-dimensional blood flow imaging using an autocorrelation technique IEEE Trans. Sonics Ultrason. 32 458–64
Likittanasombut P, Reynolds P, Meads D and Tegeler C 2006 Volume flow rate of common carotid artery measured by Doppler method and color velocity imaging quantification (CVI-Q) J. Neuroimaging
16 34–8
Lovstakken L, Bjaerum S, Martens D and Torp H 2006 Blood flow imaging—a new real-time, flow imaging technique IEEE Trans. Ultrason. Ferroelectr. Freq. Control 53 289–99
Macé E, Montaldo G, Cohen I, Baulac M, Fink M and Tanter M 2011 Functional ultrasound imaging of the brain Nat. Methods 8 662–4
Makita S, Fabritius T and Yasuno Y 2008 Quantitative retinal-blood flow measurement with three-dimensional vessel geometry determination using ultrahigh-resolution Doppler optical coherence angiography Opt. Lett. 33 836
Markl M, Frydrychowicz A, Kozerke S, Hope M and Wieben O 2012 4D flow MRI J. Magn. Reson.
Imaging36 1015–36
Marshall I, Papathanasopoulou P and Wartolowska K 2004 Carotid flow rates and flow division at the bifurcation in healthy volunteers Physiol. Meas. 25 691–7
Osmanski B-F, Montaldo G and Tanter M 2015 Out-of-plane Doppler imaging based on ultrafast plane wave imaging IEEE Trans. Ultrason. Ferroelectr. Freq. Control 62 625–36
Osmanski B-F, Pernot M, Montaldo G, Bel A, Messas E and Tanter M 2012 Ultrafast Doppler imaging of blood flow dynamics in the myocardium IEEE Trans. Med. Imaging 31 1661–8
Pihl M J and Jensen J A 2014 A transverse oscillation approach for estimation of three-dimensional velocity vectors, part I: concept and simulation study IEEE Trans. Ultrason. Ferroelectr. Freq.
Control61 1599–607
Pihl M J, Marcher J and Jensen J A 2012 Phased-array vector velocity estimation using transverse oscillations IEEE Trans. Ultrason. Ferroelectr. Freq. Control 59 2662–75
Pihl M J, Stuart M B, Tomov B G, Rasmussen M F and Jensen J A 2014 A transverse oscillation approach for estimation of three-dimensional velocity vectors, part II: experimental validation IEEE Trans.
Ultrason. Ferroelectr. Freq. Control61 1608–18
Provost J, Papadacci C, Arango J E, Imbault M, Fink M, Gennisson J-L, Tanter M and Pernot M 2014 3D ultrafast ultrasound imaging in vivo Phys. Med. Biol. 59 L1–13
Provost J, Papadacci C, Demene C, Gennisson J-L, Tanter M and Pernot M 2015 3-D ultrafast Doppler imaging applied to the noninvasive mapping of blood vessels in vivo IEEE Trans. Ultrason.
Ferroelectr. Freq. Control621467–72
Sandrin L, Catheline S, Tanter M, Hennequin X and Fink M 1999 Time-resolved pulsed elastography with ultrafast ultrasonic imaging Ultrason. Imaging 21 259–72
Srinivasan V J, Sakadzić S, Gorczynska I, Ruvinskaya S, Wu W, Fujimoto J G and Boas D A 2010 Quantitative cerebral blood flow with optical coherence tomography Opt. Express 18 2477–94
Steinman D A, Thomas J B, Ladak H M, Milner J S, Rutt B K and Spence J D 2002 Reconstruction of carotid bifurcation hemodynamics and wall thickness using computational fluid dynamics and MRI Magn. Reson. Med. 47 149–59
Tanaka M, Sakamoto T, Sugawara S, Nakajima H, Katahira Y, Ohtsuki S and Kanai H 2008 Blood flow structure and dynamics, and ejection mechanism in the left ventricle: analysis using echo-dynamography J. Cardiol. 52 86–101
Tanaka T, Asami R, Kenichi K, Keiichi I, Tokuhisa U, Nishiyama T and Okada T 2015 Intracardiac VFM technique using diagnostic ultrasound system Hitachi Rev. 64 489 (www.hitachi.com/rev/ pdf/2015/r2015_08_110.pdf)
Tanter M, Bercoff J, Sandrin L and Fink M 2002 Ultrafast compound imaging for 2D motion vector estimation: application to transient elastography IEEE Trans. Ultrason. Ferroelectr. Freq. Control
49 1363–74
Tanter M and Fink M 2014 Ultrafast imaging in biomedical ultrasound IEEE Trans. Ultrason. Ferroelectr.
Freq. Control61 102–19
Tortoli P, Bambi G and Ricci S 2006 Accurate Doppler angle estimation for vector flow measurements
IEEE Trans. Ultrason. Ferroelectr. Freq. Control53 1425–31
Udesen J and Jensen J A 2006 Investigation of transverse oscillation method IEEE Trans. Ultrason.
Ferroelectr. Freq. Control53 959–71
Udesen J, Nielsen M B, Nielsen K R and Jensen J A 2007 Examples of in vivo blood vector velocity estimation Ultrasound Med. Biol. 33 541–8
Xu T and Bashford G 2013 Two-dimensional blood flow velocity estimation using ultrasound speckle pattern dependence on scan direction and A-line acquisition velocity IEEE Trans. Ultrason.
Ferroelectr. Freq. Control60 898–908
Yiu B Y S, Lai S S M and Yu A C H 2014 Vector projectile imaging: time-resolved dynamic visualization of complex flow patterns Ultrasound Med. Biol. 40 2295–309