HAL Id: hal-00295319
https://hal.archives-ouvertes.fr/hal-00295319
Submitted on 27 Aug 2003
HAL is a multi-disciplinary open access
archive for the deposit and dissemination of
sci-entific research documents, whether they are
pub-lished or not. The documents may come from
teaching and research institutions in France or
abroad, or from public or private research centers.
L’archive ouverte pluridisciplinaire HAL, est
destinée au dépôt et à la diffusion de documents
scientifiques de niveau recherche, publiés ou non,
émanant des établissements d’enseignement et de
recherche français ou étrangers, des laboratoires
publics ou privés.
Charging of ice-vapor interfaces: applications to
thunderstorms
J. Nelson, Mark D. Baker
To cite this version:
J. Nelson, Mark D. Baker. Charging of ice-vapor interfaces: applications to thunderstorms.
At-mospheric Chemistry and Physics, European Geosciences Union, 2003, 3 (4), pp.1237-1252.
�hal-00295319�
Atmos. Chem. Phys., 3, 1237–1252, 2003
www.atmos-chem-phys.org/acp/3/1237/
Atmospheric
Chemistry
and Physics
Charging of ice-vapor interfaces: applications to thunderstorms
J. Nelson1and M. Baker2
1Nelson Scientific, 7-13-8 Oginosato Higashi, Otsu, Shiga 520-0248, Japan
2Depts of Earth and Space Science and Atmospheric Sciences, University of Washington, Seattle, WA 98195-1310 USA Received: 11 September 2002 – Published in Atmos. Chem. Phys. Discuss.: 6 January 2003
Revised: 8 May 2003 – Accepted: 25 July 2003 – Published: 28 August 2003
Abstract. The build-up of intrinsic Bjerrum and ionic
de-fects at ice-vapor interfaces electrically charges ice surfaces and thus gives rise to many phenomena including thermo-electricity, ferroelectric ice films, sparks from objects in bliz-zards, electromagnetic emissions accompanying cracking in avalanches, glaciers, and sea ice, and charge transfer dur-ing ice-ice collisions in thunderstorms. Fletcher’s theory of the ice surface in equilibrium proposed that the Bjerrum de-fects have a higher rate of creation at the surface than in the bulk, which produces a high concentration of surface D de-fects that then attract a high concentration of OH−ions at the surface. Here, we add to this theory the effect of a moving interface caused by growth or sublimation. This effect can increase the amount of ionic surface charges more than 10-fold for growth rates near 1 µm s−1and can extend the spatial separation of interior charges in qualitative agreement with many observations. In addition, ice-ice collisions should generate sufficient pressure to melt ice at the contact region and we argue that the ice particle with the initially sharper point at contact loses more mass of melt than the other parti-cle. A simple analytic model of this process with parameters that are consistent with observations leads to predicted col-lisional charge exchange that semiquantitatively explains the negative charging region of thunderstorms. The model also has implications for snowflake formation, ferroelectric ice, polarization of ice in snowpacks, and chemical reactions in ice surfaces.
Correspondence to: J. Nelson
1 Introduction
Electrical charging at the ice-vapor interface is revealed di-rectly by surface potentials (Caranti and Illingworth, 1980) and high surface conductivities (Maeno, 1973), as well as being revealed indirectly by processes involving triboelec-trification (Petrenko and Colbeck, 1995), ferroelectricity (Iedema et al., 1998), crystal growth (Rydock and Williams, 1991), temperature gradients (Jaccard, 1964), creation of new surfaces (Fifolt et al. 1992), and electrical attraction of ice crystals to other surfaces (Ohtake and Suchannek, 1970). Such charging can cause ice crystals to orient (Von-negut, 1965) and possibly levitate (Gibbard et al., 1995) in the electrical atmosphere of thunderclouds. Surface charg-ing can modify many atmospheric processes such as col-lection of ions, aerosols, and droplets by ice (Martin et al. 1980; Pruppacher and Klett, 1980 p. 619), and aggrega-tion of snow crystals in clouds (Odencrantz and Buecher, 1967; Finnegan and Pitter, 1988) and in wind-blown snow (Schmidt, 1982). The transfers of charge when an ice parti-cle strikes another ice surface or another material are exam-ples of contact charging involving electronic insulators, one of the oldest problems of an electrical nature (Castle, 1997). For example, static discharges occur when snow particles re-coil from wires and aircraft (Ives, 1938; FAA, 2001). But the most spectacular outcome of the contact charging of ice oc-curs in thunderstorms when mm-sized ice particles formed from accreted supercooled drops, hereafter graupel, fall at speeds exceeding 5 m s−1and strike small, uplifting ice crys-tals (Illingworth, 1985). About 20 fC per collision is trans-ferred from one to the other, leading to powerful in-cloud electric fields and often lightning, thus maintaining Earth’s electrical circuit. We present a simple analytic model that is consistent with these wide-ranging observations and which allows speculation that the same processes can lead to light-ning on Jupiter (Gibbard et al. 1995) and elsewhere in the solar system.
c
1238 J. Nelson and M. Baker: Charging of ice-vapor interfaces D f e d c b a 6 5 4 3 2 1 H3O+ L OH- polarization
before move polarizationafter move qD
qL
proton after move proton before move fixed proton fixed oxygen ion
in-layer chemical bond inter-layer bond (in page) inter-layer bond (out)
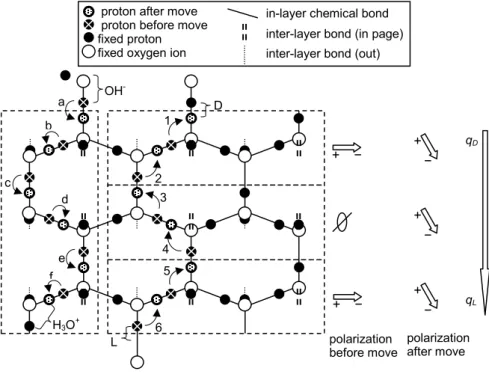
Fig. 1. Idealized sketch of fundamental charging processes in an ice lattice. The three dashed, stacked boxes on the right show the creation
of a D and L defect by the rotation of an H2O molecule and the subsequent downward migration of the L along a prism plane of ice. Before
step 1, “fixed protons” and “protons before move” produce net dipole moments that are neither up nor down in all three boxes as shown to the right (e.g., compare protons above and below a horizontal line in the middle of a box). After step 1, the top bond has a D defect (2 protons) and the bond below and left has an L defect (no protons). Step 2 moves a proton to the empty bond created by step 1 thus moving the L defect down. After 6 such moves, all three boxes have net polarization pointing down. Thus, the ice effectively has net positive charge
qDon top and negative charge on bottom; this holds even if, as theory predicts, the 2 protons in a D defect are not collinear and the defects
distort the lattice. (Indeed, the middle and lower boxes would be polarized even if the D was not present.) The dashed, vertical box on the left shows the creation of an OH−and H3O+by the shift of a proton along a hydrogen bond (step a) and the subsequent downward migration
of H3O+in b–f. Inspection of the latter path of bonds shows that the passage of H3O+through the lattice also polarized the lattice. For this
reason, the effective charge of OH−in ice qOHis −0.62e, not e.
2 Physical basis and approach
Jaccard (1964) developed a microscopic theory of the elec-trical properties of ice that uses the conservation equations for ions OH− and H3O+ and Bjerrum D and L defects to explain ice thermoelectricity with and without impurities. D and L defects, which are respectively double and empty bonds between H2O molecules, are the majority charge car-riers in bulk ice and are responsible for the fact that ice’s static relative permittivity exceeds 100 below 0◦C. Unlike the ions, the Bjerrum defects create internal electric fields via their polarization of the ice lattice as they migrate such that the D defect effectively has a positive charge and L is negative (Fig. 1). Because D and L charges arise from rota-tions of H2O molecules that violate the ice rules, they are not free charges and cannot transfer charge in collisions. How-ever, because their bulk concentrations are about 106 times those of the water ions at equilibrium (Petrenko and Whit-worth, 1999; hereafter PW, pg. 154), they greatly influence the electric field inside ice. This is supported by
experimen-tal evidence that suggests Bjerrum defects are important for ice surface charging: collisional charge exchange, presum-ably due to OH−, increases with ice crystal growth rate even though surface potential measurements, which would detect the neutralization between the OH−and D, have little depen-dence on growth rate (Caranti and Illingworth, 1980). The same surface potential measurements show the ice-vapor in-terface to be positive, which would not occur if the surface contained only OH−.
Our model is built on the fundamental physical ideas of Jaccard theory but is not sensitive to the molecular structure of Bjerrum defects; we require only their effective charges and mobilities that have been inferred from numerous ex-periments summarized in PW (pg. 154). Because the ice-vapor interface has anomalous structural and electrical prop-erties, Jaccard’s model must be supplemented with a descrip-tion of the surface. The oft-used surface disorder theory in Fletcher (1968) predicts that the surface region has a low activation energy for the creation of D and L. According to Fletcher, forces from dipole-quadrupole interactions push
J. Nelson and M. Baker: Charging of ice-vapor interfaces 1239
Table 1a. Relevant electrical properties of ice
# Experimentally established property 1 A high static relative permittivity∗. 2 Thermoelectric effect†.
3 High surface dc conductivity in equilibrium‡.
4 Interior ionic charge separation Q over entire crystal during growth§. 5 Surface potential insensitive to vapor growth or sublimation††. 6 Surface dc conductivity increases during sublimation‡. 7 Q greater during growth than in equilibrium∗∗.
∗Johari (1981) and references therein. †Jaccard (1964)
‡Maeno (1973)
§ Inferred from the frost growth experiments of Rydock and Williams (1991), Dong and Hallett (1992), and Latham (1963). These
experiments indicate an excess of OH−at the surface for growing frost and an excess of H3O+at the surface during sublimation. ††Caranti and Illingworth (1980)
∗∗Williams et al.’s (1991) interpretation of Latham’s (1963) experiments.
Table 1b. Relations of charge transfer to graupel 1Q from laboratory experiments
# Observed relation explained by the model
1 1Qmostly independent of physical properties of the flatter surface†. 2 1Q∝U†.
3 Variable 1Q under same conditions; 1Q<0 even occurs in 1Q>0 regime†. 4 1Q∝Dmwith m=2 for spheres†, m≈0.6-0.8 for vapor-grown ice∗.
5 1Qpeaks near T = − 15◦C for vapor-grown crystals‡.
6 In equilibrium, 1Q smaller for vapor-grown ice crystals than for spheres§. 7 1Q>0 when vapor-grown ice crystals are sublimating††.
8 For T < − 10◦C, 1Q<0 regime for ρl≈0.3 − 3 g m−3, 1Q>0 regime at other ρl‡.
9 1Qincreases for ice doped with NH3, but reverses sign with HF doping∗∗.
Based on experiments with ice spheres (rtp=Rcr=D/2) and vapor-grown ice (rtp Rcr<D/2) impacting graupel. D is the maximum
crystal dimension, U is the impact speed, and T is the ambient temperature. In relation #s 5 and 8, the experimental clouds had cloud liquid water of density ρl; in all others, ρl∼0.
†GI (relation #s 1, 2, 3, 4) and Marshall et al. (1978) (relation #s 1, 2, 3) for 1Q<0 regime and data in Illingworth and Caranti (1985)
(relation #1).
∗
Keith and Saunders (1990)
‡Takahashi (1978) (relation #s 5 and 8) and Berdeklis and List (2001) (relation #5)
§Compare data in GI to reports of almost no charging when only vapor-grown crystals strike graupel (i.e., ρ
l≈0 so v=0 in Takahashi, 1978
and Baker et al., 1987)
††Saunders et al. (2001) ∗∗Buser and Aufdermaur (1977)
the D defects to the outermost surface layer where their pro-tons point out of the surface and similarly push L defects in-ward. This surface polarization pulls OH−ions to the surface thus leading to a high surface dc conductivity. Petrenko and Ryzhkin (1997), hereafter PR, argue that the surface traps D defects, which is consistent with Fletcher’s result. The fit of the PR model to the measured surface potential and surface conductivities predicts equilibrium surface concentrations of
Bjerrum and ionic defects that are respectively 106and 1011 times the bulk concentrations.
Many attempts have been made to explain the charging of ice during growth and the subsequent contact charging dur-ing collisions. Several of these invoke the fact that the H3O+ ion is much more mobile than OH−in ice (Jaccard, 1964; PW, p. 154), so that charge separation occurs when the ions move down concentration or field gradients at different rates.
1240 J. Nelson and M. Baker: Charging of ice-vapor interfaces
Fig. 2: Concentrated charge regions within ice without growth or sublimation
(‘equilibrium’ on left) and during growth at speed v (right). (Dotted lines frame
imaginary ‘windows’ to the ice interior.) In equilibrium, the interior L and H
3O
+charges are very near the surface (left; only charges on top surface shown),
whereas they are effectively driven towards the crystal center during growth
(right). Growth also increases surface D and OH
-as described in the text. Net
ionic charge Q and maximum crystal size D are marked on the right.
OH -D H3O+ L D OH- -Q -Q +Q +Q v H3O+ L v OH -H3O+ L OH -D
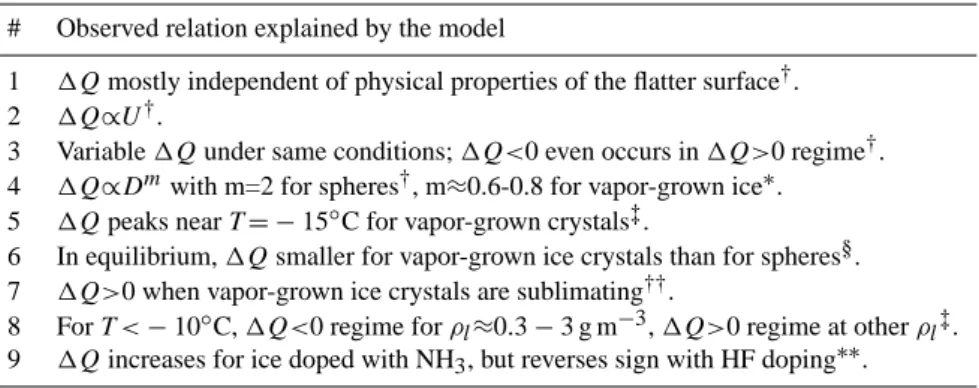
Fig. 2. Concentrated charge regions within ice without growth or
sublimation (“equilibrium” on left) and during growth at speed v (right). (Dotted lines frame imaginary “windows” to the ice inte-rior.) In equilibrium, the interior L and H3O+ charges are very
near the surface (left; only charges on top surface shown), whereas they are effectively driven towards the crystal center during growth (right). Growth also increases surface D and OH− as described in the text. Net ionic charge Q and maximum crystal size D are marked on the right.
But we focus here on two new aspects to this problem. One is a “sweeping” effect caused by the moving ice surface when ice grows or sublimates (an example of a “Stefan” moving boundary problem), which can increase or decrease the nega-tive surface charge depending on whether growth or sublima-tion occurs. The second aspect is the well-known property of ice to melt under pressure: when the corner of an ice crystal strikes another surface, the force of the collision can produce melt that is then pushed to the side, due to the pressure gra-dient, and onto the graupel. This process transfers charge to the graupel, leading to large-scale charge separation in thunderclouds. However, the complex ice-atmospheric en-vironment in nature and in experiments makes it difficult to quantitatively compare theory to most ice-charging-related studies. Nevertheless, we use the model to explain the more reliable trends that are listed in Tables 1a and b. Furthermore, we use measured ice crystal vapor growth rates and reason-able estimates of two collision parameters to show that our model semi-quantitatively agrees with experiments that sim-ulate thunderstorm charging.
3 Surface charging during growth or sublimation
We assume the ionic and Bjerrum carriers are created and recombined in pairs and migrate in the ice. To treat both “equilibrium” (stationary surface) and nonequilibrium
(mov-ing surface), we write the equations in a reference frame moving with the surface at speed v, where v is positive, neg-ative, or zero corresponding to growth, sublimation, or equi-librium. Thus, when v>0, even without the defects hopping between lattice sites, there is an effective flux of defects to-wards the ice interior. This “sweeping” flux is vd(x) for D, where d(x) is the number concentration of D. d(x) obeys the following continuity equation with x being the distance from the surface:
∂d/∂t =FB−dl/(<l>τB)−∂jD/∂x, (1)
where FBis the creation rate of Bjerrum D and L pairs, l(x) is the L concentration with bulk average <l>, τBis the time scale for D and L to recombine to reach steady state, and jD is the number flux of D into the crystal. The units and ap-proximate values of all symbols are in Appendix A. Because D is much less mobile than the other three defects (PW, p. 154), we simplify the problem by assuming D is immobile. Thus, jD=vd. For the other three defects, the flux includes diffusion and drift in an electric field E. In particular, the concentration h−of the OH−ion follows
∂h−/∂t =FI−h−h+/(<h>τI)−∂jOH/∂x (2)
with
jOH=−DOH∂h−/∂x−µOHEh−+vh−, (3)
where DOH is the diffusion constant, µOH is the mobility of OH−, and E is the electric field. Similar equations hold for the L defects and H3O+ion concentration h+with the obvious substitutions.
Because the mobilities of all four defects are included, the model is consistent with the high static relative permittivity of ice. Moreover, numerical solutions of the equations for macroscopic pieces of ice (not shown) agree well with the thermoelectric effect in pure ice. Thus, this model is con-sistent with entries 1–2 of Table 1a. Following Fletcher, we assume a low activation energy of D and L at the surface, which results in an excess of surface D over L that attracts a high concentration of OH−to the surface (Fig. 2) thus pro-ducing a high dc surface conductivity (entry 3, Table 1a).
The bulk concentrations <d> and <l> of defects D and L are about 106times the bulk ion densities. Hence, in the bulk, a change of D or L by only 10−4% would create an electric field that is comparable to that of a change of OH−or H3O+ by 100%. Thus, we focus first on D and L, and then as-sume the ions respond to the E-field perturbation δE created by the change in D and L. This is analogous to Fletcher’s ap-proach to estimate the ionic charging of the ice surface. More importantly, the assumptions allow us to construct a simple analytic model that preserves the basic physical properties of the charge transfer mechanism, and, as we show below, the model is in semi-quantitative agreement with observed charge transfer trends. In steady state, Eq. (1) predicts
J. Nelson and M. Baker: Charging of ice-vapor interfaces 1241 d (x′) d (x′+∆x′) d0(x) d (x) v∆t (sweeping in ∆t) ∆t (FB- d (x′)l(x′)/<l>τB) (net recombination in ∆t) x x′+∆x′ x′ surface
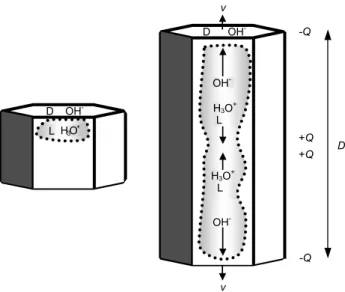
Fig. 3. Mechanism by which creation-recombination and the sweeping flux due to growth increases the D concentration d(x) near the
surface. In time 1t growth adds a layer of thickness v1t, thus effectively sweeping charge d(x0)at point x0a distance 1x0=v1tfrom the surface. In this time, net recombination removes an amount 1t (FB−d(x0)l(x0)/<l>τB).
Thus, creation-recombination balance does not occur during growth. Even when v is very small, the product on the LHS of Eq. (4) can be significant because d0would roughly equal the equilibrium value d00, which is very large near the surface. The equilibrium concentration d0(x)decays rapidly with distance x (PR). For simplicity, we assume
d0(x)=d0(0) exp[−x/1D], (5)
where the length scale 1D is expected to be much less than 1 µm. We also assume l(x)=<l>. Later, we will show that this assumption underestimates the charging. The advantage of this assumption is that it allows us to avoid solving a nonlinear, integro-differential equation. Assuming d(x)=aexp[−x/1D]and solving for a,
d(x)=d0(0) exp[−x/1D]/(1 − vτB/1D). (6)
Thus, the charge profile due to growth or sublimation δd is
δd(x) ≡ d(x) − d0(x)
= −vτBd00(x)/(1 − vτB/1D), (7)
where the latter equality follows from Eq. (5). Hereafter, all deviations from equilibrium are represented by the symbol δ. Physically, δd(x)>0 at the surface during growth because the advancing surface effectively “sweeps” surface D inward (d00(x)<0 at the surface), and thus d(x) must increase until the recombination rate balances this effective flux (Fig. 3). A distinctive and important property of sweeping (i.e., vd, vl) is its action on all parts of a crystal; growth pushes L towards the crystal center as D builds up near the surface. This large-scale polarization sets up an electric field that pulls more
OH− ions to the surface and pushes H30+ions towards the crystal center (Fig. 2) in accord with entry 4 in Table 1a. The opposite occurs during sublimation.
By integrating δd(x) over x, the total D charge per area δσDis
δσD= −qDvτBd0(0)/(1 − vτB/1D), (8)
where qD is the effective charge on the D defect. To es-timate τB we used a simple electrostatic model to estimate how rapidly a lone L defect is pulled to an immobile D de-fect. Without giving the details, we just state the result here:
τB≈6ε0ε∞/µLqL<l>, (9)
where µLis the mobility of L with effective charge qLand ε∞is the high-frequency permittivity. Using recommended values in the appendix, τB≈4.6 × 10⁻⁵s at T =−20◦C. With this τBand 1D>3 × 10⁻¹⁰m (∼1 crystal layer), the denom-inator in Eqs. (7) and (8) are about 1 for any vapor growth speed v in the atmosphere. Hereafter, we assume the denom-inator is unity.
The distribution of perturbed OH−charge δh−at the sur-face is also important. To estimate the thickness of the OH− region that forms in response to δσD, we assume that the perturbed OH− flux δjOH=vh−, a relation that is exact at the surface but is of unknown accuracy in the interior. Thus, from Eq. (3)
DOH∂δh−/∂x= − µOHδEδh−, (10)
where the electric field due to the non-equilibrium charges δσDand δh−is δE(x)=δσD/ε0εs−(qOH/ε0εs) x Z 0 dyδh−(y). (11)
Near the charged layer δσD(x∼0), the second term on the right side of Eq. (11) can be neglected. Thus, near the sur-face, Eq. (10) gives
∂δh−/∂x≈ − δh−/1OH, (12)
where 1OH ≡ DOHε0εs/µOHδσD. For a typical vapor growth rate of 0.1 µm s−1at −20◦C, 1OH∼0.04 µm, which is much thinner than the mass-loss regions we estimate in Sect. 4.
The surface potential caused by nonequilibrium δφsurf is approximately δE1OH. Equation (12) suggests that δφsurf is independent of growth rate; as charging increases, the OH− charges simply move closer to the D defects. Indeed, δE(0)1OH≈DOH/µOH≈kT /qI=36 mV using Eq. (11), the Einstein relation between diffusivity and mobility, and the values in the appendix. Thus, the model is consistent with the observations (Caranti and Illingworth, 1980) showing that δφsurf varies by only 25 mV over a range of temperatures and growth rates even though collisional charging measure-ments (Baker et al. 1987; Berdeklis and List, 2001) indicate that the ionic charging increases with growth rate (entry 5, Table 1a).
To estimate the nonequilibrium ionic surface charge δσ we consider how much OH− screens the δσD layer. For this, we compare the drift speed µOHδE(x) of OH− ions near the high-D surface layer (x∼0) to the drift speed near the crystal center at x∼D/4. To make the discussion spe-cific, assume v=0.1 µm s−1 and T = − 20◦C. For x∼0, δE=δσD/ε0εs∼0.95 × 106V m−1, which results in an es-timated drift speed of ∼2.8×10⁻²m s−1, using the values in the appendix. Moving closer to the center of the crystal at x∼D/4, h− decreases and becomes uniform. Here, the diffusive flux vanishes. Thus, assuming δjOH=0, the elec-tric field must be just enough for the drift speed µOHδE to balance the sweeping speed v=0.1 µm s−1. That is, µOHδE(D/4)∼0.1 µm s−1. For this to occur, δE(x) must decrease from its near surface value by a factor of 2.8×10⁷ (the ratio of the drift speeds). Therefore, practically all of the charge δσDmust be screened by negative charge. Consistent with our assumption that OH−and H3O+respond to growth perturbations of L and D, we assume this screening charge is OH−, not L. Moreover, the OH−mobility is likely greater than that of L for most relevant atmospheric temperatures (Bryant, 1967; PW, p. 154) and thus would more readily screen δσD. Thus,
δσ ≈δσD= −qDvτBd0(0) (13)
is the additional ionic charging due to growth or sublimation.
During sublimation, v<0 and hence d decreases as l in-creases at the surface. This pulls H3O+to the surface. Be-cause the dc surface conductivity is proportional to mobility times surface concentration, the increased concentration of the highly-mobile H3O+during sublimation should increase the dc surface conductivity. This agrees with measurements (entry 6, Table 1a).
Even though the effective ionic charge within the ice is ±0.62e, each surface ion transferred in a collision carries a charge of ±e. Thus, we use here an ionic surface charge density σ that is e times (h+−h−)integrated over the surface region. During growth, the surface removes H3O+from the surface region; hence, in this case we neglect h+and thus
σ =σ0+(e/qOH)δσ, (14)
where σ0is the equilibrium ionic surface charge density. PW (p. 238) estimated |σ0|∼10−4−10−3C m−2, which is smaller than the calculated values of (e/qOH)|δσ |. In particular, (e/qOH)|δσ |=2.4 × 10⁻³, 1.3×10⁻², and 8.6×10⁻², C m−2 for −10, −20, and −30◦C, respectively, for a growth rate of 1 µm s−1. This large increase of charging during growth helps explains entry 7 in Table 1a.
To summarize: the D defects build up during growth, while the L do not, because of the lower mobility of the D; in particular, the D are swept into the crystal with flux vd faster than they can diffuse back to the surface. Equation (1) shows that when growth first starts, ∂d/∂t≈ − vd00>0 at the surface. Conversely, ∂l/∂t≈ − vl00<0 because l00>0 accord-ing to the analysis in PR. Thus, growth causes d to increase at the surface and l to decrease. The same argument shows that d decreases while l increases during sublimation.
The success of this model at explaining observations in Ta-ble 1a lends confidence to its application to the more difficult case of ice-ice collisions.
4 Charge transfer during ice-ice collisions
An obvious manifestation of large-scale charge separation is lightning, which is thought to depend partly on net transfer of electric charge during ice-ice collisions (Illing-worth, 1985). In well-characterized experiments on ice-ice collisional charging, sub-millimeter, freshly-frozen, mono-dispersed ice spheres near equilibrium collided with a larger ice surface, and induction rings tracked the charge on the spheres before and after impact (Gaskell and Illingworth, 1980; hereafter GI). When the target ice was not growing, the charge transfer 1Q was roughly independent of the tem-perature and doping of the target. Other experiments sup-port the latter finding (Illingworth and Caranti, 1985) but also show that the charging depends on the doping in the sub-millimeter ice sphere. Similarly, Marshall et al. (1978) found that the target charged negatively when it was warmer than the ice sphere, but the magnitude was independent of the target temperature when this difference exceeded 1.5◦C. The
J. Nelson and M. Baker: Charging of ice-vapor interfaces 1243
5
Fig. 4: Mass and charge transfer from the corner of a facetted crystal to the
underside of sublimating graupel. The graupel surface is assumed flat over
regions of order 15
µ
m. P
0
(<< P
melt
) is atmospheric pressure. Before the
collision, the crystal surface has OH
-
with charge density
σ
(eq. 14) and total
charge
∆
Q. The collision squeezes this charged mass into melt (exaggerated
here) that is pushed outward from a thin region between the ice particles and
then freezes onto the graupel. For
θ
below about 0.61, A~
π
r
tp
2
θ
2
,
V~
π
r
tp
3
θ
4
/4,
and the maximum thickness of the transferred volume before the collision is
(V/
π
r
tp
)
0.5
.
U
V,
∆
Q
P
meltGraupel
P
0V,
∆
Q
r
tpCrystal
Before
After
A
During
θ
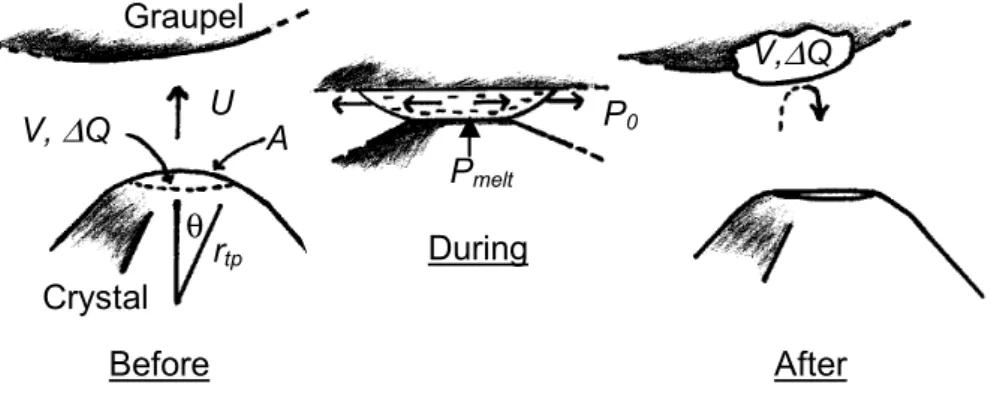
Fig. 4. Mass and charge transfer from the corner of a facetted crystal to the underside of sublimating graupel. The graupel surface is assumed
flat over regions of order 15 µm. P0( Pmelt)is atmospheric pressure. Before the collision, the crystal surface has OH−with charge density σ(Eq. 14) and total charge 1Q. The collision squeezes this charged mass into melt (exaggerated here) that is pushed outward from a thin region between the ice particles and then freezes onto the graupel. For θ below about 0.61, A∼π rtp2θ2, V ∼π rtp3θ4/4, and the maximum thickness of the transferred volume before the collision is (V /π rtp)0.5.
lack of influence from the properties of the target ice surface is inconsistent with surface state theory (e.g., Castle, 1997) that has been successfully applied to the contact charging of other materials. We argue below that this unusual property of charging during ice-ice collisions, as well as the other ob-served relations in Table 1b, arise from a primarily one-way transfer of charged melt.
Experiments by Mason and Dash (2000) found that neg-ative charge transfer between contacting ice surfaces is cor-related with a mass transfer, and subsequent analysis indi-cated that the mass is likely melt (Dash et al., 2001). Pressure melting can explain this finding. In particular, the maximum pressure Pcon at the contact area during elastic rebound of a small ice crystal on a flat ice surface is (Higa et al., 1998) Pcon=1.95 × 10⁸(Rcr/rtp)0.6U0.4, (15) where Rcris the equivalent sphere radius of the smaller crys-tal, rtpis its radius of curvature at the initial point of contact (Fig. 4), and U is its impinging speed normal to the surface. We fit Kishimoto and Maruyama’s (1998) data on the melting pressure of ice Pmelt to
Pmelt= −1.224 × 10⁷T −1.171 × 10⁵T2, (16) for temperature T [◦C] between 0 and −24◦C. For a given T, equating Pconto Pmelt determines a critical speed above which pressure melting can occur in the contact region. These critical speeds are much less than the updrafts in the strong electrical charging regions of thunderstorms, particu-larly when rtp Rcr (Table 2). Hence, elasticity theory in-dicates that pressure melting occurs for typical ice-ice colli-sions in clouds. Collisional forces change dramatically once melt forms, so the theory by itself cannot predict the amount of melt transfer. To estimate this quantity, we use a cruder approach.
Just before contact, the ice surface on the two particles may be at different temperatures, have different charge den-sities, and different radii of curvature. In some experiments, for example those of Latham and Mason (1961) and Ma-son and Dash (2000), the two contacting ice surfaces likely had nearly equal radii of curvature. The theories of Latham and Mason (1961) and Dash et al. (2001), respectively, can explain these experiments. However, their theories poorly explain other experimental data that are relevant to the at-mosphere: charge transfer based only on temperature dif-ferences (Latham and Mason’s) has been ruled out as the generator of thunderstorm electricity because it is too weak (Illingworth, 1985), and Dash et al.’s mechanism based on different surface charge densities and temperatures between the two surfaces does not explain measured charge transfers during collisions between two nongrowing crystals (GI). In contrast, the initial points of contact between colliding atmo-spheric ice particles should usually have very different radii of curvature. We argue here that, in most atmospheric situ-ations, the estimated direction of mass transfer is dominated by the difference in radii of curvature between the particles.
When contact occurs, the pressure builds up until melt forms. This melt can form on both particles in the contact re-gion; however, the melt that forms in the initially sharper par-ticle has a much stronger horizontal pressure gradient forcing the fluid to the side and thus to the flatter particle (Fig. 4). If a slice of area a and thickness 1x melts and remains at Pmelt(T ), the work to quasistatically push this fluid to the side is Pmelt(T )a1x. There will be local cooling caused by melting and heating due to viscous dissipation and refreez-ing, but for simplicity, we assume T remains at its original value. The total work to remove the melt from the sharper particle will be some fraction f of the incident kinetic en-ergy KE of the collision. By summing the work for each slice of thickness 1x, f KE=Pmelt(T )P a1x. Thus, the
total transferred volume V =P a1x is
V =f2πρiRcr3U2/3Pmelt(T ), (17)
where ρiis the mass density of ice and f is the fraction of KE used to transfer mass. Dash et al.(2001) predict about 12-fold more melt volume than that in Eq. 17 because they neglect the work to push the melt aside. (Their neglect of horizon-tal melt flow may be reasonable for their experiments as the ”collisions” repeatedly occurred in the same area, but in most other experiments and in the atmosphere, it is less likely to be accurate.) Because other processes, including some mass flow from flatter to sharper surface, can also remove KE from the collision, f is less than the inelasticity of the collision. Measurements with ice spheres (Higa et al., 1998) impact-ing normally on a flat ice surface show that the inelasticity increases with decreasing size and is ≈0.5 for Rcr=1.4 mm. Thus, f could exceed 0.5 for atmospheric ice crystals if no other processes absorb KE, although f ∼0.02 − 0.2 fits the charging measurements described below, which are likely av-erages over both normal and glancing collisions.
We now consider the atmospherically relevant situation, simulated in a number of lab experiments, in which a small pointed ice crystal impacts a broader graupel surface. In this case, V is the volume of ice in the crystal corner between the original point and a slice normal to the contact plane (Fig. 4). Thus, the original surface charge in this volume transfers and freezes to the flatter ice surface, which, unless otherwise stated, is assumed to be the graupel. When the graupel surface is very near the melting temperature and sig-nificantly warmer than the crystal, the graupel contact point could melt before that in the crystal and possibly reverse the overall direction of charged-mass transfer. Such a reversal of mass transfer might explain the positive graupel charging in Pereyra et al. (2000) when the graupel surface was above ∼−7◦C and the crystals were about −10◦C. (The tempera-ture difference between the surfaces might also govern the overall direction of mass flow when the contact radii of both particles are large and nearly the same. But this situation should be relatively rare in the atmosphere.) Thus, in gen-eral, we assume that mass transfers from the sharper to the flatter (graupel) surface. This can explain entry 1 in Table 1b. We briefly consider how other factors might also favor mass transfer to the flatter surface. For example, shearing off of the sharper point and partial penetration of the sharper point into the flatter surface favor mass loss of the sharper particle. Also, the sharper particle might melt more readily than the graupel because it might be softer. The relative soft-ness can arise from frictional heating if it scrapes along the graupel and the charge itself can soften the ice corner due to electrostatic pressure according to PR. Finally, Sommer and Levin (2001) predicted significant amounts of mass transfer from sharp ice-crystal points to relatively-flat graupel due to asymmetries in the molecular interactions at the surfaces.
4.1 Charge transfer in equilibrium
We first use measured (GI) charge transfers for collisions between frozen droplets and relatively flat, nongrowing sur-faces (simulated graupel) to fit f or σ0 for the transfer of equilibrium charge 1Q0. We then use the best-fit parameter to compare predicted with measured charge transfers during collisions of facetted growing crystals with graupel.
If the tip of the impacting crystal has radius of curvature rtp and the mass transferred is V , then the surface area re-gion that melts and transfers charge is A≈2(π rtpV )0.5. The resulting charge transfer is σ0A. Substituting for V from Eq. (17),
1Q0≈π σ0f0.5U (8ρi/3Pmelt)0.5rtp0.5R 1.5
cr , (18)
where Pmelt(T ) is evaluated at the ambient temperature T. The fact that 1Q0 is proportional to U and not U2 is due to the locally-spherical nature of the corner (Fig. 4). As 1Q∝A∝U , Eq. (18) agrees with entry 2 in Ta-ble 1b. To determine σ0f0.5 in Eq. (18), we set rtp=Rcr, Pmelt=1.1×10⁸Pa (T =10◦C), and then fit 1Q0to the mea-surements in GI to obtain 1Q≈ − 6.4×10⁻⁷U R2cr. The result is σ0f0.5= −4.3×10⁻⁵C m−2and thus f =0.16 for an estimated equilibrium σ0of −10−4C m−2(PW, pg. 238). This fit for the data also agrees well with Buser and Auf-dermaur’s measurements at −45◦C for Rcr=10 µm and U =10 m s−1: using Pmelt=380 MPa, the predicted charge is 1Q= −0.32 fC versus the measured value of −0.3 fC. Thus, Eq. (18), with constant σ0f0.5, appears useful over a wide radius and temperature range.
However, in the atmosphere, collisions involve vapor-grown ice crystals and graupel, both of which are nonspher-ical. Vapor-grown ice crystals generally have flat, facetted faces separated by sharp edges and corners, whereas the sur-face of graupel is generally knobbly but can have frost or liq-uid water. In the absence of some presently unknown align-ment force, all collisions should involve the corner of one particle striking a relatively flat section of the other particle. The shape at a crystal corner should be approximately spheri-cal and the resolution in ice crystal photographs suggests that rtp<5 µm. Conversely, graupel surfaces grow when drops of diameter typically exceeding 15 µm impact, flatten, and freeze. Thus, when graupel does not have frost, the grau-pel likely has the flatter surface in most collisions and hence would receive the charged mass from the crystal. However, as there is considerable variation possible in impact orienta-tion and local shape on a graupel surface, significant varia-tion in 1Q is predicted; this variavaria-tion should be particularly large when the graupel has frost or fragile rime branches, which agrees with experiment (entry 3, Table 1b).
4.2 Nonequilibrium charge transfer
During growth or sublimation, the total ionic charge density at the interface σ is σ0+(e/qOH)δσ, where δσ , the growth
J. Nelson and M. Baker: Charging of ice-vapor interfaces 1245
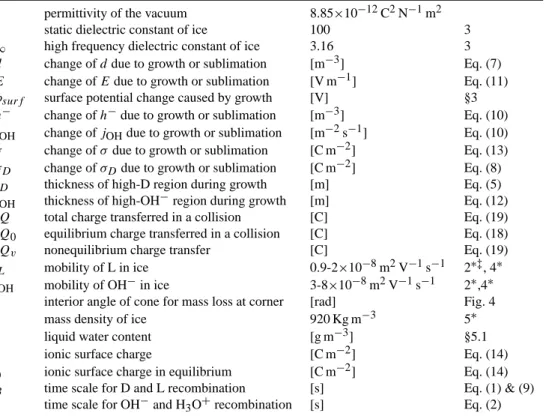
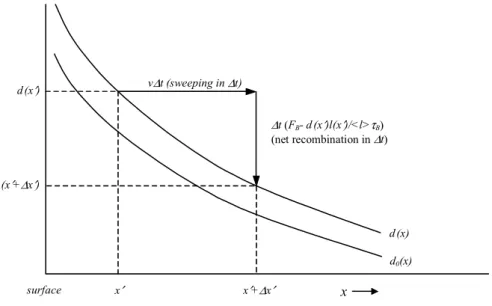
Table 2. Collision speed U [m s−1] above which pressure melting can occur in ice crystal collisions
T[◦C] −5 −10 −15 −20 −25
Rcr/rtp collision type
1 ice sphere-flat ice 4.9×10⁻² 2.5×10⁻¹ 5.9×10⁻¹ 1.0 1.6 10 snow-flat ice 1.6×10⁻³ 7.8×10⁻³ 1.9×10⁻² 3.3×10⁻² 5.0×10⁻² 10 snow-snow 2.2×10⁻³ 1.1×10⁻² 2.6×10⁻² 4.7×10⁻² 7.0×10⁻² 10 snow-metal 3.9×10⁻⁴ 1.9×10⁻³ 4.6×10⁻³ 8.3×10⁻³ 1.2×10⁻² 10 snow-rubber 2.4×10⁴ 1.2×10⁵ 2.9×10⁵ 5.2×10⁵ 7.8×10⁵
Values from Eqs. (15) and (16). The snow-snow collision is for tip-to-center collisions between two ice crystals of the same mass and follows by replacing Rcr3 with 0.5 Rcr3 in Eq. (15). The bottom two rows apply to snow crystals striking large, flat surfaces of the listed material; metal refers to any material with Young’s modulus greatly exceeding that of ice (9.33 GPa), and the estimates for rubber assumed a Young’s modulus of 1 MPa.
increment, is given by Eq. (13). When σ0in Eq. (18) is re-placed by σ , the total charge transfer to the graupel 1Q be-comes 1Q=1Q0+1Qv = −(K0+vf0.5K1)U rtp0.5R 1.5 cr P −0.5 melt, (19) where K0≡π(8ρi/3)0.5|σ0|f0.5, (20) and K1≡π(8ρi/3)0.5e(qD/qOH)d0(0)τB. (21)
Inserting the above fit for σ0f0.5 and numerical values for the other parameters from the appendix, K0=6.7×10⁻³and K1=2.1×10⁶exp[1.14×10⁴(1/T [K] − 1/253.15)]. The temperature dependence of K1is from τB. (Temperature de-pendences of K0and other factors in K1 are presently un-known.)
In the charge transfer literature, crystal size is usually given in terms of maximum crystal dimension D. However, because ice crystals change shape during growth, Rcr is not proportional to D; rather, for up to 5-min of growth, mea-surements find Rcr3∝D1.7for tabular crystals and Rcr3∝D1.03 for columnar crystals (Takahashi et al., 1991). Collision experiments (Keith and Saunders, 1990) with vapor-grown crystals impacting a stationary ice target at −25◦C and
U =10 − 50 m s−1 showed that 1Q∝D0.6−0.8. With this
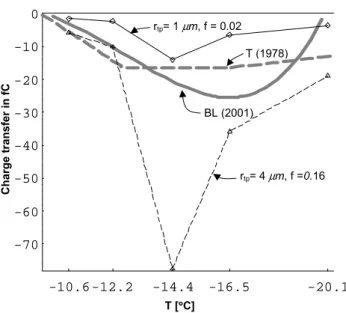
growth data, Eq. (19) predicts 1Q∝D0.5−0.9(including both columnar and tabular cases), which agrees well with mea-surement (entry 4 in Table 1b). Most importantly, for rea-sonable parameter values, Eq. (19) quantitatively agrees with collision experiments under simulated thunderstorm condi-tions as shown in Fig. 5. The predicted peaks in the charging near −14.4◦C are due to the peaks in v and Rcr at this tem-perature (entry 5, Table 1b). Thus, the variation in growth rate dominates the temperature trend, a factor that has not been explicitly realized in previous models of the charge
transfer but is consistent with the oft-stated hypothesis from Baker et al. (1987): “The faster-growing particles (by vapor transfer) acquire positive charge”. Other trends are apparent. For example, lower temperatures have larger charging mainly because of the larger relaxation time τBat low temperatures. Also, larger radii of curvature rtp at the contact point have greater charging because of the greater surface area (which can explain entry 6 in Table 1b), and a larger collision effi-ciency f results in more charging because more ice melts. Finally, we mention that previous charging theories have dif-ficulty explaining the positive charging of graupel when the ice crystals are sublimating (Saunders et al., 2001); but such charging follows from Eq. (19) because v<0 and K1 K0. This can explain entry 7 in Table 1b.
5 Further implications of charge transfer model for thunderstorm electrification
5.1 Thunderstorms
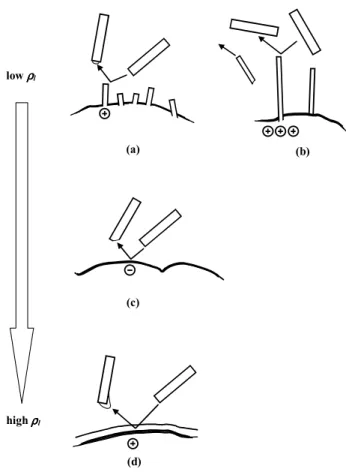
In thunderstorms, the collision speed U and the colliding ice particles’ masses and growth rates all increase, in general, with increasing updraft speeds. Thus, our model helps ex-plain why fast updraft speeds and rapid vapor growth v in clouds are needed to produce vigorous electrification in the main (i.e., negative) charging zone of thunderstorms. This model applies to collisions between dry surfaces in which one is sharper than the other; thus it explains the negative charging regime (1Q< 0) in which the graupel is relatively smooth (Takahashi, 1978), which is T <10◦C and cloud liq-uid water contents ρl∼0.3 − 3 g m−3(Fig. 6c). Takahashi’s complete data set, which is consistent with the later stud-ies of Pereyra et al. (2000) and Takahashi and Miyawaki (2002), successfully models thunderstorms (Helsdon et al., 2001) and shows that the tripolar nature of thunderstorms arises in part from the boundary in T − ρl space between negative and positive graupel charging. Due to the “knob-bly” shape of graupel, precise surface conditions are
1246 J. Nelson and M. Baker: Charging of ice-vapor interfaces
Fig. 5: Predicted charge transfers (eq. 19) vs data from Takahashi (thick grey,
dashed T (1978)) and Berdeklis and List (thick grey, solid BL(2001)) under
simulated thunderstorm conditions. Curve T (1978) was made by drawing a line
at
ρ
l= 1.1 g m
-3in Fig. 8 of that reference and linking the resulting contour
crossing values by straight lines. BL (2001) is the curve fit to data for conditions
under liquid water saturation in Berdeklis and List (2001). Calculations used U=
5.3 m s
-1, with measured crystal masses (converted to R
cr) and measured
growth rates after 3 min of growth from Takahashi et al. (1991). (Measured
growth rates were divided by
√
2 because the corners grow slower than the
measured points on the crystals.) For the 5 temperatures plotted here, warm to
cold, we used growth rates v [
µ
m s
-1] and R
cr[
µ
m] of (0.12, 35.6), (0.16, 40.6),
(0.91, 46.4), (0.31, 45.5), and (0.13, 36.4). The maximum thickness of the
transferred mass was
≈
0.5
µ
m and
θ
< 0.68. The minimum thickness was
≈
0.28
µ
m at –20
°
C for f = 0.02.
-10.6 -12.2 -14.4 -16.5 -20.1 -70 -60 -50 -40 -30 -20 -10 0 T [°°°°C] rtp= 1 µm, f = 0.02 T (1978) BL (2001) rtp= 4µm, f =0.16 Charge transfer i n fC
Fig. 5. Predicted charge transfers (Eq. 19) vs data from Takahashi
(thick grey, dashed T, 1978) and Berdeklis and List (thick grey, solid BL, 2001) under simulated thunderstorm conditions. Curve T (1978) was made by drawing a line at ρl=1.1 g m−3in Fig. 8 of that reference and linking the resulting contour crossing values by straight lines. BL (2001) is the curve fit to data for conditions under liquid water saturation in Berdeklis and List (2001). Calculations used U=5.3 m s−1, with measured crystal masses (converted to Rcr)
and measured growth rates after 3 min of growth from Takahashi et al. (1991). (Measured growth rates were divided by
√
2 because the corners grow slower than the measured points on the crystals.) For the 5 temperatures plotted here, warm to cold, we used growth rates
v[µm s−1] and Rcr[µm] of (0.12, 35.6), (0.16, 40.6), (0.91, 46.4),
(0.31, 45.5), and (0.13, 36.4). The maximum thickness of the trans-ferred mass was ≈0.5 µm and θ <0.68. The minimum thickness was ≈0.28 µm at −20◦C for f =0.02.
known; but estimates in Williams et al. (1991) indicate that the graupel surface 1. has vapor-grown frost due to the rela-tively low surface temperature at the lowest ρlvalues (regime of mostly positive charging), 2. sublimates due to the rela-tively high surface temperature on the graupel at middling ρl values (mostly negative charging), and 3. has liquid wa-ter at the highest ρl values (positive charging). At high ρl, the graupel’s liquid film would greatly soften the collision, and the dry, cooler surface of a rebounding crystal should in-stead remove charged liquid from the graupel (Fig. 6d). This should produce overall positive charging (Takahashi, 1978; Graciaa et al., 2001), even if most crystals stick to the grau-pel. Conversely, positive charging at low ρl should result if the frost has the sharper point at the collision (Fig. 6a) or if ice breaks off the graupel (Fig. 6b). In the former case, Eq. (19) would apply with the opposite sign, but fracture, which does occur in the positive regime at low ρl, removes much larger amounts of negative charge (Hallett and Saun-ders, 1979). A maximum amount of charge when a fractured surface is removed from graupel is estimated by multiplying the charge per area in Eq. (14) by the surface area of the
fast-growing frost surface and neglecting any neutralizing H3O+ in the interior of the ice (Fig. 2). This amount can exceed −104fC. Thus, even if only a small fraction of the collisions result in fracture, the fractured pieces can dominate the aver-age charge transfer. Our model is consistent with the negative charging regime in thunderstorms and suggests a change to positive at higher and lower ρl(entry 8, Table 1b). Therefore, the model here describes a plausible mechanism of thunder-storm electrification.
In addition to the noninductive charge transfer described above, charges induced on ice particles by the in-cloud elec-tric field can also be transferred from particle to particle. This ice-ice inductive charge transfer increases the thun-derstorm charging rate after the noninductive ice crystal-graupel mechanism establishes a strong field (Helsdon et al., 2001). Previously, researchers have assumed that these in-duced charges are transferred by conduction during brief, melt-free collisions (e.g., Illingworth and Caranti, 1985). Given the brevity of such a collisional contact and the rela-tive slowness of conduction, this process has been considered weak. However, if the charge is transferred with melt, as ar-gued here, then ice-ice induction can have greater influence on thunderstorm charging than previously predicted. Also, the melt can soften the collision by limiting the collision pressure to Pmelt. This can increase collisional contact times, thus increasing the charge conducted during the collision. Moreover, contact times should increase with decreasing rtp due to the smaller contact area, which allows more charge to conduct to snow crystals than that to ice spheres. Thus, charge transfer accompanying mass transfer could partly ex-plain why experiments on ice-ice induction with snow crys-tals (Scott and Levin, 1970) showed larger charge transfers than the standard inductive theory based on conduction and also larger charge transfers than experiments with ice spheres (Illingworth and Caranti, 1985).
5.2 Effect of impurities on charge transfer
Real ice generally contains impurities, which can affect ice electrical properties. Buser and Aufdermaur (1977) found that NH3 added to frozen droplets increased their negative charge transfer to a metal target, whereas HF reversed the sign of the transfer (entry 9, Table 1b) and had a larger ef-fect than NH3 for equal concentrations. To explain these trends, we assume that NH3and HF substitute for an H2O molecule in the ice lattice and the concentration of these im-purities is greater in the ice interior than it is on the surface. (The latter is consistent with the tendency of ice to reject impurities and freezing of an ice shell around the droplet before the interior is completely frozen.) The substitution of NH3 in ice is thought to release an OH−, leaving a rel-atively immobile D and NH+4 (PW pg. 99). Some of this OH− should migrate to the surface, which would increase the OH− concentration at the surface and lead to the ob-served result. A similar argument holds for NH4OH, which
J. Nelson and M. Baker: Charging of ice-vapor interfaces 1247 would explain results of experiments on sand-ice collisions
(Jayaratne, 1991). Conversely, the substitution of HF in ice is thought to release an H3O+and an L, leaving a relatively im-mobile F−(PW pg. 98). Some of the H3O+should migrate to the surface, which would increase the H3O+concentration at the surface and lead to the observed result; in addition, mi-gration of L to the surface would produce an electric field that can pull even more H3O+to the surface as in Fig.1. HCl should have an effect similar to HF but there are as yet no relevant measurements. Measured charging tendencies (Ja-yaratne, 1991; Jayaratne et al., 1983) with doping of NaCl and (NH4)2SO4are qualitatively consistent with our model if one assumes that these compounds dissociate and sepa-rate in ice according to measured trends (e.g., Workman and Reynolds, 1950), but quantitative prediction is difficult.
6 Implications of the model to other geophysical and planetary phenomena
In this section, we speculate on the possible roles played by charge redistribution and pressure-melting-assisted charge transfer in nonthunderstorm phenomena.
6.1 Charging between ice and other materials
Non-sublimating ice charges positively when sand particles rebound from it (Jayaratne, 1991). As sand is much harder than ice, charged-mass transfer is predicted to be from the ice surface to the sand and thus should positively charge the ice in agreement with measurement. Also, in the laboratory, ice spheres impacting metals at 10 m s−1deposit net negative charge during rebound, the only exceptions being metals that easily emit electrons from their surface (Buser and Aufder-maur, 1977; Caranti et al., 1985). The hardness of metals allows pressure melting of ice to occur in such collisions (Table 2), and thus the measurements support the present model. Such charging, which can be a nuisance when crys-tals strike antennas and aircraft (FAA, 2001) or cause corona and sparks from objects in contact with blowing snow (Ives, 1938), should be greatly alleviated if the metal is coated by a thin layer of soft material such as silicone rubber. For exam-ple, Table 2 shows that ice crystals would require supersonic speeds to transfer charge to rubber via pressure melting. 6.2 Heterogeneous chemistry
Uptake of tropospheric gases by liquid drops is often highly dependent on pH; however, the effect of intrinsic ice sur-face pH on sursur-face chemical reactions has not been studied. Charging during growth should make the ice surface more basic due to the high OH− concentration. For example, if 20 fC of surface charge is contained in a volume V ≈3 µm3 (typical of data in Fig. 5), the average pH upon melting would be 9.6. The pH right at the surface would likely be greater than this average.
8 (c) (a) (d) low ρρρρl high ρρρρl (b)
Fig. 6. Mass and charge transfer between vapor-grown crystals,
shown as rectangles in motion, and surface regions on graupel, shown at the bottom of each sketch, for low to high ρl conditions.
a and b occur at low ρl when frost, sketched as rectangular spikes,
grows on the graupel surface. In a, the negative charge at the corner of the frost transfers to the crystal facet by the same process as in case c except the direction of mass transfer is reversed. If the frost breaks off, as in case b, much more negative charge is removed than in case a. If the crystal instead strikes a smooth, frost-free region (not shown), negative charge transfer occurs just as in case c. In c, the atmosphere has middling values of liquid water content ρland
thus the graupel is sublimating due to the latent heating from freez-ing drops on the surface (not shown). This case is equivalent to that in Fig. 4. Case d is for sufficiently high ρl that the graupel has a
layer of liquid water. For the rare crystal that does not stick, positive charging occurs because the outermost, negatively-charged, surface of the water layer attaches to the crystal (Takahashi, 1978; Graciaa et al. 2001). This direction of mass transfer might also occur when the graupel is dry but very close to 0◦C. When the ice crystals are sublimating, the charging in a and c should change sign from those shown in the figure.
6.3 Crystal aggregation
Consequences of surface charging and pressure melting dur-ing collisions are largely ignored in atmospheric and plane-tary studies even though both phenomena can significantly influence various phenomena in these fields. For example,
maximum snowflake size increases dramatically for snow-falls above about −10◦C with a smaller peak near −12◦C. The apparent increase of collection efficiency at high temper-atures has generally been ascribed to inherent surface melting of ice (e.g., Pruppacher and Klett, 1980, p. 502) even though the disordered layer is thought to be only a few nanometers thick for temperature below about −2◦C (PW, p. 246). The pressure-melting hypothesis proposed here has a similar tem-perature versus melt-thickness trend, but the amount of melt can be larger, even for typical collision speeds of snow crys-tals of ∼5 cm s−1(cf. Table 2).
In addition to the role of aerodynamic forces that is of-ten mentioned in discussions of snow crystal aggregation, the aggregation of snow crystals into snowflakes should de-pend on electrostatic forces between the crystals (Smith-Johannsen, 1969). Furthermore, because collisions transfer only a fraction of the surface charge, collisions involving the tip of one crystal and a non-tip part of another can retain strong electrostatic attraction even after transferring some charged-mass. Thus, the growth charging in this model might partly explain why such point adhesions of two snow crystals are common (Smith-Johannsen, 1969; Finnegan and Pitter, 1988; Kajikawa et al. 2000). A rough demonstration of the possible electrostatic forces follows. Consider two colum-nar crystals 100-µm long, 20-µm-across, and separated by a gap of 0.5 mm in a “broken-T” orientation (like this:|−). If we ignore the D and L defects and assume that the net OH−charge at the tips are 8×10⁻³C m−2(i.e., the predicted charge from Eq. (14) for growth near −15◦C) and the com-pensating H3O+charges are in the centers of the crystals to make the crystals electrically neutral, then the resulting at-tractive force is more than twice the gravitational force on each crystal, even for this large separation. Of course, the D and L charges should significantly reduce this attraction; nev-ertheless, there is a potentially large influence on snowflake formation from surface charging.
In addition, such an electrostatic attraction can be high for fast-growing frost crystals, even at very low tempera-tures. This attraction likely explains the fragile “yukima-rimo” frostballs that form in Antarctica on the snow surface when light winds break rapidly-grown frost crystals that tum-ble about and clump together (Kameda et al., 1999). Even at low temperatures, growth charging and pressure melting might influence the aggregation of water-frost covered parti-cles in planetary rings (Jurac et al., 1995) and in planetesimal formation.
6.4 Ferroelectric ice grains
Ice grains in snowpacks are often subjected to temperature gradients that allow sublimation on the warmer side of an air gap and growth on the colder side. According to our model, growth polarizes the lattice with an electric field in one direc-tion, whereas sublimation polarizes in the opposite direction (relative to the surface). Thus, such ice grains can partly
po-larize from the growing to sublimating ends, which means that the ice becomes partly hydrogen-ordered and ferroelec-tric along the average temperature gradient. Raman spec-troscopy and inelastic neutron scattering on ice from Antarc-tica, which originated as snowpack, showed proton ordering in samples kept below 237 K (Fukazawa et al., 1998). Such ordering has been a mystery because solid ice in the labora-tory transforms to the hydrogen-ordered XI phase only be-low 72 K; but the growth-sublimation of small grains at be-low temperature might cause such an orientation to freeze into the lattice and remain until the ice is warmed enough for the Bjerrum defects to migrate back to their usual disordered state. Hence, this surface charging might partly explain the hydrogen ordering in Antarctic ice.
In addition, experimental evidence for ferroelectric ice has created a mystery in ice physics because the theoretical ice Ih structure with lowest energy is antiferroelectric (PW, p. 261). One solution to this mystery is the influence of the substrate on ferroelectric ordering in ice films (e.g., Su et al. 1998). The theory here indicates that growth of the ice-vapor inter-face can also promote ferroelectric ordering; thus, this theory provides another possible solution to the ice physics mystery.
7 Discussion
The fundamental reason why charging occurs in our model is because the positively-charged majority carrier (D) is less mobile than the negatively-charged majority carrier (L) and the resulting build-up of D defects at the surface during growth causes OH− to also build-up at the surface. Thus, our main conclusion is that the interaction between Bjerrum and ionic defects might explain a wide range of experimental results and have broad applications.
However, doing more precise, quantitative modeling of ice charging in the atmosphere is enormously difficult due to the complex nature of ice crystal growth from the vapor, the four types of charge carriers in ice, and because the atmospheric environment includes updrafts, electric fields, water droplets, and various free charges. The nature of the ice surface is it-self the source of much debate, the microscale structure of rimed surfaces is unknown, and the collisional process will likely be poorly understood for some time. These complex-ities justify our simplification of the problem, but it means that the present theory will likely evolve as finer experimen-tal and theoretical details become known. Some details, such as the depth distributions of the charges, the screening of the electric field at the surface by L defects, and non-zero mobil-ity of D might reduce the ionic charging predicted at the out-ermost surface layer. In contrast, lateral repulsion of charges at the growing surface (and electrical induction before im-pact) should push (and pull) more charge to the collision points at the corners and thus might greatly increase colli-sional charge transfer. Growth itself might further increase the charging because the increase of electric field within the
J. Nelson and M. Baker: Charging of ice-vapor interfaces 1249
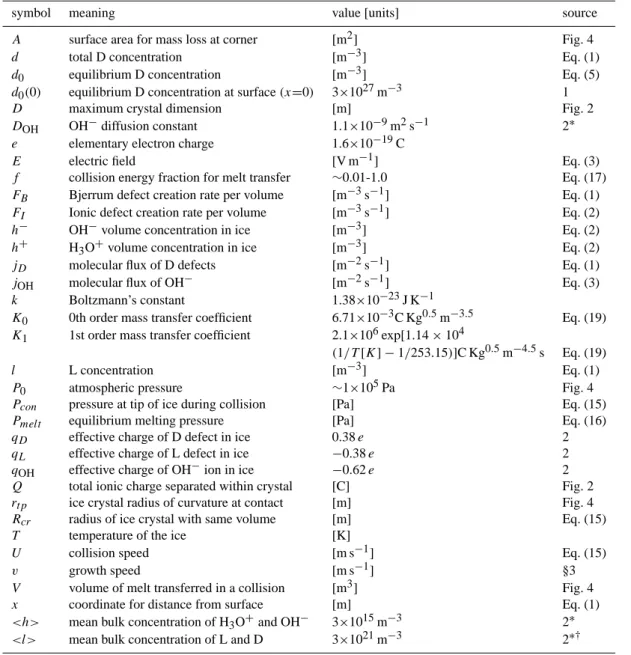
Table 3. List of constants and variables used in the text
symbol meaning value [units] source
A surface area for mass loss at corner [m2] Fig. 4
d total D concentration [m−3] Eq. (1)
d0 equilibrium D concentration [m−3] Eq. (5) d0(0) equilibrium D concentration at surface (x=0) 3×1027m−3 1 D maximum crystal dimension [m] Fig. 2
DOH OH−diffusion constant 1.1×10⁻⁹m2s−1 2∗ e elementary electron charge 1.6×10⁻¹⁹C
E electric field [V m−1] Eq. (3)
f collision energy fraction for melt transfer ∼0.01-1.0 Eq. (17)
FB Bjerrum defect creation rate per volume [m−3s−1] Eq. (1)
FI Ionic defect creation rate per volume [m−3s−1] Eq. (2) h− OH−volume concentration in ice [m−3] Eq. (2)
h+ H3O+volume concentration in ice [m−3] Eq. (2) jD molecular flux of D defects [m−2s−1] Eq. (1) jOH molecular flux of OH− [m−2s−1] Eq. (3) k Boltzmann’s constant 1.38×10⁻²³J K−1
K0 0th order mass transfer coefficient 6.71×10⁻³C Kg0.5m−3.5 Eq. (19) K1 1st order mass transfer coefficient 2.1×10⁶exp[1.14 × 10⁴
(1/T [K] − 1/253.15)]C Kg0.5m−4.5s Eq. (19)
l L concentration [m−3] Eq. (1)
P0 atmospheric pressure ∼1×10⁵Pa Fig. 4 Pcon pressure at tip of ice during collision [Pa] Eq. (15) Pmelt equilibrium melting pressure [Pa] Eq. (16)
qD effective charge of D defect in ice 0.38 e 2 qL effective charge of L defect in ice −0.38 e 2 qOH effective charge of OH−ion in ice −0.62 e 2 Q total ionic charge separated within crystal [C] Fig. 2
rtp ice crystal radius of curvature at contact [m] Fig. 4 Rcr radius of ice crystal with same volume [m] Eq. (15) T temperature of the ice [K]
U collision speed [m s−1] Eq. (15)
v growth speed [m s−1] §3
V volume of melt transferred in a collision [m3] Fig. 4
x coordinate for distance from surface [m] Eq. (1)
<h> mean bulk concentration of H3O+and OH− 3×10¹⁵m−3 2∗
<l> mean bulk concentration of L and D 3×10²¹m−3 2∗†
ice surface can increase the defect creation rates (Onsager, 1934). Similarly, Dash et al. (2001) argued that growth it-self produces defects via a disordered growth mechanism that leads to net negative surface charge. Charging is likely to also be aided by the surface forces that tend to push D to the outermost surface layer (Fletcher, 1968). Moreover, partial disorder of the ice-vapor interface, which is predicted to in-crease with surface charge (PR), allows greater charged-melt transfer than that proposed here. Nevertheless, our theory is based on established properties of ice and is broadly consis-tent with a wide range of observations. It gives semiquanti-tative agreement with experiments that, when used in a cloud model, successfully simulate thunderstorm charging.
Similar analysis can be applied to melt growth when more data on the electrical properties of the ice-melt interface become available. Also, other hydrogen-bonded crystals have ionic and Bjerrum defects (Tonkonogov, 1998) and thus might have surface charging similar to that in ice. Examples include many minerals, and NH3 and H2S crystals, which are common in the atmosphere of the outer planets. Asym-metry between their contacting surfaces is important whether or not pressure melting occurs. For example, collisions can fracture sharp crystal corners, which can lead to large-scale charge separation via gravitational sedimentation. Thus, the surface charging of hydrogen-bonded crystals such as ice by the motion of Bjerrum defects could have widespread impli-cations.
Table 3. continued
ε0 permittivity of the vacuum 8.85×10⁻¹²C2N−1m2 εs static dielectric constant of ice 100 3 ε∞ high frequency dielectric constant of ice 3.16 3 δd change of d due to growth or sublimation [m−3] Eq. (7)
δE change of E due to growth or sublimation [V m−1] Eq. (11)
δφsurf surface potential change caused by growth [V] §3 δh− change of h−due to growth or sublimation [m−3] Eq. (10)
δjOH change of jOHdue to growth or sublimation [m−2s−1] Eq. (10) δσ change of σ due to growth or sublimation [C m−2] Eq. (13)
δσD change of σDdue to growth or sublimation [C m−2] Eq. (8) 1D thickness of high-D region during growth [m] Eq. (5) 1OH thickness of high-OH−region during growth [m] Eq. (12) 1Q total charge transferred in a collision [C] Eq. (19)
1Q0 equilibrium charge transferred in a collision [C] Eq. (18) 1Qv nonequilibrium charge transfer [C] Eq. (19) µL mobility of L in ice 0.9-2×10⁻⁸m2V−1s−1 2∗‡, 4∗ µOH mobility of OH−in ice 3-8×10⁻⁸m2V−1s−1 2∗,4∗ θ interior angle of cone for mass loss at corner [rad] Fig. 4
ρi mass density of ice 920 Kg m−3 5∗ ρl liquid water content [g m−3] §5.1 σ ionic surface charge [C m−2] Eq. (14)
σ0 ionic surface charge in equilibrium [C m−2] Eq. (14) τB time scale for D and L recombination [s] Eq. (1) & (9) τI time scale for OH−and H3O+recombination [s] Eq. (2)
1. PR 2. PW p. 154 3. Johari (1981) 4. Bryant (1967) 5. PW p. 23 ∗Estimated value at −20◦C
†Estimated activation energy 0.73 eV
‡Higher value used in computations with activation energy 0.25 eV
Acknowledgements. Charles Knight of NCAR made numerous
sug-gestions for improvement including the interpretation of yukima-rimo formation, Clive Saunders of UMIST found several errors in an early version and suggested comparison to measured surface po-tentials and sublimating ice, and Tsutomu Takahashi of Obirin Uni-versity made several helpful clarifications. MBB is grateful for the support of the Bosack-Kruger Foundation and also for NSF grant ATM-0211247.
References
Baker, B., Baker, M. B., Jayaratne, E. R., Latham, J., and Saunders, C. P. R.: The influence of diffusional growth rates on the charge transfer accompanying rebounding collisions between ice crys-tals and soft hailstones, Q. J. R. Meteorol. Soc. 113, 1193–1215, 1987.
Berdeklis, P. and List, R.: The ice crystal-graupel collision charg-ing mechanism of thunderstorm electrification, J. Atmos. Sci. 58, 2751–2770, 2001.
Bryant, G. W.: Thermoelectric Power of Single Crystals of Ice con-taining HF or NH3, Phil. Mag. 16, 495–504, 1967.
Buser, O. and Aufdermaur, A. N.: Electrification by collisions of ice particles on ice or metal targets, in Electrical Processes in the Atmosphere, Dolezalek, H. and Reiter, R. (Eds), Steinkopf, Darmstadt, Germany, 1977.
Caranti, J. M. and Illingworth, A. J.: Surface potentials of ice and thunderstorm charge separation, Nature 284, 44–46, 1980. Caranti, J. M., Illingworth, A. J., and Marsh, S. J.: The Charging of
Ice by Differences in Contact Potential, J. Geophys. Res. D 90, 6041–6046, 1985.
Castle, G. S. P.: Contact charging between insulators, J. Electrostat-ics 40&41, 13–20, 1997.
Dash, J. G., Mason, B. L., and Wettlaufer, J. S.: Theory of colli-sional charging of ice: Microphysics of thunderstorm electrifica-tion, J. Geophys. Res. 106, 20 395–20 402, 2001.
Dong, Y. and Hallett, J.: Charge Separation by Ice and Water Drops During Growth and Evaporation, J. Geophys. Res. 97, 20 361– 20 371, 1992.
FAA Aeronautical Information Manual: Section 5 (Potential flight hazards), Subsection 7-5-10 (Precipitation static), http://www.
![Table 2. Collision speed U [m s −1 ] above which pressure melting can occur in ice crystal collisions](https://thumb-eu.123doks.com/thumbv2/123doknet/14543722.535843/10.892.174.717.136.273/table-collision-speed-pressure-melting-occur-crystal-collisions.webp)