HAL Id: hal-03030093
https://hal.archives-ouvertes.fr/hal-03030093
Submitted on 7 Feb 2021
HAL is a multi-disciplinary open access archive for the deposit and dissemination of sci-entific research documents, whether they are pub-lished or not. The documents may come from teaching and research institutions in France or abroad, or from public or private research centers.
L’archive ouverte pluridisciplinaire HAL, est destinée au dépôt et à la diffusion de documents scientifiques de niveau recherche, publiés ou non, émanant des établissements d’enseignement et de recherche français ou étrangers, des laboratoires publics ou privés.
Spectroscopy Using Cyclic Nitrones
Kahina Abbas, Nikola Babić, Fabienne Peyrot
To cite this version:
Kahina Abbas, Nikola Babić, Fabienne Peyrot. Detection of Superoxide Radical in Adherent Living Cells by Electron Paramagnetic Resonance (EPR) Spectroscopy Using Cyclic Nitrones. Methods in Molecular Biology, pp.149-163, 2021, �10.1007/978-1-0716-0896-8_13�. �hal-03030093�
Detection of Superoxide Radical in Adherent Living Cells by Electron
Paramagnetic Resonance (EPR) Spectroscopy Using Cyclic Nitrones
Kahina Abbas1, Nikola Babić1, Fabienne Peyrot1,2,#
1 Laboratoire de Chimie et Biochimie Pharmacologiques et Toxicologiques, UMR CNRS 8601, Université Paris Descartes, Sorbonne Paris Cité, 45 rue des Saints-Pères, 75006 Paris, France 2 Institut National Supérieur du Professorat et de l’Éducation (INSPE) de l’Académie de Paris, Sorbonne Université, 10 rue Molitor, 75016 Paris, France
# Corresponding author: fabienne.peyrot@parisdescartes.fr
Summary/Abstract
Spin trapping with cyclic nitrones coupled to electron paramagnetic resonance (EPR) enables the detection and characterization of oxygen-derived free radicals, such as superoxide and hydroxyl radicals, in living cells. Detection is usually performed on cell suspensions introduced in glass capillaries, gas-permeable tubing, or flat cells, even when cells normally require attachment for growth. However, radical production may be influenced by cell adhesion, while enzymatic or
mechanical cell harvesting may damage the cells and alter their metabolic rates. Here, we describe the detection on adherent cells attached to microscope coverslip glasses. This method preserves cell integrity, ensures near physiological conditions for naturally adherent cells, and is relatively simple to set up. Up to 12 conditions can be screened in half a day using a single batch of culture cells.
Keywords: EPR spectroscopy, ESR spectroscopy, Spin trapping, Macrophage, Free radical, Cyclic nitrone, Superoxide.
1. Introduction
Spin trapping with cyclic nitrones combined with EPR spectroscopy allows the specific detection of oxygen-derived radical species which are involved in various diseases and in cell signaling processes, such as superoxide radical (1). In this technique, a covalent bond is formed between the trapped radical and the diamagnetic spin trap, giving rise to a paramagnetic spin adduct with a characteristic EPR spectrum (Fig. 1) (2). In theory, signatures of superoxide and hydroxyl radicals can therefore be distinguished. Resulting from extensive efforts in spin trap synthesis since the 1970s, several
structures derived from the original DMPO (5,5-dimethyl-1-pyrroline N-oxide) have been proposed with increased spin trap and spin adduct stability (3). Among them, we can cite the frequently used DEPMPO (5-diethoxyphosphoryl-5-methyl-1-pyrroline N-oxide) (4, 5), the more lipophilic DIPPMPO (5-diisopropoxyphosphoryl-5-methyl-1-pyrroline N-oxide) (6), Mito-DIPPMPO ((4R*,
5R*)-5-
(diisopropyloxyphosphoryl)-5-methyl-4-[({[2-(triphenylphosphonio)ethyl]carbamoyl}oxy)methyl]pyrroline N-oxide bromide), and CD-DIPPMPO
(6-monodeoxy-6-mono-4-[(5-diisopropoxyphosphoryl-5-methyl-1-pyrroline-N-oxyde)-ethylenecarbamoyl-(2,3-di-O-methyl) hexakis (2,3,6-tri-O-methyl)]-β-cyclodextrin), analogs bearing a triphenylphosphonium and a permethylated β-cyclodextrin moiety, respectively (7–9) (Fig. 1).
DEPMPO, DIPPMPO, and Mito-DIPPMPO are likely cell permeant, whereas CD-DIPPMPO is supposed not to enter cells (6, 8, 10, 11). Correct interpretation of spin trapping results obtained with cells requires expertise because intracellular metabolic processes interfere with the detection, especially the reduction of the aminoxyl (nitroxide) function of all spin adducts to EPR-silent hydroxylamines, and the conversion by glutathione peroxidase of the superoxide adduct to a species identical to that resulting from trapping of hydroxyl radical (12–14, 7). Possible artifacts and necessary precautions have been reviewed elsewhere (15, 16). Especially, interferences due to culture medium components and free metal ions have been highlighted. Therefore, spin trapping with cyclic nitrone must be performed in buffered saline solutions in the presence of metal chelators such as DTPA (diethylenetriaminetetraacetic acid).
[Fig. 1 near here]
Most spin trapping experiments on living cells are conducted on suspensions (8, 12, 17–23). However, results obtained with naturally adherent cells after mechanical or enzymatic detachment may
impairment (24–32). Therefore, detection on adherent cells has been achieved in several ways. Costly and fragile commercial or custom-made quartz flat cells have been used to grow macrophages (33– 35). A specific EPR cavity has been designed for horizontal positioning of EPR sample cells (36). Alternatively, microcarrier bead cultures of endothelial cells have been used inside EPR flat cells (37, 38). However, hypoxia can quickly develop within these closed systems, leading to reduced
production of superoxide and an enhanced nitroxide spin adduct reduction rate (39).
Here we present how to perform EPR detection directly on macrophages grown on microscope coverslip glasses, an easily accessible and convenient system for analysis of large numbers of samples under near-physiological conditions. In short, cells are grown on coverslips in 24-well culture plates for 24 h prior to stimulation with phorbol 12-myristate 13-acetate (PMA). Cells are then washed to eliminate interference from medium components and further incubated with the spin trap in the presence of DTPA. EPR detection is directly performed on the coverslips with cells attached (Fig. 2). We were able to detect superoxide production from PMA-stimulated RAW macrophages using different cyclic nitrone spin traps (Fig. 3) (40). Usual controls include unstimulated (NT) and PMA-stimulated cells after co-incubation of the spin trap with superoxide dismutase coupled to polyethylene glycol (SOD-PEG) (Fig. 4). The technique was initially designed for use with cyclic nitrone spin traps (40) but is compatible with other spin probes and EPR assays, as recently shown by Geroldinger et al. (41). It is especially appropriate to test different probes or stress effectors and different concentrations on the same batch of cells with technical replicates.
[Figs. 2, 3, and 4 near here]
2. Materials
Prepare all solutions using ultrapure water (resistivity of 18 MΩ cm at 25 °C) and analytical grade reagents. Diligently follow all waste and bio-hazard disposal regulations when disposing of chemical and biological waste materials.
2.1 Cell Culture
1. RAW 264.7 macrophages: Purchase from American Type Culture Collection (ATCC, CRL-9609TM). 2. Growth medium, Dulbecco’s Modified Eagle’s Medium (DMEM) supplemented with 5%
remove 30 mL of culture medium from a new 500 mL DMEM flask. Add 25 mL FBS and 5 mL of penicillin/streptomycin (10,000 U/mL). Store at 4°C.
3. Wash buffer, Dulbecco’s phosphate-buffered saline (PBS), without calcium chloride and magnesium chloride, pH 7.1-7.5. Store at 4°C.
4. Sterile trypsin-EDTA solution 1× (containing 0.5 g porcine trypsin and 0.2 g tetrasodium EDTA per liter of Hanks’ Balanced Salt Solution with phenol red). Store at 4°C (see Note 1).
5. Sterile T75 plastic cell culture flasks, with canted neck and vented cap (polystyrene, treated for enhanced cell adhesion; surface area, 75 cm2).
6. Sterile 24-well culture plates with lid (polystyrene, flat bottom, well surface ≈ 1.8 cm2).
7. Round microscope coverslip glasses (diameter, 12 mm; thickness, 0.13-0.16 mm) or equivalent: Autoclave and then rinse with 70% ethanol. Let dry under laminar flow hood before placing inside each well of a 24-well plate.
8. Laminar flow hood.
9. CO2 incubator, humidified, preset to 5% CO2 and 37°C. 10. Water bath at 37°C.
11. Centrifuge for 15/50 mL conical tubes with refrigeration. 12. Cell counter or hemocytometer.
13. 15 mL Conical tubes.
14. Tweezers with curved pointer tips and needle with bent point (like a hook).
2.2 EPR Spectroscopy
1. 0.1 M potassium phosphate buffer (KPB), pH 7.4: Add 100 mL water to a 1 L glass beaker. Weigh 13.97 g of dipotassium hydrogen phosphate (K2HPO4) and 2.69 g of potassium dihydrogen
phosphate (KH2PO4) and transfer to the beaker. Add water to a volume of about 900 mL. Mix and adjust pH with HCl or NaOH solutions if necessary (ensure that buffer solution temperature is 25°C). Transfer to a 1 L graduated cylinder and make up to 1 L with water. Store at 4°C.
2. KPB containing 1 mM DTPA: Dissolve 19.7 mg of DTPA in 50 mL KPB. Store at 4°C.
3. Spin trap stock solutions: Spin traps should be synthesized according to published protocols (see Note 2). Prepare stock solutions at 0.5 M for DEPMPO, DIPPMPO, and Mito-DIPPMPO, and 0.2 M for CD-DIPPMPO by dissolving the appropriate amount of spin trap in KPB containing 1 mM DTPA. For 1 mL stock solutions, use 117.6 mg of DEPMPO, 131.6 mg of DIPPMPO, 352.8 mg of Mito-DIPPMPO, and 346.8 mg of CD-DIPPMPO, respectively. Store at - 20°C.
4. 10 mM PMA (≥ 99% HPLC) in anhydrous DMSO: Upon receipt in lab at room temperature, PMA must be dissolved with 162 µL/mg of anhydrous DMSO (inject DMSO directly in vial through the
septum cap), and immediately stored at -20°C in 25-µL aliquots. Wrap tubes in aluminum foil to protect from light. Stable for six calendar months.
5. 0.1 M DTPA solution: Mix vigorously 39.3 mg DTPA with 1 mL 0.1 M sodium hydroxide until DTPA dissolves.
6. Solution of superoxide dismutase from bovine erythrocytes coupled to methoxy-polyethylene glycol (SOD-PEG): Dissolve the lyophilized powder in KPB to reach 2000 U/mL. Freeze 100 µL aliquots in liquid nitrogen and store at - 20°C.
7. Sterile 4-well culture plates with lid (polystyrene, flat bottom, well surface ≈ 1.9 cm2).
8. EPR-silent silicon vacuum grease (Bluestar silicones, Caronno Pertusella, Italy) or equivalent (see Note 3).
9. Custom-made quartz slides (130 × 12 × 1.5 mm). Make two small marks with a permanent marker pen at the back of the slide to indicate the optimal position of coverslips (see Note 4).
10. Elexsys 500 EPR spectrometer (Bruker, Wissembourg, France) operating at X-band (9.8 GHz) and equipped with an ER 4103TM resonator (a flat cylindrical cavity resonant in the TM110 mode). A quartz Dewar insert (WG-821-TMR-Q, Wilmad-Labglass, SP Industries, USA) is used to protect the resonator (see Note 5). The spectrometer used here is operated by the Xepr software (Bruker). 11. 96% ethanol.
3. Methods 3.1 Cell Culture
1. Grow the RAW 264.7 macrophages in 75 mL culture flasks in growth medium.
2. When the cells are 75%-90% confluent, remove the growth medium from one flask by aspiration with a pump or a pipette. Wash the cells twice with 10 mL PBS (see Note 6). Add 2 mL of Trypsin-EDTA solution (let it cover the whole cell layer) and incubate for 5 min at 37°C and 5% CO2 to detach the cells. Ensure that all cells are detached (visual inspection with or without microscope). If necessary, gently tap the flask to release any remaining attached cells. Add 8 mL of growth medium to the flask to inactivate trypsin using a 10 mL pipette. Transfer to a 15 mL conical tube.
3. Determine cell density using a cell counter or a hemocytometer.
4. Centrifuge the cells in the 15 mL tube at 190 × g for 5 min at 4°C. Remove the supernatant. 5. Resuspend the cells in growth medium to a concentration of 3 × 10⁶ cells/mL (see Note 7). 6. Insert sterilized coverslips into the wells of a 24-well plate (see Note 8).
7. Add 42 µL of cell suspension (125,000 cells/well) and 958 µL of growth medium in each well of the 24-well plate.
9. Save 2 mL of cell suspension (or more) for cell passaging. Introduce these 2 mL in a 75-mL culture flask with 18 mL growth medium and proceed as usual with the cell culture.
3.2 EPR Analysis
Spin trap, DTPA, and PBS solutions are kept at room temperature for the duration of the experiment. SOD-PEG solutions are kept on ice. PMA is kept at -20°C throughout.
1. Turn on the EPR spectrometer and open Xepr software. Connect the spectrometer and check that the calibration parameters corresponding to the TM resonator are loaded in the spectrometer
configuration. Create a new 2D experiment: Select ‘Field’ as ‘Abscissa 1’ and ‘Time’ as ‘Abscissa 2’ in the drop-down list (see Note 10). Set the acquisition parameters according to Table 1 (see Note 11). Coverslips with cells that have been incubated neither with PMA nor with spin trap should be the first sample in the series to pre-tune the cavity and record the signal for baseline correction (proceed as described below but skip steps 2, 4, and 6).
[Table 1 near here]
2. Dilute PMA to 5 µM in growth medium adding 2.00 µL of PMA stock to 4 mL growth medium (see Note 12).
3. Take out two coverslips with adherent cells from the 2well culture plate and transfer them to a 4-well plate (see Notes 8 and 13).
4. Add 1 mL of 5 µM PMA to the wells on top of the two coverslips. Incubate for 20 min at 37°C and 5% CO2. Skip this step for baseline recording.
5. Wash cells on both coverslips with 0.5 mL PBS twice.
6. Mix 3 µL DTPA (1 mM final), 6 µL of DEPMPO stock solution (10 mM final), and 291 µL of PBS in a 500 µL microtube. Add 150 µL of this preparation on each coverslip (see Note 14). Incubate for 20 min at 21°C (see Note 15). Periodically rock the plate back and forth to ensure homogenous incubation. Skip this step for baseline recording.
7. Take the coverslips out of the well. Slightly dab the back of the coverslips with tissue paper. Spread a minimum amount of grease on the quartz slide opposite the positioning marks using a pipette tip or a small spatula (see Note 3). Delicately install the coverslips on the quartz slide, cell layer facing upward (Fig. 2) (see Note 16).
8. Carefully insert the quartz slide vertically in the EPR cavity without touching the side of the Dewar insert with the cells.
9. Manually tune the EPR (see Note 17) and start recording of the EPR spectra. Save to disk when the acquisition is finished.
10. Go back to tune mode and carefully remove the quartz slide vertically from the resonator. Remove the coverslips from the quartz slide (see Note 18). Wipe the slide clean with tissue paper, ethanol, and PBS. Let it dry.
11. Repeat the procedure from step 2 to 10 for other conditions (without PMA, with PMA and SOD-PEG, with different spin traps, and so on) until all coverslips have been used. For controls without PMA, add 2.00 µL DMSO to the growth medium at step 2. For samples with PMA and SOD-PEG, replace 30 µL of PBS for 30 µL of SOD-PEG solution (200 U/mL) in the cocktail mixture at step 6. For alternative spin traps, use 6 µL DIPPMPO or Mito-DIPPMPO stock solution (10 mM final) and 7.5 µL of CD-DIPPMPO (5 mM final) instead of DEPMPO at step 6. Adjust the volume of PBS in the last case.
4. Notes
1. For long-term storage, trypsin-EDTA should be aliquoted in 15 mL conical tubes and stored at -20°C.
2. DEPMPO and DIPPMPO are commercially available. However, commercial spin traps are usually contaminated with paramagnetic nitroxides or EPR-silent hydroxylamine impurities that interfere with superoxide anion detection and produce artifacts. Purification of DEPMPO by distillation and of DIPPMPO by recrystallization is possible but difficult on a small scale. Therefore, the synthesis of spin traps following published protocols affords batches suitable for cell studies. Refer to Frejaville et al. (4) for DEPMPO synthesis and to Chalier and Tordo (6) for DIPPMPO. For Mito-DIPPMPO and CD-DIPPMPO, the procedures described for diethoxyphosphoryl analogs can be followed using diisopropyloxyphosphoryl reagents (7, 9, 42–44). Spin trap stock solutions can be checked for impurities by EPR spectroscopy prior to cell experiments using a 10 mM dilution in KPB containing DTPA with and without addition of 1 mM potassium ferricyanide (an oxidant of hydroxylamines). No signal should be
observed under both conditions.
3. Vacuum grease used to attach the microscope coverslip glasses to the quartz slide is optional. Geroldinger et al. (41) used 1.5 µL ultrapure water per coverslip instead, which was pipetted at the desired position on the slide before placing the coverslip with the cells facing outward. 4. In our setup, the center of the EPR cavity is positioned 37 mm above the lower end of the
slide, and the microwave excitation spreads over ≈ 2 cm high. Marks are thus made 31 mm and 43 mm above the lower end of the slide for 12 mm round coverslips. Geroldinger et al. (41) recently proposed an improvement of the design of the support slides to prevent contamination of the EPR quartz insert. Rectangular spacers made of glass (12 × 4 mm) can be mounted at the bottom and 70 mm above the lower end of the slide. The authors proposed
to use standard microscope glass slides (cut to 12 mm width) instead of quartz slides. However, the native EPR signal of glass interferes with the weak signals of nitrone spin adducts. When using hydroxylamine spin probes such as CMH
(1-hydroxy-3-methoxycarbonyl-2,2,5,5-tetramethylpyrrolidine hydrochloride), the signal-to-noise ratio is higher and the background signal of glass can be neglected or subtracted from the signal of interest. It is possible to omit the quartz insert, and simply insert the quartz slide directly in the cavity. Positioning of the quartz slide at the center of the cavity is then ensured by custom-made collets. In another setup, the custom-custom-made support quartz slide is replaced by a
commercial tissue quartz cell (WG-806-A-Q, Wilmad-Labglass, SP Industries, USA). Attach the coverslips opposite to the tissue cavity in this case. Beware of dropping the coverslips inside or touching the walls of the unprotected cavity.
5. Temperature control is not used here. Alternatively, the TM cavity and insert can be used with a Bruker EMX spectrometer. Benchtop EPR instruments that do not allow manual tuning are not suitable for the experiments presented here.
6. FBS present in growth medium inhibits trypsin action. Add reagents against the side wall of the flask to avoid detaching the cells at this stage. Gently shake the flask back and forth to remove all FBS.
7. The cell pellet may be difficult to disperse without formation of cell aggregates. Therefore, first add 1 mL of growth medium to the cell pellet, and gently pipet up and down with a 1 mL pipette tip set to 400 µL to disperse the pellet without forming any bubbles. Then add the rest of the growth medium and gently pipet up and down with a 10 mL pipette. Take care not to damage the cells at this stage.
8. The coverslip should lie flat on the well bottom. Avoid putting multiple coverslips in one well because movements may damage the cell layer. Manipulation of the coverslips requires great care to avoid breaking them. Tweezers with curved, pointed tips can be used to seize them, and a needle with bent point can serve as a hook to lift them from the well bottom. Once the coverslips are covered with cells, the side with cells appears slightly less shiny than the glass surface and can be recognized by scratching the edge of the cell layer a little with a needle tip. Make sure not to damage the cells while manipulating the coverslips.
9. Under these conditions, 75-90% confluence (250,000 cells per coverslip) is obtained after 24 h of culture with RAW 264.7 macrophages. If other cell types are to be used, optimization of cell culture conditions should be performed to obtain appropriate cell confluence. The EPR signal increases with cell number but the cell layer tends to peel off the glass surface at high cell density, leading to a drop in reproducibility.
10. Refer to Elexsys E 500 user’s manual for detailed procedure (45). The use of a 2D experiment and the sequential recording of a temporal series of EPR spectra are preferred to signal
accumulation in a 1D experiment because time evolution of the spectra can be monitored with the former method. At the end of the experiment, a sum of ten spectra is performed to increase the signal-to-noise ratio.
11. Here a slight overmodulation of the signal is used to increase the signal-to-noise ratio without significantly distorting the signal. At this stage, it is good practice to record a background EPR spectrum without any sample to ensure the cavity is not contaminated by unwanted
paramagnetic impurities. If contamination is detected, clean the Dewar insert and TM cavity according to the user’s manual.
12. The final concentration of DMSO in the growth medium is 0.5 % and is well tolerated by the cells. Here twice the volume needed for two coverslips is prepared to avoid pipetting very small volumes. Moreover, it is often desirable to prepare four coverslips at a time even if only two are used for EPR to prevent wasting time if you drop coverslips on the bench or break one during the experiment.
13. The use of 4-well plates is convenient but not mandatory. 24-well plates can be used instead. 14. 150 µL is the minimal volume required to cover the cells. However, when the quantity of EPR
probe is not limiting such as with hydroxylamine spin probes, it is desirable to increase the incubation volume to 300 µL/well or more to ensure a more homogenous incubation of the cells without shaking of the plate.
15. Incubation time with the spin trap is a compromise of maximum formation of the spin adduct by the spin trapping reaction and minimum spin adduct decay.
16. Because the cell layer is exposed to air without medium, the rest of the procedure must be carried out quickly before cells dry out. The decrease of EPR intensity after 10 min of recording is a clear indication of this phenomenon. A 50% larger signal was observed with this orientation of the cells compared to the situation where the cell layer faced the quartz slide using nitrone spin traps. This is likely due to a better diffusion of oxygen to the cell layer which induces a sustained enzymatic production of superoxide and a slower reduction of nitroxide spin adducts by reductases.
17. Refer to Elexsys E 500 user’s manual for detailed procedure (45). You may rotate the Dewar insert slightly on its axis inside the resonator to optimize the position of the slide and
maximize the depth of the cavity “dip”. Before acquiring the spectra, you may want to center the field-sweep window around the EPR signal to compensate for changes in resonating frequency of the cavity between samples: Read the uncorrected g-factor of the spin adduct from a previously recorded spectrum, write the value in the “Sample g-Factor” box under the “Absc.1: Field” tab, and then click the “Set Field to Sample g-Factor” option.
18. Cells on the coverslips can be recovered after EPR for protein titration or another biochemical assay. For this purpose, transfer the coverslips to clean wells and add 50 µL lysis buffer per
coverslip. Follow the appropriate procedure for the desired titration. Protein titration can be used to normalize the EPR signal intensity.
5. References
1. Bartosz G (2009) Reactive oxygen species: destroyers or messengers? Biochem Pharmacol 77:1303–1315. https://doi.org/10.1016/j.bcp.2008.11.009
2. Janzen EG (1971) Spin trapping. Acc Chem Res 4:31–40. https://doi.org/10.1021/ar50037a005
3. Ouari O, Hardy M, Karoui H, et al (2011) Recent developments and applications of the coupled EPR/spin trapping technique (EPR/ST), In: Gilbert BC, Murphy DM, Chechik V (eds) Electron Paramagnetic Resonance, vol 22. RSC Publishing, Cambridge, pp. 1–40.
https://doi.org/10.1039/9781849730877-00001
4. Frejaville C, Karoui H, Tuccio B, et al (1994) 5-Diethoxyphosphoryl-5-methyl-1-pyrroline N-oxide (DEPMPO) - a new phosphorylated nitrone for the efficient in-vitro and in-vivo spin-trapping of oxygen-centered radicals. J Chem Soc-Chem Commun 1793–1794.
https://doi.org/10.1039/c39940001793
5. Khan N, Wilmot CM, Rosen GM, et al (2003) Spin traps: in vitro toxicity and stability of radical adducts. Free Radic Biol Med 34:1473–1481. https://doi.org/10.1016/S0891-5849(03)00182-5
6. Chalier F and Tordo P (2002) 5-Diisopropoxyphosphoryl-5-methyl-1-pyrroline N-oxide,
DIPPMPO, a crystalline analog of the nitrone DEPMPO: synthesis and spin trapping properties. J Chem Soc-Perkin Trans 2 2110–2117. https://doi.org/10.1039/b206909c
7. Bézière N, Hardy M, Poulhès F, et al (2014) Metabolic stability of superoxide adducts derived from newly developed cyclic nitrone spin traps. Free Radic Biol Med 67:150–158.
https://doi.org/10.1016/j.freeradbiomed.2013.10.812
8. Abbas K, Hardy M, Poulhès F, et al (2014) Detection of superoxide production in stimulated and unstimulated living cells using new cyclic nitrone spin traps. Free Radic Biol Med 71:281–290. https://doi.org/10.1016/j.freeradbiomed.2014.03.019
9. Hardy M, Poulhés F, Rizzato E, et al (2014) Mitochondria-targeted spin traps: synthesis, superoxide spin trapping, and mitochondrial uptake. Chem Res Toxicol 27:1155–1165. https://doi.org/10.1021/tx500032e
10. Ross MF, Kelso GF, Blaikie FH, et al (2005) Lipophilic triphenylphosphonium cations as tools in mitochondrial bioenergetics and free radical biology. Biochem Mosc 70:222–230.
https://doi.org/10.1007/s10541-005-0104-5
11. Anzai K, Aikawa T, Furukawa Y, et al (2003) ESR measurement of rapid penetration of DMPO and DEPMPO spin traps through lipid bilayer membranes. Arch Biochem Biophys 415:251–256. https://doi.org/10.1016/S0003-9861(03)00260-1
12. Rosen GM and Freeman BA (1984) Detection of superoxide generated by endothelial cells. Proc Natl Acad Sci 81:7269–7273
13. Culcasi M, Rockenbauer A, Mercier A, et al (2006) The line asymmetry of electron spin resonance spectra as a tool to determine the cis:trans ratio for spin-trapping adducts of chiral pyrrolines N-oxides: the mechanism of formation of hydroxyl radical adducts of EMPO, DEPMPO, and DIPPMPO in the ischemic-reperfused rat liver. Free Radic Biol Med 40:1524– 1538. https://doi.org/10.1016/j.freeradbiomed.2005.12.029.
14. Bézière N, Frapart Y, Rockenbauer A, et al (2010) Metabolic stability of superoxide and hydroxyl radical adducts of a cyclic nitrone toward rat liver microsomes and cytosol: A stopped-flow ESR spectroscopy study. Free Radic Biol Med 49:437–446.
https://doi.org/10.1016/j.freeradbiomed.2010.04.035
15. Abbas K, Babić N, and Peyrot F (2016) Use of spin traps to detect superoxide production in living cells by electron paramagnetic resonance (EPR) spectroscopy. Methods San Diego Calif 109:31– 43. https://doi.org/10.1016/j.ymeth.2016.05.001
16. Villamena FA (2016) Reactive species detection in biology: from fluorescence to electron paramagnetic resonance spectroscopy, Elsevier, Amsterdam
17. Green MR, Hill HA, Okolow-Zubkowska MJ, et al (1979) The production of hydroxyl and superoxide radicals by stimulated human neutrophils - measurements by EPR spectroscopy. FEBS Lett 100:23–26
18. Rosen H and Klebanoff SJ (1979) Hydroxyl radical generation by polymorphonuclear leukocytes measured by electron spin resonance spectroscopy. J Clin Invest 64:1725–1729.
https://doi.org/10.1172/JCI109637
19. Britigan B, Rosen G, Chai Y, et al (1986) Do human neutrophils make hydroxyl radical - determination of free radicals generated by human neutrophils activated with a soluble or
particulate stimulus using electron paramagnetic resonance spectrometry. J Biol Chem 261:4426– 4431
20. Britigan BE, Rosen GM, Thompson BY, et al (1986) Stimulated human neutrophils limit iron-catalyzed hydroxyl radical formation as detected by spin-trapping techniques. J Biol Chem 261:17026–17032
21. Hassett DJ, Britigan BE, Svendsen T, et al (1987) Bacteria form intracellular free radicals in response to paraquat and streptonigrin. Demonstration of the potency of hydroxyl radical. J Biol Chem 262:13404–13408
22. Pou S, Cohen MS, Britigan BE, et al (1989) Spin-trapping and human neutrophils. Limits of detection of hydroxyl radical. J Biol Chem 264:12299–12302
23. Ramos CL, Pou S, Britigan BE, et al (1992) Spin trapping evidence for myeloperoxidase-dependent hydroxyl radical formation by human neutrophils and monocytes. J Biol Chem 267:8307–8312
24. Revel JP, Hoch P, and Ho D (1974) Adhesion of culture cells to their substratum. Exp Cell Res 84:207–218. https://doi.org/10.1016/0014-4827(74)90398-X
25. Wu Y, Wu J, Lee DY, et al (2005) Versican protects cells from oxidative stress-induced apoptosis. Matrix Biol 24:3–13. https://doi.org/10.1016/j.matbio.2004.11.007
26. Piercy KT, Donnell RL, Kirkpatrick SS, et al (2001) Effect of harvesting and sorting on β-1 integrin in canine microvascular cells. J Surg Res 100:211–216.
https://doi.org/10.1006/jsre.2001.6247
27. Mutin M, George F, Lesaule G, et al (1996) Reevaluation of trypsin-EDTA for endothelial cell detachment before flow cytometry analysis. Endothelium 4:289–295.
28. Hirai H, Umegaki R, Kino-oka M, et al (2002) Characterization of cellular motions through direct observation of individual cells at early stage in anchorage-dependent culture. J Biosci Bioeng 94:351–356. https://doi.org/10.1016/S1389-1723(02)80176-1
29. Batista U, Garvas M, Nemec M, et al (2010) Effects of different detachment procedures on viability, nitroxide reduction kinetics and plasma membrane heterogeneity of V-79 cells. Cell Biol Int 34:663–668. https://doi.org/10.1042/CBI20090276
30. Lee J-W and Kim J-H (2013) Activation of the leukotriene B4 receptor 2-reactive oxygen species (BLT2-ROS) cascade following detachment confers anoikis resistance in prostate cancer cells. J Biol Chem 288:30054–30063. https://doi.org/10.1074/jbc.M113.481283
31. Chanvorachote P and Chunhacha P (2013) Caveolin-1 regulates endothelial adhesion of lung cancer cells via reactive oxygen species-dependent mechanism. PloS One 8:e57466.
https://doi.org/10.1371/journal.pone.0057466
32. Kerkweg U, Petrat F, Korth H-G, et al (2007) Disruption of skeletal myocytes initiates superoxide release: contribution of NADPH oxidase. Shock 27:552–558.
https://doi.org/10.1097/01.shk.0000245027.39483.e4
33. Hume DA, Gordon S, Thornalley PJ, et al (1983) The production of oxygen-centered radicals by bacillus-Calmette-Guerin-activated macrophages. An electron paramagnetic resonance study of the response to phorbol myristate acetate. Biochim Biophys Acta 763:245–250.
https://doi.org/10.1016/0167-4889(83)90131-3
34. Tanigawa T, Kotake Y, and Reinke LA (1993) Spin trapping of superoxide from glass adherent polymorphonuclear leukocytes induced by N-formylmethionyl-leucyl-phenylalanine. Free Radic Res Commun 19:101–110
35. Nakagawa H, Moritake T, Tsuboi K, et al (2000) Induction of superoxide in glioma cell line U87 stimulated with lipopolysaccharide and interferon-gamma: ESR using a new flow-type quartz cell. FEBS Lett 471:187–190. https://doi.org/10.1016/S0014-5793(00)01398-3
36. Kotake Y, Reinke LA, Tanigawa T, et al (1994) Determination of the rate of superoxide
generation from biological systems by spin trapping: use of rapid oxygen depletion to measure the decay rate of spin adducts. Free Radic Biol Med 17:215–223. https://doi.org/10.1016/0891-5849(94)90077-9
37. Britigan BE, Roeder TL, and Shasby DM (1992) Insight into the nature and site of oxygen-centered free radical generation by endothelial cell monolayers using a novel spin trapping technique. Blood 79:699–707
38. Danhier P, Copetti T, De Preter G, et al (2013) Influence of cell detachment on the respiration rate of tumor and endothelial cells. PloS One 8:e53324. https://doi.org/10.1371/journal.pone.0053324
39. Swartz HM (1987) Use of nitroxides to measure redox metabolism in cells and tissues. J Chem Soc Faraday Trans 1 Phys Chem Condens Phases 83:191–202.
https://doi.org/10.1039/F19878300191
40. Abbas K, Hardy M, Poulhès F, et al (2015) Medium-throughput ESR detection of superoxide production in undetached adherent cells using cyclic nitrone spin traps. Free Radic Res 49:1122– 1128. https://doi.org/10.3109/10715762.2015.1045504
41. Geroldinger G, Rezk M, Idris R, et al (2019) Techniques to study phagocytosis and uptake of Leishmania tarentolae by J774 macrophages. Exp Parasitol 197:57–64.
https://doi.org/10.1016/j.exppara.2019.01.012
42. Hardy M, Bardelang D, Karoui H, et al (2009) Improving the trapping of superoxide radical with a beta-cyclodextrin-5-diethoxyphosphoryl-5-methyl-1-pyrroline-N-oxide (DEPMPO) conjugate. Chem- Eur J 15:11114–11118. https://doi.org/10.1002/chem.200901342
43. Hardy M, Chalier F, Ouari O, et al (2007) Mito-DEPMPO synthesized from a novel NH2-reactive DEPMPO spin trap: a new and improved trap for the detection of superoxide. Chem Commun 1083–1085. https://doi.org/10.1039/b616076j
44. Hardy M, Rockenbauer A, Vasquez-Vivar J, et al (2007) Detection, characterization, and decay kinetics of ROS and thiyl adducts of Mito-DEPMPO spin trap. Chem Res Toxicol 20:1053–1060. https://doi.org/10.1021/tx700101d
45. Jiang DJ and Weber DRT (2001) Elexsys E 500 user’s manual: basic operations, EPR Division, Bruker Instruments, Inc., Billerica, MA USA
6. Figure Captions
Fig. 1 Structure of cyclic nitrone spin traps and general principles of spin trapping
Fig. 2 Experimental procedure for the detection of superoxide on adherent cells. RAW macrophages in growth medium are placed on round microscope coverslip glasses inserted in a 24-well culture plate. After 24h at 37°C and 5% CO2, confluent cells on two coverslips (250,000 cells/coverslip) are
optionally treated with PMA (5 µM, 20 min, 37°C), washed twice with PBS, and incubated for 20 min at 21°C with the desired spin trap (5-10 mM) in 150 µL PBS containing DTPA (1 mM). Both
coverslips are then transferred to a quartz slide (with optional spacers (see Note 4)) and inserted into the EPR TM resonator equipped with a quartz Dewar insert
Fig. 3 Comparison of experimental EPR spectra obtained in the presence of PMA-stimulated RAW macrophages attached to two microscope coverslip glasses with different nitrone spin traps (black lines; sum of ten scans after baseline subtraction). Calculated spectra are overlaid (red)
Fig. 4 Comparison of EPR spectra (sum of ten scans after baseline subtraction) obtained with DEPMPO (10 mM) in the presence of non-treated (NT) and PMA-stimulated RAW macrophages attached to two microscope coverslip glasses with or without addition of SOD-PEG (200 U/mL)
7. Figures
8. Table Captions
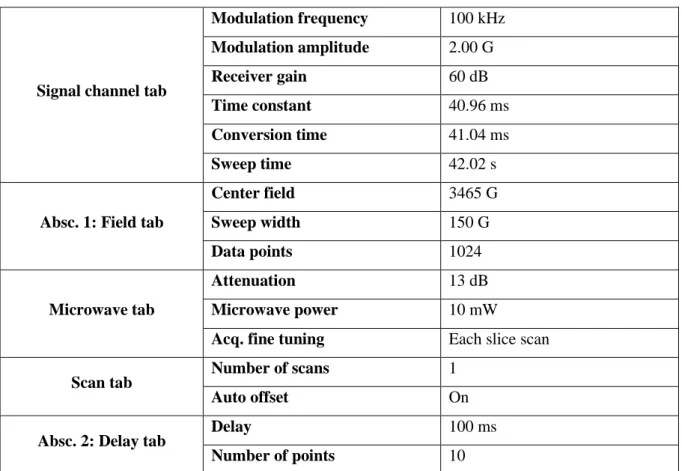
Table 1 EPR acquisition parameters
9. Tables
Table 1
Signal channel tab
Modulation frequency 100 kHz Modulation amplitude 2.00 G Receiver gain 60 dB Time constant 40.96 ms Conversion time 41.04 ms Sweep time 42.02 s
Absc. 1: Field tab
Center field 3465 G Sweep width 150 G Data points 1024 Microwave tab Attenuation 13 dB Microwave power 10 mW
Acq. fine tuning Each slice scan
Scan tab Number of scans 1
Auto offset On
Absc. 2: Delay tab Delay 100 ms