HAL Id: hal-01919354
https://hal.inria.fr/hal-01919354
Submitted on 12 Nov 2018
HAL is a multi-disciplinary open access
archive for the deposit and dissemination of
sci-entific research documents, whether they are
pub-lished or not. The documents may come from
teaching and research institutions in France or
abroad, or from public or private research centers.
L’archive ouverte pluridisciplinaire HAL, est
destinée au dépôt et à la diffusion de documents
scientifiques de niveau recherche, publiés ou non,
émanant des établissements d’enseignement et de
recherche français ou étrangers, des laboratoires
publics ou privés.
Conducting Thousands of Experiments to Analyze VMs,
Dockers and Nested Dockers Boot Time
Thuy Linh Nguyen, Adrien Lebre
To cite this version:
Thuy Linh Nguyen, Adrien Lebre. Conducting Thousands of Experiments to Analyze VMs, Dockers
and Nested Dockers Boot Time. [Research Report] RR-9221, INRIA. 2018, pp.1-13. �hal-01919354�
ISSN 0249-6399 ISRN INRIA/RR--9221--FR+ENG
RESEARCH
REPORT
N° 9221
November 2018 Project-Team StackConducting Thousands of
Experiments to Analyze
VMs, Dockers and Nested
Dockers Boot Time
RESEARCH CENTRE
RENNES – BRETAGNE ATLANTIQUE
Campus universitaire de Beaulieu 35042 Rennes Cedex
Conducting Thousands of Experiments to Analyze
VMs, Dockers and Nested Dockers Boot Time
Thuy Linh Nguyen, Adrien Lebre
Project-Team Stack
Research Report n° 9221 — November 2018 — 13 pages
Abstract: While many studies have been focusing on reducing the time to manipulate Virtual
Machine/Container images in order to optimize provisioning operations in a Cloud infrastructure, only a few studies have considered the time required to boot these systems. Some previous researches showed that the whole boot process can last from a few seconds to few minutes depending on co-located workloads and the number of concurrent deployed machines. In this paper, we discuss a large experimental campaign that allows us to understand in more details the boot duration of both virtualization techniques under various storage devices and resources contentions. Particularly, we analyzed thoroughly the boot time of VMs, Dockers on top of bare-metal servers, and Dockers inside VMs, which is a current trend of public Cloud Computing such as Amazon Web Services or Google Cloud. We developed a methodology that enables us to perform fully-automatized and reproducible experimental campaigns on a scientific testbed. Thanks to this methodology, we conducted more than 14.400 experiments on Grid’5000 testbed for a bit more than 500 hours. The results we collected provide an important information related to the boot time behavior of these two virtualization technologies. Although containers boot much faster than VMs, both containers and VMs boot time are impacted by the co-workloads on the same compute node.
Comment conduire des milliers d’expériences pour analyser les temps
de démarrage d’un environment d’exécution de type machines
virtuelle ou conteneur
Résumé : Si de nombreuses études se sont concentrées sur la réduction du temps nécessaire
pour manipuler les images de machines virtuelles/conteneurs afin d’optimiser les opérations de provisionnement dans une infrastructure Cloud, seules quelques études ont examiné le temps requis pour le démarage de ces systèmes. Plusieurs travaux antérieurs ont montré que l’ensemble du processus de démarrage peut durer de quelques secondes à plusieurs minutes en fonction des charges de travail co-localisées et du nombre de machines déployées simultanément.
Dans cet article, nous expliquons la méthodologie mise en place afin de conduire une grande campagne expérimentale sur les technologies de machines virtuelles et de conteneurs afin de comprendre plus en détail l’impact des conflits d’accès aux ressources tels que les périphériques de stockage. En particulier, nous avons analysé et comparé le temps de démarrage des machines virtuelles, des conteneurs Docker hébergés sur des serveurs physiques et de ceux hébergés sur des serveurs virtualisés, ce dernier correspondant à une tendance actuelle du Cloud Computing public tel qu’Amazon Web Services ou Google Cloud Platform. Nous avons développé une méthodologie permettant de conduire des campagnes expérimentales entièrement automatisables et facilement reproductibles sur une plateforme scientifique telle que l’infrastructure Grid’5000. Grâce à cette méthodologie, nous avons pu réaliser plus de 14400 expériences pour une durée totale d’un peu plus de 500 heures. Les résultats que nous avons collectés fournissent des informations importantes sur le comportement au démarrage de ces deux technologies de virtualisation.
3
Conducting Thousands of Experiments to
Analyze VMs, Dockers and Nested
Dockers Boot Time
Thuy Linh Nguyen, Adrien Lebre
IMT Atlantique
INRIA, LS2N, France
thuy-linh.nguyen@inria.fr, adrien.lebre@inria.fr
While many studies have been focusing on reducing the time to manipulate Virtual Ma-chine/Container images in order to optimize provi-sioning operations in a Cloud infrastructure, only a few studies have considered the time required to boot these systems. Some previous researches showed that the whole boot process can last from a few seconds to few minutes depending on co-located workloads and the number of concurrent deployed machines. In this paper, we discuss a large experimental campaign that allows us to understand in more details the boot duration of both virtualization techniques under various stor-age devices and resources contentions. Particu-larly, we analyzed thoroughly the boot time of VMs, Dockers on top of bare-metal servers, and Dockers inside VMs, which is a current trend of public Cloud Computing such as Amazon Web Services or Google Cloud. We developed a methodology that enables us to perform fully-automatized and reproducible experimental cam-paigns on a scientific testbed. Thanks to this methodology, we conducted more than 14.400 experiments on Grid’5000 testbed for a bit more than 500 hours. The results we collected provide an important information related to the boot time behavior of these two virtualization technologies. Although containers boot much faster than VMs, both containers and VMs boot time are impacted by the co-workloads on the same compute node.
I. INTRODUCTION
Resource virtualization technologies play an essential role in plenty of Cloud Computing
infras-tructures. For many years, applications develop-ers embrace either hypervisor-based virtualization (a.k.a. virtual machine) or OS-based virtualization (a.k.a. container) to benefit from cloud resources. When comparing these two technologies, prior researches [1], [2], [3], [4] mainly focused on the application’s performance aspect where containers were presented as a better alternative to VMs. All these works presented the same conclusion: the performance of a container-based application is close to that of the bare metal, while there was a significant performance degradation when running the same application in a VM. Although valuable, these studies did not examine the boot duration of VMs/containers.
The boot operation is a key factor in the re-sources provisioning process in a cloud system. Because the VM/container boot process consumes CPU, I/O and possibly network resources, under-standing how co-located VMs/containers impact the boot process of a new VM/container (and reciprocally) is important. For example, without the proper understanding of the VMs/containers boot time behaviors, it can take some minutes to boot a VM/container if it is allocated on a high resources contention compute node. This situation is critical when the customers need to turn on a VM/container to handle a burst of incoming requests to their systems and potentially causes the economic loss. To the best of our knowledge, only a few studies have investigated the question of the boot time. Sonone et al. [4] proposed a preliminary analysis of containers and VMs boot time. However, this study has been limited to one
4 Thuy Linh Nguyen, Adrien Lebre
constrained scenario. Xavier et al. [5] compared the boot time between KVM, Docker and Uniker-nel in the concurrent boot scenarios on OpenStack platform. Recent works [6], [7] showed that under resource contentions, the boot time of one VM can take from few seconds up to more than a minute. Because the duration of a boot process is es-sential to the provisioning operation in a cloud infrastructure, it is important to understand how resource workloads such as CPU utilization, mem-ory usage, I/O and network bandwidth on sev-eral storage devices and different boot parameters impact the behavior of booting VMs as well as containers. In this paper, we conducted thousands of experiments in order to investigate in details the boot time of VMs, containers and nested containers (i.e., a container running inside a VM). We choose KVM [8] and Docker [9] for our evaluation because they are the most widely used virtualization solutions. From this point forward, the term "docker" is used interchangeably with "docker container".
As far as we know, this is the first study that deals with many different resource contention sce-narios for the boot time. Our results first confirm that with different configured parameters, the boot time of VMs can last few seconds to minutes. Second, containers achieve generally better boot performance when compared with traditional vir-tual machines. However, both VMs and containers boot time generally share the same patterns under high I/O utilization. While we discuss some of the results we collected, the contribution of the paper is twofold as it also presents in details the method we used to achieve such a large-scale campaign of experiments. All the scripts we used, are available
on a public git repository1. The code can be reused
in order to perform similar experiments on other testbeds such as the Chameleon [10] (with slight adaptations in order to remove the dependency to Grid’5000).
The rest of this article is organized as fol-lows. Section II presents related works. Section III describes the script we conducted to execute all experiments automatically. We present the ex-periment protocol in Section IV and analyze the results of differrent scenarios in Section V and
1https://github.com/ntlinh16/vm5k
Section VI. Finally, the conclusion is in Section VII.
II. RELATEDWORK
Most of the researches in literature performed experiments to evaluate the performance of con-tainers and virtual machines. Morabito et al. [1] and Felter et al. [2] used various benchmarks to stress different resources on the compute node to explore the difference in performance aspects. These studies concluded that running an applica-tion on container have a better performance than on a VM. They both agreed the disk I/O path is a bottleneck for hypervisor-based virtualiza-tion. From a data center perspective, Sharma et
al. [3] conducted a comparative study from the
perspective of performance, isolation and resource allocation of hardware and OS-level virtualization. Sonone et al. [4] focused on evaluating the mem-ory utilization between container and VM. Be-sides, their work compared boot time of containers and VMs. However, there was only one simple experiment, which analyzed the boot time of 10 VMs/containers. They avoided disk utilization during boot up by caching all required disk blocks. The results showed that containers boot in a rel-ative short time with a CPU resource usage less than the VMs one. In [6], the authors performed a detailed study of the boot time of a VM under different workload contentions and introduced a reference model to represent the resource over-head during the VM boot process. Xavier et al. [5] launched multiple VMs/containers/unikernels concurrently to measure the boot time within the full provisioning process of OpenStack platforms. The experiment only focused on starting multiple instances in parallel. Although valuable, we under-line that all these studies have been unfortunately done in an ad-hoc manner. That is, they did not provide scripts or enough information to reproduce and extend them.
In our previous work [7], we conducted a first series of experiments measuring VM boot times. Besides CPU, I/O and network usages, we found that there are multiple other factors to take into account to deliver an accurate model of VM boot operations (cache modes, VM disk types, storage device types etc.). In order to identify how these factors impact on the boot duration, we conducted
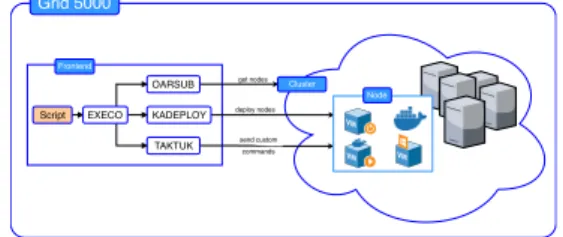
Conducting Thousands of Experiments to Analyze VMs, Dockers and Nested Dockers Boot Time 5 OARSUB KADEPLOY TAKTUK Script EXECO Frontend Cluster Node get nodes deploy nodes send custom Grid 5000 commands
Fig. 1: Engine Architecture
additional experiments and extend them to the containerization technologies. We present in this paper how such an evaluation has been performed and the results we gathered.
III. A SOFTWAREDEFINEDEXPERIMENT
All our experiments have been performed on top of the Grid’5000 testbed [11]. We created a dedicated script to create and manage VMs auto-matically by leveraging the Execo framework [12]
and libvirt. Precisely, our script extends vm5k2
- a python module to perform reproducible ex-periments of VMs on the Grid’5000 platform. At coarse-grained, vm5k relieves researchers of the burden of deploying virtualization stack on bare-metal servers: (1) it deploys and configures servers with all necessary packages, (2) it creates the VMs templates according to the defined parameters, (3) it starts VMs and (4) it performs specific benchmarks and collect information. By extending vm5k and using advanced features of Execo, we completely scripted our experimental campaign in order to measure the boot time and monitor the resource usage during the boot process for both VMs and containers. We underlined this script al-lows any researchers to reproduce all experiments anytime as it performs all scenarios in an isolated environment.
Figure 1 shows the workflow of our script. First, the script reserves compute nodes in Grid’5000’s clusters by using OARSUB software suite [13]. Then Kadeploy3 [14] is used to deploy these com-pute nodes with specific Linux environment and set up the network. Next, we install some software and tools required for our experiments by utilizing Taktuk [15] to send installation commands. When the compute nodes are ready, we loop through all
2http://vm5k.readthedocs.io/
the combinations of scenarios for our experiment, which will be explained in Section IV. For each combination, we use Execo [12] with Taktuk to run the scripted scenario and collect results from the compute nodes. All the results are gathered and saved on a machine where the script is executed.
IV. EXPERIMENTSSETUP
A. Infrastructure
Each compute node has 2 Intel Xeon E5-2660 CPUs (8 physical cores each) running at 2.2GHz; with 64GB of memory, and 10 Gigabit Ethernet. We evaluated our results on three different storage devices: HDD, SSD and CEPH. We have 10.000 rpm Seagate Savvio 200GB HDD with 148MB/s throughput, Toshiba PX04SMB040 400GB SSDs with 700MB/s throughput, and a 5-nodes CEPH system with HDD. We used CEPH 10.2.5, and mount it as a block device with ext4 format on the compute node.
B. VM and Docker Configurations
We set up all VMs and containers with 1 vCPU and 1 GB of memory. In our experiments, we defined two type of machines:
• e − machine is an experimenting machine
(i.e., VM, docker or nested docker) which is used to measure the boot time;
• co − machine is a co-located machine, it is
allocated on the same compute node as
e-machineand runs competitive workloads;
We used Docker [9] version 17.05.0-ce, build 89658be, with auf s storage driver. For VM, the hypervisor is Qemu/KVM (Qemu-2.1.2 and Linux-3.2) [8], virtio [16] is enabled for network and disk device drivers. The I/O scheduler of VMs and the compute node are CFQ. We created the combinations of booting VMs by using the following parameters:
• cpu_policy: whether all VMs/dockers are
started on the same physical core or each VM/docker is isolated on a dedicated core.
• boot_policy: defines the way to boot e-VMs
– (a) one then other: the first VM is booted completely, then we boot the rest of VMs simultaneously.
– (b) all at once: all VMs are booted at the same time.
6 Thuy Linh Nguyen, Adrien Lebre
• cache_mode: we use writeback,
writethrough and none when configuring a
VM. A detail explanation for each cache mode is available at [17].
• image_policy : is the way to create a VM
disk. There are two strategies:
– (a) shared image: a VM disk has two components: a backing file and a COW (copy-on-write) image. Backing file is an original VM image (VMI) and shared between many VMs. When a VM gener-ates read accesses, the hypervisor checks if the needed data is not on the COW image, it will read from the backing file. All write operations from VM are stored on the COW image directly;
– (b) no shared image: a VM disk image is fully cloned from the original VMI. All read/writes accesses generated from the VM will be performed on this standalone disk.
We combined the above parameters to cover a maximum of boot scenarios because the boot time is not only impacted by resource contention on the same compute node but also the way VMs are booted and the way they are created. We underline that we did not consider the configuration of a VM. Indeed, Wu et al [6] showed the capacity of a VM does not impact the duration of a VM boot process (i.e., a VM with 1 core and 2G memory takes a similar time to boot as a VM with 16 cores and 32GB). We also did not consider the size of a VMI. Although the application files can significantly increase the size of the VMI, only the kernel data is loaded for the boot process. Several studies [18], [19], [20] confirmed that a small portion of a VMI is loaded during a VM boot process.
C. Benchmark Tools
1) LINPACK: 3is used to produce CPU
work-loads. LINPACK estimates a system’s floating point computing power by measuring how fast a computer solves a dense n by n system of linear equations Ax = b.
3http://people.sc.fsu.edu/ jburkardt/c_src/linpack_bench/
linpack_bench.html
2) CacheBench: 4 is a benchmark to evaluate
the raw bandwidth in megabytes per second of the memory of computer systems. It includes read, write and modify operations on the memory to fully simulate the effect of memory usage.
3) Stress: 5 simulates an I/O stress by
spawn-ing a number of workers to continuously write to files and unlink them.
4) Iperf: 6 measures the maximum achievable
bandwidth on IP networks. Iperf creates TCP and UDP data streams to measure the throughput of a network that is carrying them.
D. Boot time
In our work, the boot time is calculated as the duration to perform only the boot process. We did not take into account the duration of VM/container placement nor the VMI transferring process. The boot duration is measured as follows:
VM boot time:we assume that a VM is ready to
be used when the guest OS is deployed completely and clients can log into the VM, therefore, we calculated the VM boot duration as the time to have the SSH service started. This time can be retrieved by reading the system log, and it is mea-sured with milliseconds precision. In our setup, we configured SSH as the first service to be started.
Docker boot time: The main idea behind a
container is running applications in isolation from each other [9]. For this reason, docker boot du-ration is considered as the time to get a service runs inside a docker. Specifically, by using Docker
CLI7, we measured the boot time as the duration
for starting the SSH service inside a docker.
Nested Docker boot time: We measured this
boot time in the same manner as the Docker boot time. We did not include the host VM boot time in this calculation.
V. BOOT TIME IN NO-WORKLOAD
ENVIRONMENT
This scenario aims to evaluate how the boot time is affected when multiple machines are
4http://icl.cs.utk.edu/llcbench/cachebench.html 5http://people.seas.harvard.edu/~apw/stress/ 6https://iperf.fr/
7https://docs.docker.com/engine/reference/commandline/cli/
Conducting Thousands of Experiments to Analyze VMs, Dockers and Nested Dockers Boot Time 7
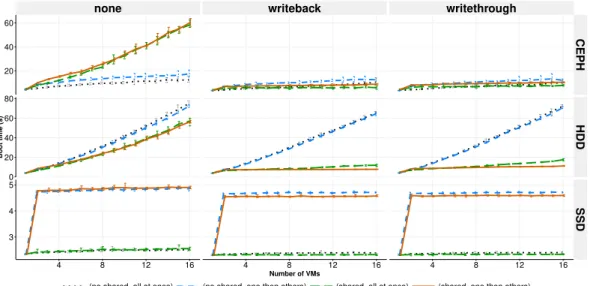
none writeback writethrough
20 40 60 0 20 40 60 80 3 4 5 CEPH HDD SSD 4 8 12 16 4 8 12 16 4 8 12 16 Number of VMs Boot time (s)
(no shared, all at once) (no shared, one then others) (shared, all at once) (shared, one then others)
Fig. 2: Boot time of VMs with different installations on three storage devices
booted simultaneously on different storage de-vices. We boot several e-machine on a "fresh" compute node (i.e., a compute node without the co-located workload and an empty page cache). Each e-machine is assigned to a single core to avoid CPU contention, the number of e-machines has been increased from 1 to 16 because the compute node we used only has 16 physical cores. For VMs, we created them with two types of disk creation strategies, three cache modes and they are booted in two ways: all at once and one then others.
A. VM Boot Time
Figure 2 reveals that even on a "fresh" node when we boot 16 VMs simultaneously, the boot duration can last more than one minute in the worse case. In comparison, it only takes 4.5 sec-onds to boot one VM. The expected impact on VM boot time in this experiment is mostly the I/O throughput from loading the kernel files and writing the system log from VMs.
On HDD, the boot time of VMs with shared
image disk is always faster than the no shared
one in three cases of cache mode. When the cache mode is on (i.e., writeback and writethrough), the boot time of VM with shared image disk is much faster. The reason is when the very first VM boots, the mandatory data for VM boot process on
the backing file is loaded on the memory, and then, because all VMs are sharing the same backing file, the following VMs can access this data directly from the memory and do not generate read access to the storage device. In the meanwhile, with no
shared imagestrategy, because every VM has its
standalone disk, the mandatory data has to be read many times even all these VMs are created from the same VMI. In case of none cache mode, VMs with shared image disk also have to read the boot data from backing file many times. Moreover, there is the overhead of read access checking of
shared imagestrategy. Therefore, the boot time is
less faster than the no shared one.
To compare one then others and all at onces boot policy, we should only consider scenarios where VMs get benefit from the cache, specif-ically, VMs are created by using share image disk with writeback or writethrough cache mode. In this condition, the one then others policy boots faster than all at once. In case of one then others, only the first VM generates read operations to the disk, the other VMs read mandatory data from memory so that the I/O con-tention only comes from write operations (VMs write log files during boot process). On the other hand, when all VMs are booted at the same time, the I/O contention comes from read and write access of all VMs. The difference in the amount
8 Thuy Linh Nguyen, Adrien Lebre
of I/O requests between these two cases leads to the faster boot of one then others boot policy.
On SSD, the boot time of one VM is around 2.5 seconds, and it is mostly constant when we increase the number of VMs from 1 to 16, and the VM boot time is neither not impacted by different cache modes or image policies. The boot duration does not increase because the I/O throughput of the SSD is five times bigger than HDD, all I/O requests generated by VMs are not enough to stress the I/O and they are handled very quickly. The boot time of one then others is longer because we accumulate the boot time of the first VM.
On CEPH, with writeback and writethrough cache mode, we observe that there is not a big dif-ference in boot time between two image policies as on HDD. The shared image disk VMs still gain the benefit from the cache, however, the VMs with
no shared imagedisk do not directly suffer the bad
overhead of the random read as on HDD. With none cache mode, VMs with no shared disk boot much faster than VM with share image disk. There are two reasons. First, with the good I/O performance of CEPH, random read access from different VM disks in case of no shared image on CEPH is responded faster. Second, when there is no cache, we have already explained that VMs with share image disk have to load mandatory data many times. Plus, the overhead of checking where the needed data is stored to read of the shared
image mechanism becomes significant in case of
the appearance of the latency.
In brief, without co-workloads, VMs with vari-ous installations have different boot duration, and even booting multiple VMs with the same instal-lations have diverse behaviors on different storage devices. Shared image policy always have better performance on all storage devices if the cache mode of VMs is on. Although the I/O performance of writeback is the best, the data is not protected in a power failure situation and it is recommended only for temporary data where data loss is not a concern. With one then others boot policy, the boot time is good only on HDD where the random read is costly; on CEPH and SSD, with good I/O performance the all at once boot policy is slightly better.
To compare the boot time of VMs and
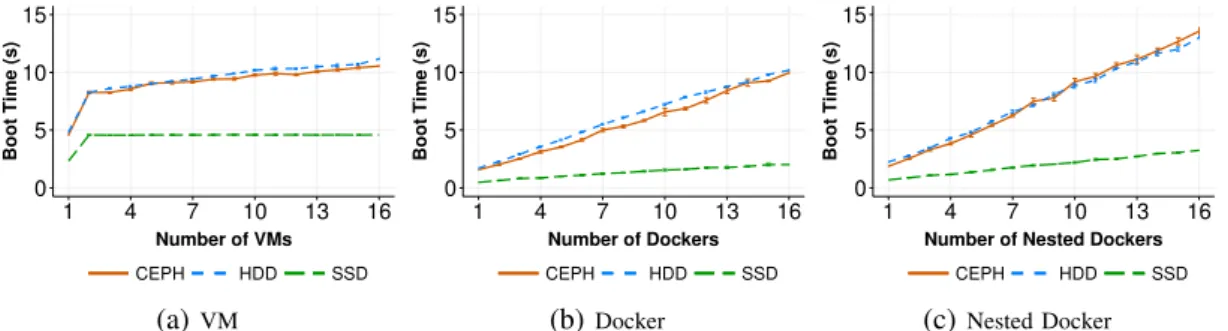
contain-ers in the next section, we illustrate in Figure 3a the boot time of VMs with writethrough cache mode, share image disk and one then others boot policy.
B. Docker Boot Time
Figure 3b depicts that the boot time of docker increases linearly along with the increasing of the number of dockers on three storage devices. The result also shows that dockers boot faster than VMs, as expected, even in case of the best configured of VMs (Figure 3a). On HDD, booting one docker in an idle node takes 1.7 seconds and 16 dockers need around 10.5 seconds. On CEPH, the boot duration is slightly better on HDD because of the higher I/O performance of CEPH. It takes around 1.5 second to 10 seconds to boot 1 to 16 dockers simultaneously. On SSD, the boot time also has the upward trend with smaller slope compared to HDD and CEPH. This is the result of having the highest I/O throughput between the 3 types of disks.
C. Nested Docker Boot Time
Boot duration of nested docker has the same trend as docker as illustrated in Figure 3c. How-ever, the nested docker boot time is a bit longer compared to docker. The nested docker is lo-cated inside a VM placed on the compute node. Therefore, the nested docker also suffers from the reduced performance of the virtualization technol-ogy.
D. Discussion
In general, booting one docker or nested docker is faster than booting a VM in an idle environment. The main reason is the number of I/O operations during their boot processes. When a VM is booted, a normal Linux boot process is in place. VM loads the kernel data from the VM disk, performs some computations, and then writes the log files to VM disk. The full Linux boot process runs inside a VM on restricted pre-assigned resources. On the contrary, when we boot a container, Docker engine initializes the file system for a container and mount the read-write layer for it. Then Docker en-gine assigns the CPU and memory of the container using resources of the compute node. Finally, the
Conducting Thousands of Experiments to Analyze VMs, Dockers and Nested Dockers Boot Time 9 0 5 10 15 1 4 7 10 13 16 Number of VMs Boot Time (s) CEPH HDD SSD (a)VM 0 5 10 15 1 4 7 10 13 16 Number of Dockers Boot Time (s) CEPH HDD SSD (b)Docker 0 5 10 15 1 4 7 10 13 16
Number of Nested Dockers
Boot Time (s)
CEPH HDD SSD
(c)Nested Docker
Fig. 3: Boot time of multiple VMs, Dockers and Nested Dockers on 3 storage devices
requested service is executed inside that container with limited resources. In brief, containers do not need to load the kernel data or go through the full Linux boot process. Plus, Docker engine prepares the environment to run a service inside a container without any restriction on the physical resources.
0 10 20 30 40 50 1 4 7 10 13 16 Number of e−machines I/O usa g e (MB)
Docker Nested Docker VM
(a)I/O read
0 40 80 120 160 1 4 7 10 13 16 Number of e−machines I/O usa g e (MB)
Docker Nested Docker VM
(b) I/O write
Fig. 4: I/O usage during boot process of multiple machines
In Figure 4, we compared the amount of I/O usage for VMs, dockers and nested dockers. The amount of I/O read shown in Figure 4a is steady for VMs and containers when the number of machines increases because they all use the shared
imagedisk strategy. In other words, all mandatory
data for their boot processes are read only once. However, VMs read much more than dockers do. Figure 4b depicts that the amount of written data of VMs and containers increase linearly. VMs also have much higher I/O writes than dockers because of the "copy-on-write" mechanism of the VM disk. When a VM writes new data to a COW image, the relevant blocks are read from the backing file, modified with the new data and written into that COW image. This mechanism leads to 2 read and 3 write operations for every single write operation on the COW image [21]. The amount of read and write data of nested docker is higher than that of
a docker because a nested docker is booted inside a VM with shared image disk so that it is suffered from the COW image mechanism.
VI. BOOTTIMEUNDERWORKLOADS
CONTENTION
This experiment focuses on understanding the boot time of a single machine in the presence of concurrent workloads. On a compute node, first, we boot n co-machines (n ∈ [0, 15]) and then run workload on them. After that, we start one e-machine. In the case where we want to generate CPU stress, all co-machines are allocated on the same physical core with the e-machine. For the other experiments where CPU contention should be avoided (i.e., when we want to stress either only the memory, network or the I/O bus), every machine has to be assigned to different cores. In this scenario, all VMs are configured with writethrough cache mode. Because we only measure the boot duration of one VM, the param-eters cache_mode and boot_policy do not have an important effect.
A. Memory Impact
As shown in Figure 5, when we increase the number of co-machines to stress the memory, the boot duration of e-machine does not change on all three storage devices. The boot time of VM is consistently slower than nested docker and docker, and nested docker boots a little bit slower than docker. In conclusion, the effect of memory competition on boot time is negligible.
On HDD (Figure 5a), the boot time of the VM that has shared image disk is 4.5 seconds while
no shared imagedisk is 4 seconds. The overhead
10 Thuy Linh Nguyen, Adrien Lebre 0 2 4 6 0 3 6 9 12 15 Number of co−machines Boot Time (s)
Docker Nested Docker VM_No−shared VM_Shared (a) HDD 0 2 4 6 0 3 6 9 12 15 Number of co−machines Boot Time (s)
Docker Nested Docker VM_No−shared VM_Shared (b) SSD 0 2 4 6 0 3 6 9 12 15 Number of co−machines Boot Time (s)
Docker Nested Docker VM_No−shared VM_Shared
(c) CEPH
Fig. 5: Boot time of 1 VM, Docker and Nested Docker on three storage devices under memory contention 0 10 20 30 40 0 3 6 9 12 15 Number of co−machines Boot Time (s)
Docker Nested Docker VM_No−shared VM_Shared (a) HDD 0 10 20 30 40 0 3 6 9 12 15 Number of co−machines Boot Time (s)
Docker Nested Docker VM_No−shared VM_Shared (b) SSD 0 10 20 30 40 0 3 6 9 12 15 Number of co−machines Boot Time (s)
Docker Nested Docker VM_No−shared VM_Shared
(c) CEPH Fig. 6: Boot time of 1 VM, Docker and Nested Docker on three storage devices under CPU
contention
of checking where is the needed data to read of
shared imagestrategy make it 0.5 seconds longer
than no shared image when booting only one VM. On CEPH (Figure 5c), we also see 1 second difference between two disk creating strategies. This gap becomes bigger on CEPH because of the latency when accessing data on a remote storage device. We also have differences between two image policies in case of CPU and network contention as discussed in the next paragraph. B. CPU Impact
Figure 6 reveals that VM boot time is impacted by CPU contention while docker and nested docker boot time are stable. For VMs, there is a clear linear correlation between the boot time of a VM and the number of co-allocated VMs, and the same increasing trend for three types of storage devices. Because all e-VM and co-VMs are assigned to one core, and the workload on each co-VM is always 100% full capacity of CPU usage, the more co-VMs running on one physical core, the more the VM has to wait until it can
access the CPU core to perform the computation for the boot process. This leads to a longer boot time when we increase the number of co-VMs. In general, it takes around 4.5 seconds to boot a VM without CPU contention and increases to 40 seconds when we have 16 co-VMs generating CPU contention.
In case of containers, under CPU stress, the boot time of both docker and nested docker are not affected on any storage devices. In this exper-iment, to generate CPU contention, we assign all
co-machines into the same physical core where
the e-machine is allocated. As explained before, during a docker boot process, when docker engine prepares the environment for a docker (i.g., mount-ing root file system, limitmount-ing resource), the engine may not run in the core that has been stressing. Only the starting process of the containers actually run under the constrained resources and affected by the CPU contention.
Conducting Thousands of Experiments to Analyze VMs, Dockers and Nested Dockers Boot Time 11 0 2 4 6 0 3 6 9 12 15 Number of co−machines Boot Time (s)
Docker Nested Docker VM_No−shared VM_Shared (a) HDD 0 2 4 6 0 3 6 9 12 15 Number of co−machines Boot Time (s)
Docker Nested Docker VM_No−shared VM_Shared (b) SSD 0 5 10 15 0 3 6 9 12 15 Number of co−machines Boot Time (s)
Docker Nested Docker VM_No−shared VM_Shared
(c) CEPH
Fig. 7: Boot time of 1 VM, Docker and Nested Docker on three storage devices under network contention 0 30 60 90 120 0 3 6 9 12 15 Number of co−machines Boot Time (s)
Docker Nested Docker VM_No−shared VM_Shared (a) HDD 0 3 6 9 12 0 3 6 9 12 15 Number of co−machines Boot Time (s)
Docker Nested Docker VM_No−shared VM_Shared (b) SSD 0 100 200 300 400 0 3 6 9 12 15 Number of co−machines Boot Time (s)
Docker Nested Docker VM_No−shared VM_Shared
(c) CEPH
Fig. 8: Boot time of 1 VM, Docker and Nested Docker on three storage devices under I/O contention
C. Network Impact
As we expected, Figure 7 reveals the network contention does not have any effect on the boot time of e-machine on local storage (HDD and SSD) and only affects the remote storage device. It is reasonable since, on the local storage, the boot process of a VM or a docker does not require network operations. On CEPH, in the case of VM (Figure 8c), the e-VM uses bandwidth to load the kernel files remotely. The boot time of a VM with CEPH is quite stable around 4.5 seconds until we have 10 stressing the 10 Gigabit Ethernet interface of the compute node. When we keep increasing the network usage by growing the number of co-VMs, the remaining network bandwidth for the e-VM is limited, therefore, the boot time rises from 4.5 seconds to around 15 seconds. However, even on remote storage device - CEPH, docker and nested docker boot time are not significantly impacted under network stress.
D. I/O Disk Impact
Figure 8 depicts the boot time of a machine on three storage devices under I/O stress. Similarly to other experiments, a docker boots faster than a VM on different storage devices under high I/O contention.
The VM boot time increases linearly with the increased number of co-VMs for both disk cre-ation strategies. Under CPU, memory and network contention, the boot time of e-VMs with no shared
imageis faster than the shared image one and this
gap is stable. However, the gap behaves differently under I/O contention. On HDD (Figure 8a), boot time of no shared image VM increases longer than the shared image one (from 4 seconds to over 120 seconds, compared to 4.5 seconds to 85 seconds, respectively), but the boot time between these two disk creating strategies is similar on SSD (Figure 8b). On CEPH, the overhead of checking data to read from shared image is again significant, this leads to the boot time of VM with shared image disk is longer.
Docker and nested docker boot time also
12 Thuy Linh Nguyen, Adrien Lebre
crease under I/O contention but they are faster than VMs on both HDD and SSD storage devices. The boot time of docker and nested docker increases when there is more stress on I/O, then becomes stable. In case of CEPH, the boot time of a docker is abnormally much longer than that of one VM. The reason for this phenomenon could be that there are high competitions in kernel system calls. However, to fully explain this, a number of intensive experiments has to be conducted.
E. Discussion
Workloads that are already executed on a com-pute node obviously increase the time to boot an additional VM/docker and this should be consid-ered. While comparing the workloads together, our results show that VM, docker and nested docker boot time introduce negligible overhead for memory and network bandwidth (except in the case of remote attached volume such as CEPH). I/O disk is the most influence factor for both VM and docker on different types of storage devices. Even though the impact of CPU is rather small as compared to I/O factor in case of VM (docker is not impacted by CPU contention), we cannot sim-ply ignore CPU factor, since it is still significant enough to alter the boot time. In general, dockers have better boot time compared to nested dockers.
VII. CONCLUSION
Performing reproducible experiments on cloud computing platforms imply complex tasks which require to evaluate a large number of configura-tions. The analysis of VMs and containers boot times is a such kind of this task. In this work, we presented how we conducted, in a software-defined manner, more than 14400 experiments.
The gathered results give us a comprehension about the VM boot time. The VM boot duration is not only affected by the co-workloads and the number of VMs simultaneously deployment but also the parameters that we use to configure VMs. Furthermore, on different storage devices, booting VMs with the same configuration even have varied behaviors. Having the comprehension of the VM boot time will allow us to choose the best way to boot new VMs within a cloud infrastructure. When comparing the boot time between containers and
VMs, it is obvious that containers boot much faster than VMs. However, the boot duration of contain-ers also has an increasing trend like the VM boot time when we boot multiple VMs/containers at the same time or under a workload contention en-vironment. Especially, I/O throughput is the most significant factor on both VMs and containers boot duration. This behavior of VMs/containers boot time should be taken into account when we want to deploy new VMs/containers.
In this paper, we also discussed the boot process of VM and docker. The initialization of dockers does not perform with restricted resources. Plus, we highlighted the difference in the amount of loaded data between VMs and dockers during their boot process. These two observations could be applied to propose improvements for VM boot time. While containers can be booted faster than a VM even under I/O intensive environment, VM boot time still plays a major role in provisioning resources on demand within a cloud infrastructure. Instead of using a full Linux boot process for a VM, mitigating the number of I/O operations is a promise direction to achieve the same effect as containers.
ACKNOWLEDGMENT
All experiments presented in this paper were carried out using the Grid’5000 testbed, sup-ported by a scientific interest group hosted by Inria and including CNRS, RENATER and sev-eral Universities as well as other organizations (see https://www.grid5000.fr). This work is also a part of the BigStorage project, H2020-MSCA-ITN-2014-642963, funded by the European Commis-sion within the Marie Skłodowska-Curie Actions framework.
REFERENCES
[1] R. Morabito, J. Kjällman, and M. Komu, “Hypervisors vs. lightweight virtualization: a performance compari-son,” in Cloud Engineering (IC2E), 2015 IEEE Interna-tional Conference on. IEEE, 2015, pp. 386–393. [2] W. Felter, A. Ferreira, R. Rajamony, and J. Rubio, “An
updated performance comparison of virtual machines and linux containers,” in Performance Analysis of Systems and Software (ISPASS), 2015 IEEE International Sym-posium On. IEEE, 2015, pp. 171–172.
[3] P. Sharma, L. Chaufournier, P. J. Shenoy, and Y. Tay, “Containers and virtual machines at scale: A comparative study.” in Middleware, 2016.
Conducting Thousands of Experiments to Analyze VMs, Dockers and Nested Dockers Boot Time 13
[4] A. Sonone, A. Soni, S. Nathan, and U. Bellur, “On exploiting page sharing in a virtualised environment-an empirical study of virtualization versus lightweight containers,” in Cloud Computing (CLOUD), 2015 IEEE 8th International Conference on. IEEE, 2015, pp. 49– 56.
[5] B. Xavier, T. Ferreto, and L. Jersak, “Time provisioning evaluation of kvm, docker and unikernels in a cloud platform,” in Cluster, Cloud and Grid Computing (CC-Grid), 2016 16th IEEE/ACM International Symposium on. IEEE, 2016, pp. 277–280.
[6] H. Wu, S. Ren, G. Garzoglio, S. Timm, G. Bernabeu, K. Chadwick, and S.-Y. Noh, “A reference model for virtual machine launching overhead,” IEEE Transactions on Cloud Computing, vol. 4, no. 3, pp. 250–264, 2016. [7] T. L. Nguyen and A. Lèbre, “Virtual machine boot
time model,” in Parallel, Distributed and Network-based Processing (PDP), 2017 25th Euromicro International Conference on. IEEE, 2017, pp. 430–437.
[8] A. Kivity, Y. Kamay, D. Laor, U. Lublin, and A. Liguori, “kvm: the linux virtual machine monitor,” in Proceedings of the Linux symposium, vol. 1, 2007, pp. 225–230. [9] D. Merkel, “Docker: lightweight linux containers for
consistent development and deployment,” Linux Journal, vol. 2014, no. 239, p. 2, 2014.
[10] J. Mambretti, J. Chen, and F. Yeh, “Next generation clouds, the chameleon cloud testbed, and software de-fined networking (sdn),” in Cloud Computing Research and Innovation (ICCCRI), 2015 International Conference on. IEEE, 2015, pp. 73–79.
[11] D. Balouek, A. Carpen Amarie, G. Charrier, F. De-sprez, E. Jeannot, E. Jeanvoine, A. Lèbre, D. Margery, N. Niclausse, L. Nussbaum, O. Richard, C. Pérez, F. Quesnel, C. Rohr, and L. Sarzyniec, “Adding virtu-alization capabilities to the Grid’5000 testbed,” in Cloud Computing and Services Science, ser. Communications in Computer and Information Science, I. Ivanov, M. Sin-deren, F. Leymann, and T. Shan, Eds. Springer Interna-tional Publishing, 2013, vol. 367, pp. 3–20.
[12] M. e. a. Imbert, “Using the execo toolbox to perform automatic and reproducible cloud experiments,” in 1st International Workshop on UsiNg and building ClOud Testbeds (UNICO, collocated with IEEE CloudCom, 2013.
[13] N. Capit, G. Da Costa, Y. Georgiou, G. Huard, C. Martin, G. Mounié, P. Neyron, and O. Richard, “A batch sched-uler with high level components,” in Cluster Computing and the Grid, 2005. CCGrid 2005. IEEE International Symposium on, vol. 2. IEEE, 2005, pp. 776–783. [14] E. Jeanvoine, L. Sarzyniec, and L. Nussbaum,
“Kade-ploy3: Efficient and scalable operating system provision-ing for clusters,” USENIX; login:, vol. 38, no. 1, pp. 38– 44, 2013.
[15] B. Claudel, G. Huard, and O. Richard, “Taktuk, adaptive deployment of remote executions,” in Proceedings of the 18th ACM international symposium on High performance distributed computing. ACM, 2009, pp. 91–100. [16] R. Russell, “virtio: towards a de-facto standard for virtual
i/o devices,” ACM SIGOPS Operating Systems Review, vol. 42, no. 5, pp. 95–103, 2008.
[17] “Description of cache modes,” https://www.suse.com/ documentation/sles11/book_kvm/data/sect1_1_chapter_ book_kvm.html.
[18] K. Razavi and T. Kielmann, “Scalable virtual machine deployment using vm image caches,” in Proceedings
of the International Conference on High Performance Computing, Networking, Storage and Analysis. ACM, 2013, p. 65.
[19] Z. Zhang, D. Li, and K. Wu, “Large-scale virtual machines provisioning in clouds: challenges and ap-proaches,” Frontiers of Computer Science, vol. 10, no. 1, pp. 2–18, 2016.
[20] B. Nicolae, F. Cappello, and G. Antoniu, “Optimizing multi-deployment on clouds by means of self-adaptive prefetching,” in European Conference on Parallel Pro-cessing. Springer, 2011, pp. 503–513.
[21] A. Garcia, “Improving the performance of the qcow2 format,” 2017. [Online]. Avail-able: https://events.static.linuxfound.org/sites/events/ files/slides/kvm-forum-2017-slides.pdf
RESEARCH CENTRE
RENNES – BRETAGNE ATLANTIQUE
Campus universitaire de Beaulieu 35042 Rennes Cedex
Publisher Inria
Domaine de Voluceau - Rocquencourt BP 105 - 78153 Le Chesnay Cedex inria.fr