HAL Id: hal-03163183
https://hal.sorbonne-universite.fr/hal-03163183
Submitted on 9 Mar 2021
HAL is a multi-disciplinary open access
archive for the deposit and dissemination of
sci-entific research documents, whether they are
pub-lished or not. The documents may come from
teaching and research institutions in France or
abroad, or from public or private research centers.
L’archive ouverte pluridisciplinaire HAL, est
destinée au dépôt et à la diffusion de documents
scientifiques de niveau recherche, publiés ou non,
émanant des établissements d’enseignement et de
recherche français ou étrangers, des laboratoires
publics ou privés.
Christine Keenan, Michael Mlodzianoski, Hannah Coughlan, Naiara Bediaga,
Gaetano Naselli, Erin Lucas, Qike Wang, Carolyn de Graaf, Douglas Hilton,
Leonard Harrison, et al.
To cite this version:
Christine Keenan, Michael Mlodzianoski, Hannah Coughlan, Naiara Bediaga, Gaetano Naselli, et
al.. Chromosomes distribute randomly to, but not within, human neutrophil nuclear lobes. iScience,
Elsevier, 2021, 24 (3), pp.102161. �10.1016/j.isci.2021.102161�. �hal-03163183�
Article
Chromosomes distribute randomly to, but not
within, human neutrophil nuclear lobes
Christine R.
Keenan, Michael J.
Mlodzianoski,
Hannah D.
Coughlan, ...,
Thomas Boudier,
Rhys S. Allan,
Timothy M.
Johanson
[email protected] HIGHLIGHTS Human chromosomes randomly distribute to neutrophil nuclear lobesHowever, they sustain a non-random radial distribution within these lobes
Chromosome length correlates with volume in neutrophils and other human immune cells
Gene-regulatory transchromosomal interactions are unlikely in human neutrophils
Keenan et al., iScience24, 102161 March 19, 2021ª 2021 The Author(s). https://doi.org/10.1016/ j.isci.2021.102161
OPEN ACCESS
Article
Chromosomes distribute randomly
to, but not within, human
neutrophil nuclear lobes
Christine R. Keenan,
1,2,5Michael J. Mlodzianoski,
1,2,5Hannah D. Coughlan,
1,2Naiara G. Bediaga,
1,2Gaetano Naselli,
1,2Erin C. Lucas,
1,2Qike Wang,
1,2Carolyn A. de Graaf,
1,2Douglas J. Hilton,
1,2Leonard C. Harrison,
1,2Gordon K. Smyth,
1,3Kelly L. Rogers,
1,2Thomas Boudier,
1,2,4Rhys S. Allan,
1,2,6and Timothy M. Johanson
1,2,6,7,*
SUMMARY
The proximity pattern and radial distribution of chromosome territories within
spherical nuclei are random and non-random, respectively. Whether this
distribu-tion pattern is conserved in the partidistribu-tioned or lobed nuclei of polymorphonuclear
cells is unclear. Here we use chromosome paint technology to examine the
chro-mosome territories of all 46 chrochro-mosomes in hundreds of single human
neutro-phils – an abundant and famously polymorphonuclear immune cell. By comparing
the distribution of chromosomes to randomly shuffled controls and validating
with orthogonal chromosome conformation capture technology, we show for
the first time that human chromosomes randomly distribute to neutrophil nuclear
lobes, while maintaining a non-random radial distribution within these lobes.
Furthermore, we demonstrate that chromosome length correlates with
three-dimensional volume not only in neutrophils but other human immune cells. This
work demonstrates that chromosomes are largely passive passengers during
the neutrophil lobing process but are able to subsequently maintain their
macro-level organization within lobes.
INTRODUCTION
First proposed in 1885 (Rabl, 1885) and with vacillating levels of acceptance until recent decades, inter-phase chromosomes maintaining a territorial organization is now a widely accepted principle of nuclear or-ganization in most eukaryotes (Cremer and Cremer, 2010). This is unsurprising, given the importance of this organization to functions as fundamental as gene expression and DNA repair. For example, the radial po-sition of a chromosome within the nucleus is strongly correlated with its transcriptional activity and gene density (Cremer and Cremer, 2010). Furthermore, the proximity of chromosomes to one another (both ho-mologous and non-hoho-mologous) is thought to be important during DNA repair (Agmon et al., 2013) and potentially even in direct gene regulation (Hewitt et al., 2008;Kim et al., 2014;Ling et al., 2006;Spilianakis et al., 2005;Zhao et al., 2006).
While the radial distribution of chromosomes is well understood to be non-random (Cremer and Cremer, 2010), the position of chromosomes relative to each other, or proximity pattern, is contentious, with reports of both non-random (Brianna Caddle et al., 2007; Parada et al., 2002, 2004; Roix et al., 2003; Khalil et al., 2007) and random distributions (Bolzer et al., 2005). In the absence of being able to observe interphase chromosome movements in live cells over long periods of time, combined with the absence of physical barriers to restrict chromosome movement, it is possible that these studies simply differ in their detection of transient or infrequent interphase chromosomal interactions or movements.
Human neutrophils constitute approximately two-thirds of the immune cells in human blood. They are readily identifiable by their polymorphonuclear nature with their nuclei being segmented into 2–6 lobes joined only by thin filaments of nucleoplasm (P Ehrlich, 1900). Here we exploit this natural nuclear segmen-tation to examine the importance of interphase chromosome distribution. We hypothesize that if
1The Walter and Eliza Hall
Institute of Medical Research, Parkville, VIC, 3052, Australia
2Department of Medical
Biology, The University of Melbourne, Parkville, VIC, 3010, Australia
3School of Mathematics and
Statistics, The University of Melbourne, Parkville, VIC, 3010, Australia
4Institute of Biology
Paris-Seine, Sorbonne Universite´, Paris, France
5These authors contributed
equally
6These authors contributed
equally 7Lead contact *Correspondence: [email protected] https://doi.org/10.1016/j.isci. 2021.102161
interactions between chromosomes are biologically important these chromosomes would preferentially locate together into neutrophil nuclear lobes, enabling continuing interaction.
Using chromosome paint technology alongside high-throughput image analysis pipelines, we have exam-ined all 46 human chromosomes in 240 single neutrophil nuclei. We reveal that while the radial distribution of chromosomes within neutrophil nuclear lobes is non-random, the distribution of chromosomes to lobes is random.
RESULTS
Analysis pipeline detects the position and characteristics of all human chromosomes in three-dimensions.
Given the complexity of examining all 46 human chromosomes in hundreds of single, segmented neutro-phil nuclei, we developed a bespoke image analysis pipeline to detect the position and three-dimensional characteristics of all chromosomes in images generated using chromosome paint.
In brief, each of the 22 autosome pairs and the X and Y chromosomes within fixed healthy male human blood neutrophil nuclei (Figure S1A) is ‘‘painted’’ with a specific combination of fluorescent probes within the chromosome paint mix (Figures 1A and 1B andSupplemental information). The whole nucleus is then imaged and analyzed using our analysis pipeline (Figure 1C). First, the intensity of each of the five channels in each individual image is normalized. A malleable grid with lines that flex to incorporate nearby voxels of similar channel intensity patterns is then applied to each image. This flexibility allows the grid to capture the highly variable three-dimensional shapes formed by chromosomes. Adjacent cubes of the grid that share channel intensities are then combined to create ‘‘objects’’. Based upon the expected spectral combina-tions for each chromosome (Figure 1B), these objects are then assigned as chromosomes (Figure S1B andVideos S1,S2, andS3). This analysis pipeline was initially validated using human metaphase chromo-some spreads where it reliably called whole, individual chromochromo-somes (e.g. >95% of objects were called with a single chromosome identity) (Figure S1C). To avoid the common pitfall of arbitrary thresholding to define genuine signal from background (Cremer and Cremer, 2010), every image was assigned an indi-vidually determined threshold. This threshold is calculated by automated sequential testing of various thresholds to determine the value which maximizes the number of objects with genuine chromosome chan-nel combinations, while minimizing spectrally spurious objects (e.g. detected objects that have a chanchan-nel combination differing from the 24 specific chromosome combinations) (Figure S2).
Importantly, chromosome paint and our image analysis pipeline detects the majority of the 22 human au-tosomes and the sex chromosomes at approximately the expected proportions (Figures 1D andS3A). While some chromosomes appear more difficult to define or detect (e.g. chromosome 13, 15, 21, and 22), the proportions of chromosomes detected are similar across human immune cell types (CD4+and CD8+T cells) (Figures S3B and S3C), suggesting that the variation in detection frequency observed is tech-nical, not biological.
We next examine the three-dimensional character of all 46 chromosomes, including volume (Figure 1E) and surface area (Figure 1F), among others (Figures S3D and S3E). While the physical characteristics of the chro-mosome territories varies greatly across neutrophil nuclei, the volume and surface area of the Y chromo-somes are, as expected, consistently and significantly (P = 0.02 and P = 0.04, respectively) smaller than the X chromosome (Figures 1E and 1F).
While the differences in the three-dimensional character of the chromosomes are subtle, the ability to examine all chromosomes (as opposed to between 2 and 7 chromosomes (Aquiles Sanchez et al., 1997;
Hubner et al., 2015;Yerle-Bouissou et al., 2009)) in large numbers of cells affords power. For example, pre-vious studies suggest minimal relationship between chromosome linear length and three-dimensional vol-ume (Aquiles Sanchez et al., 1997;Yerle-Bouissou et al., 2009), however, our analysis suggests a significant linear relationship between the two (r2= 0.359, p = 0.001), not only in neutrophils (Figure 1G) but also in other human immune cells (Figures S3F and S3G).
Thus, despite chromosome paint data containing variance in both chromosome detection and three-dimensional parameters, and the fact that fixation partly alters the morphology of nuclei (Hepperger
et al., 2007), the scale of our data set allows elucidation of biologically important correlations and phenomena.
Human neutrophil chromosomes distribute randomly to nuclear lobes
There is conflicting evidence as to whether the proximity pattern of chromosomes is random or non-random, even within polymorphonuclear nuclei (Yerle-Bouissou et al., 2009;Hepperger et al., 2009;Karni et al., 2001;Aquiles Sanchez et al., 1997;Bartova et al., 2001).
In order to examine the distribution of chromosomes to neutrophil nuclear lobes, we first developed a high throughput pipeline to define the lobes. In brief, the pipeline uses watershed analysis from manually as-signed seeds within each lobe (Figure S4A) to rapidly define nuclear lobes (Figure S4B). Consistent with Figure 1. Analysis pipeline detects the position and characteristics of all human chromosomes in three-dimensions
(A–C) Schematic of neutrophil isolation, chromosome paint (A), spectral character of each human chromosome (B), and image analysis pipeline (C). (D) Proportion of total chromosomes detected made up by each chromosome in human blood neutrophils. Red line represents expected proportion if all 24 chromosomes were detected equally (0.04 for autosomes, 0.02 for sex chromosomes).
(E and F) Box and whisker plot (fifth-95thpercentile) of the volume (mm3) (E) and surface area (mm2) (F) of each chromosome
across all 240 neutrophils. Unpaired T test used to compare X and Y chromosomes.
(G) Plot of median chromosome volume across all neutrophils against chromosome linear length with straight line fitted (y = 1.09e-3x+0.649, R2= 0.359 and P = 0.001). Dark and light gray points indicate chromosome was called as less than 0.03
previous studies (Karni et al., 2001), we find that the majority of healthy human blood neutrophils have be-tween 3 and 4 lobes (Figure S4C) of approximately equal volumes (Figure S4D).
Next, we performed a lobe colocalization analysis to examine the frequency with which each chromosome is located within a neutrophil lobe with any other (Figure 2A). We find significant non-random distribution of 44 pairs of chromosomes (Table S1). However, this analysis does not consider the character of the chromo-somes. For example, a larger chromosome would likely have less lobe partners due simply to occupying more lobe volume. Thus, to avoid the confounding impacts of chromosome character, we repeated our co-localization analysis on randomly shuffled controls (Figure 2B). To generate these shuffled images, we created an imaging framework that randomly places every chromosome (with its individual three-dimen-sional character and that of the associated nucleus preserved) within the nuclear space of each individual image. Chromosomes were not permitted to overlap one another or the nuclear boundary. This shuffling was performed five independent times for each of the 240 biological images. The colocalization frequency was then examined in each set of shuffled images to determine the variability of shuffling, but more impor-tantly the impact of chromosome character on lobe sharing frequency. The analysis revealed significant lobe sharing in the randomly shuffled images, suggesting that chromosome character does impact lobe distribution.
To overcome the influence of chromosome character on lobe distribution, we filtered our significant lobe partner pairs (Table S1) by significance of co-lobe localization greater than that observed in the randomly shuffled analysis. Eleven chromosome pairings surpassed this threshold (Table S2), suggesting that these chromosomes may preferentially co-localize in neutrophil nuclear lobes. However, the pairs in question share very similar spectral combinations, suggesting that perhaps the significance observed is an artifact of miscalling. For example, if one region of chromosome 1 (painted Cy5) was occasionally miscalled as chromosome 6 (painted Cy5 and FITC) or vice versa this could lead to a significant colocalization score. To validate our chromosome paint findings, we performed an orthogonal analysis of chromosome prox-imity using in situ HiC (Rao et al., 2014). In situ HiC utilizes proximity ligation to determine the three-dimen-sional association of regions of DNA in populations of fixed nuclei (Figure 2C andSupplemental informa-tion). While in most cells the vast majority of ligation events occur within chromosomes, transchromosomal interactions can be used as a measure of chromosome-chromosome proximity (Rao et al., 2014). Perform-ing in situ HiC on human neutrophils, we find that they exhibit dramatically more transchromosomal inter-action than human immune cell types with spherical nuclei (Figure 2D). This is likely due to the increased physical confinement within neutrophil nuclei (Zhu et al., 2017). If, as hinted at by chromosome paint, partic-ular chromosomes are more frequently co-localized to neutrophil nuclear lobes than expected by chance, we would expect to observe an enrichment of transchromosomal interactions between these chromo-somes compared to other chromosome pairs. However, we find that the distribution of transchromosomal interactions in human blood neutrophils is predominantly dependent on chromosome length (r2= 0.968,
Figure 2E) with no notable increase in interaction observed between any of the chromosome pairs sug-gested to co-localize by chromosome paint (Figure 2F).
Thus, using two independent methods, and by comparing to randomly shuffled controls, we find no consis-tent evidence of non-random chromosome distribution to human neutrophil nuclear lobes.
Figure 2. Human neutrophil chromosomes distribute randomly to nuclear lobes
(A and B) (A) Heatmap of the -log10(p value) from chromosome lobe colocalization analysis in human blood neutrophil
nuclear lobes. The analysis determined if pairs of chromosomes are found colocalized within a lobe at a higher rate than expected by chance (B) Top: dimensional render of chromosomes within a human neutrophil nucleus. Left: Three-dimensional renders of the same neutrophil and chromosomes after five sets of random chromosome shuffling. Right: Heatmap of the -log10(p value) from the chromosome colocalization analysis of five independent sets of random
chromosome shuffling.
(C and D) (C) Schematic of the proximity ligation reaction central to the in situ HiC protocol, (D) Proportion of total DNA-DNA interactions detected by in situ HiC and the diffHiC pipeline that occur between chromosomes (transchromosomal interactions) in human immune cells.
(E) Frequency of transchromosomal interactions to the power of 0.25, plotted as a function of summed chromosome length in human neutrophils. Straight line fitted to data with no intercept (y = 8.621e-3x, R2= 0.9683 and p value <2.23
10 16).
Human neutrophil chromosomes do not position randomly within nuclear lobes
Consistent with findings in spherical nuclei (Bolzer et al., 2005), our distribution analysis finds that the proximity pattern of chromosomes within neutrophil nuclei is random. Alongside random proximity pattern, non-random radial chromosome distribution is also well documented. As such, larger chromo-somes are consistently observed closer to the nuclear periphery than their more diminutive counterparts (Bolzer et al., 2005). This has even been observed in a handful of neutrophil chromosomes (Hubner et al., 2015).
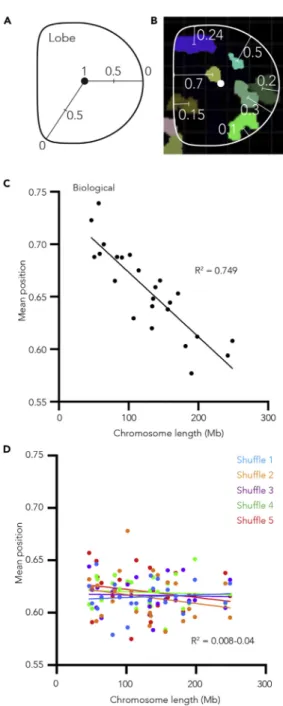
To determine whether all human neutrophil chromosomes exhibit this relationship with the nuclear pe-riphery, we examined the position of chromosomes relative to the lobed nuclear membrane. To do so, we first break the radius of each lobe into a continuous scale from 0 to 1, 1 being the three-dimensional center of the lobe and 0 being the nuclear periphery (Figure 3A). We then give each chromosome within the lobe a value between 0 and 1 based upon the mean position of its total volume (Figure 3B). By applying this method to all chromosomes in all lobes, we are able to determine the position of each chromosome relative to the lobe boundary. As such, we find a significant relationship between chromo-some linear length and its relative position within a lobe (r2= 0.749, p = 4.603 10 8), with larger chro-mosomes more likely to be found nearer the nuclear periphery than shorter chrochro-mosomes (Figure 3C). Importantly, when we apply this same method to our randomly shuffled control images the association is no longer detected (Figure 3D), strongly suggesting that it is not simply the volume of the larger chro-mosomes underlying the relationship. Similarly, when we examined the relationship between chromo-some gene-density (genes/Mb) and radial position, we find gene dense chromochromo-somes trend toward be-ing positioned near the lobe center more than gene-poor chromosomes (Figure S4E), consistent with previous works (Bolzer et al., 2005).
Thus, as in spherical nuclei, chromosomes within the highly physically restricted neutrophil nuclear lobes are positioned in a non-random size- and gene density-influenced manner.
DISCUSSION
Human blood neutrophils have been identified for over a hundred years by their numerous nuclear lobes separated by fantastically thin filaments of nucleoplasm (P Ehrlich, 1900). Unfortunately for studies such as ours, fixation can lead to significant changes to this morphology, particularly the clustering of nuclear lobes. While these fixation-dependent changes can cause problems (Hepperger et al., 2007), here, while it made lobe identification more challenging, the observation of previously reported non-random radial distribution of chromosomes within lobes suggests that fixation did not significantly alter neutrophil chro-mosome territorial organization.
The similarities in chromosome position between lobed neutrophil nuclei and spherical nuclei suggest that neutrophil chromosomes simply move and adapt to the more restricted nuclear environment created by lamin-mediated constriction (Skinner and Johnson, 2017). Thus, it appears that most chromosomes are sim-ply passengers in the lobing process. However, there is one chromosome that appears to influence nuclear morphology – the inactive X chromosome. As such, the inactive X chromosome is frequently located within a small appendage protruding from the terminal lobe of female neutrophil nuclei (Aquiles Sanchez et al., 1997;Hoffmann et al., 2007;Karni et al., 2001). Strong evidence that the inactive X chromosome influences the formation of these appendages comes from the neutrophils of XXX or XXXX individuals which frequently exhibit two or three appendages, respectively (Aquiles Sanchez et al., 1997). How the inactive X chromosome itself, its epigenetic state or its associated factors drive the formation of the nuclear ap-pendages is unclear. However, these unique apap-pendages do suggest that chromosomes are not always simply passive during nuclear morphology changes, but can under certain circumstances influence the process.
Compared to their precursors and other immune cells, mature neutrophils are transcriptionally muted ( Ge-melli et al., 2006;Hubner et al., 2015;Newburger et al., 2000). It is unclear why. Prior to our study, one pos-sibility was that neutrophil lobing perturbed the macroscale organization of chromosomes, and thus their transcriptional activity. However, consistent with examinations of fewer (between 4 and 7) chromosomes (Aquiles Sanchez et al., 1997;Hubner et al., 2015), we find that chromosome territories remain highly orga-nized within neutrophil nuclear lobes. Thus, overt chromosomal disorganization does not appear to explain the relative transcriptional inactivity of neutrophils.
Figure 3. Human neutrophil chromosomes do not position randomly within nuclear lobes
(A) Schematic showing how radial position values within a neutrophil nuclear lobe are calculated.
(B) A slice through a neutrophil nuclear lobe image showing the approximate radial position values of the chromosomes. For clarity most chromosomes are not shown.
(C) Scatterplot of the median of the mean chromosome volume radial position within human neutrophil nuclear lobes plotted as a function of chromosome length (Mb). Straight line fitted to data (y = 6.18e-4x+0.735, R2= 0.7498 and p value
4.63 10 8).
(D) Scatterplot of the median of the mean chromosome volume radial position from five independent sets of random chromosome position shufflings plotted as a function of chromosome length (Mb). Straight line fitted to each instance independently (y = 2.38e-5x+0.612, R2= 0.008 and p value = not significant (ns), y = 8.47e-5x+0.612, R2= 0.0473 and p
value ns, y = 1.24e-5x+0.618, R2= 0.0023 and p value ns, y = 2.12e-5x+0.622, R2= 0.0066 and p value ns, y =
It has been previously reported that regions on one chromosome can influence the expression of a gene on another, presumably via three-dimensional physical proximity (Williams et al., 2010). These interactions are known as gene regulatory transchromosomal interactions (Kioussis, 2005). Interestingly, these interactions have been predominantly reported in immune cells (Hewitt et al., 2008;Johanson et al., 2019;Kim et al., 2014;Ling et al., 2006;Spilianakis et al., 2005;Zhao et al., 2006). However, both their function and indeed existence is debated (Johanson et al., 2018). Here, while we reveal relatively large numbers of transchromo-somal interactions in neutrophil nuclei via in situ HiC, our data suggest little to no preferential distribution of chromosomes to neutrophil nuclear lobes (where chromosomes are physically constrained and could physically interact only with their lobe mates), which suggests that gene regulatory transchromosomal in-teractions are unlikely to occur in mature human neutrophils.
The non-random radial distribution of chromosomes we have detected in neutrophil nuclear lobes is com-mon in other cell types (Bolzer et al., 2005) and species (Tanabe et al., 2002). However, the cause and possible purpose of this organization is not known. It has been proposed that the organization could be due to the differential timing of centromere separation (Gerlich et al., 2003) or chromosome position during mitosis (Bolzer et al., 2005), differential interaction between chromosomes and the nuclear periphery and/ or other nuclear bodies (Cremer and Cremer, 2001) or simply the force of transcription from highly tran-scribed chromosomes acting on those lowly trantran-scribed (Yin et al., 1995). A number of purposes for the radial organization have also been proposed, from protecting the genome from viruses and mutagens us-ing a layer of highly repetitive and heterochromatic DNA (Hsu, 1975) to providing nuclear stability or rigidity (Bolzer et al., 2005;Nava et al., 2020;Keenan et al., 2020). Given our findings in the highly malleable phil nuclei the latter seems unlikely. While the function of peripheral heterochromatin is unclear in neutro-phils or other cell types, there is one cell type in which the radial position of heterochromatin has a clear function. As the retinal cells of nocturnal animals develop, they invert the vast majority of their heterochro-matin from its peripheral position to a central core (Solovei et al., 2009). This remarkable transformation endows the mature retinal cell enhanced light channeling characteristics thus enhancing low light vision. While many questions remain, here, by leveraging the power provided by our vast data set, we resolve a number of long-standing questions in the field of chromosome organization. We demonstrate in numerous immune cell types that chromosome length has a linear relationship with chromosome volume. Moreover, in human neutrophils we show that chromosome lobe distribution is random, while chromosome radial po-sition within lobes is non-random, expanding our knowledge of this remarkably abundant, but poorly un-derstood immune cell.
Limitations of the study
As shown and discussed above, fixation of the human blood neutrophil nuclei leads to changes in their lobed morphology. While this does not appear to prohibit meaningful insight, it should be considered when interpreting the results presented.
Resource availability Lead contact
Further information and requests for resources and data should be directed to the lead contact, Timothy Johanson ([email protected]), The Walter and Eliza Hall Institute of Medical Research, Parkville, VIC, 3052, Australia.
Materials availability
This study did not generate new unique reagents.
Data and code availability
Sequence data that support the findings of this study are tabulated in the supplementary tables and are available in the GEO database under accession number GSE157229.
METHODS
SUPPLEMENTAL INFORMATION
Supplemental information can be found online athttps://doi.org/10.1016/j.isci.2021.102161.
ACKNOWLEDGMENTS
The authors thank S. Johanson for constructive discussions, and the volunteers at the Walter and Eliza Hall Volunteer Blood Donor Registry. This work was supported by grants and fellowships from the National Health and Medical Research Council of Australia (T.M.J. #1124081, R.S.A. and T.M.J. #1049307, #1100451, G.K.S. #1058892, R.S.A. and G.K.S. #1158531, C.R.K. #1125436, D.J.H #1113577, L.C.H. #1080887 and #1037321). H.D.C. was supported by an H.C. Marian and E.H. Flack Fellowship. This study was made possible through Victorian State Government Operational Infrastructure Support and Australian Government NHMRC Independent Research Institute Infrastructure Support scheme. The funders had no role in study design, data collection and analysis, decision to publish, or preparation of the manuscript.
AUTHOR CONTRIBUTIONS
C.R.K, M.J.M, N.G.B, G.N, E.C.L, Q.W, C.A.d.G., and T.M.J. designed and conducted experiments; H.D.C. and G.K.S. designed and performed computational analyses; M.J.M., K.L.R., and T.B. designed and executed image analyses; D.J.H., L.C.H., R.S.A., and T.M.J. conceived the study and wrote the manuscript.
DECLARATION OF INTERESTS
The authors declare no competing interests.
Received: October 12, 2020 Revised: November 24, 2020 Accepted: February 3, 2021 Published: March 19, 2021
REFERENCES
Agmon, N., Liefshitz, B., Zimmer, C., Fabre, E., and Kupiec, M. (2013). Effect of nuclear architecture on the efficiency of double-strand break repair. Nat. Cell Biol. 15, 694–699. Aquiles Sanchez, J., Karni, R.J., and Wangh, L.J. (1997). Fluorescent in situ hybridization (FISH) analysis of the relationship between chromosome location and nuclear morphology in human neutrophils. Chromosoma 106, 168–177. Bartova, E., Kozubek, S., Jirsova, P., Kozubek, M., Lukasova, E., Skalnikova, M., Cafourkova, A., Koutna, I., and Pasekova, R. (2001). Higher-order chromatin structure of human granulocytes. Chromosoma 110, 360–370.
Bolzer, A., Kreth, G., Solovei, I., Koehler, D., Saracoglu, K., Fauth, C., Muller, S., Eils, R., Cremer, C., Speicher, M.R., and Cremer, T. (2005). Three-dimensional maps of all chromosomes in human male fibroblast nuclei and prometaphase rosettes. PLoS Biol. 3, e157.
Brianna Caddle, L., Grant, J.L., Szatkiewicz, J., Van Hase, J., Shirley, B.J., Bewersdorf, J., Cremer, C., Arneodo, A., Khalil, A., and Mills, K.D. (2007). Chromosome neighborhood composition determines translocation outcomes after exposure to high-dose radiation in primary cells. Chromosome Res. 15, 1061–1073.
Cremer, T., and Cremer, C. (2001). Chromosome territories, nuclear architecture and gene regulation in mammalian cells. Nat. Rev. Genet. 2, 292–301.
Cremer, T., and Cremer, M. (2010). Chromosome territories. Cold Spring Harb. Perspect. Biol. 2, a003889.
Gemelli, C., Montanari, M., Tenedini, E., Zanocco Marani, T., Vignudelli, T., Siena, M., Zini, R., Salati, S., Tagliafico, E., Manfredini, R., et al. (2006). Virally mediated MafB transduction induces the monocyte commitment of human CD34+ hematopoietic stem/progenitor cells. Cell Death Differ. 13, 1686–1696.
Gerlich, D., Beaudouin, J., Kalbfuss, B., Daigle, N., Eils, R., and Ellenberg, J. (2003). Global chromosome positions are transmitted through mitosis in mammalian cells. Cell 112, 751–764. Hepperger, C., Mayer, A., Merz, J., Vanderwall, D.K., and Dietzel, S. (2009). Parental genomes mix in mule and human cell nuclei. Chromosoma 118, 335–347.
Hepperger, C., Otten, S., Von Hase, J., and Dietzel, S. (2007). Preservation of large-scale chromatin structure in FISH experiments. Chromosoma 116, 117–133.
Hewitt, S.L., Farmer, D., Marszalek, K., Cadera, E., Liang, H.E., Xu, Y., Schlissel, M.S., and Skok, J.A. (2008). Association between the Igk and Igh immunoglobulin loci mediated by the 3’ Igk enhancer induces ’decontraction’ of the Igh locus in pre-B cells. Nat. Immunol. 9, 396–404. Hoffmann, K., Sperling, K., Olins, A.L., and Olins, D.E. (2007). The granulocyte nucleus and lamin B receptor: avoiding the ovoid. Chromosoma 116, 227–235.
Hsu, T.C. (1975). A possible function of constitutive heterochromatin: the bodyguard hypothesis. Genetics 79, 137–150.
Hubner, B., Lomiento, M., Mammoli, F., Illner, D., Markaki, Y., Ferrari, S., Cremer, M., and Cremer, T. (2015). Remodeling of nuclear landscapes during human myelopoietic cell differentiation maintains co-aligned active and inactive nuclear compartments. Epigenetics Chromatin 8, 47. Johanson, T.M., Chan, W.F., Keenan, C.R., and Allan, R.S. (2019). Genome organization in immune cells: unique challenges. Nat. Rev. Immunol. 19, 448–456.
Johanson, T.M., Coughlan, H.D., Lun, A.T.L., Bediaga, N.G., Naselli, G., Garnham, A.L., Harrison, L.C., Smyth, G.K., and Allan, R.S. (2018). Genome-wide analysis reveals no evidence of trans chromosomal regulation of mammalian immune development. PLoS Genet. 14, e1007431.
Karni, R.J., Wangh, L.J., and Sanchez, J.A. (2001). Nonrandom location and orientation of the inactive X chromosome in human neutrophil nuclei. Chromosoma 110, 267–274. Keenan, C.R., Coughlan, H.D., Iannarella, N., Johanson, T.M., Chan, W.F., Garnham, A.L., Smyth, G.K., and Allan, R.S. (2020). Suv39h-catalysed H3K9me3 is critical for euchromatic genome organisation and the maintenance of gene transcription. bioRxiv.
Khalil, A., Grant, J.L., Caddle, L.B., Atzema, E., Mills, K.D., and Arneodo, A. (2007). Chromosome
territories have a highly nonspherical morphology and nonrandom positioning. Chromosome Res. 15, 899–916.
Kim, L.K., Esplugues, E., Zorca, C.E., Parisi, F., Kluger, Y., Kim, T.H., Galjart, N.J., and Flavell, R.A. (2014). Oct-1 regulates IL-17 expression by directing interchromosomal associations in conjunction with CTCF in T cells. Mol. Cell 54, 56–66.
Kioussis, D. (2005). Gene regulation: kissing chromosomes. Nature 435, 579–580.
Ling, J.Q., Li, T., Hu, J.F., Vu, T.H., Chen, H.L., Qiu, X.W., Cherry, A.M., and Hoffman, A.R. (2006). CTCF mediates interchromosomal colocalization between Igf2/H19 and Wsb1/Nf1. Science 312, 269–272.
Nava, M.M., Miroshnikova, Y.A., Biggs, L.C., Whitefield, D.B., Metge, F., Boucas, J., Vihinen, H., Jokitalo, E., Li, X., Garcia Arcos, J.M., et al. (2020). Heterochromatin-driven nuclear softening protects the genome against mechanical stress-induced damage. Cell 181, 800–817 e22. Newburger, P.E., Subrahmanyam, Y.V., and Weissman, S.M. (2000). Global analysis of neutrophil gene expression. Curr. Opin. Hematol. 7, 16–20.
P Ehrlich, A.L. (1900). Die Anæmie, Nothnagel’s Specielle Pathologie und Therapie, Alfred Ho¨der, Wien u. Leipzig.
Parada, L.A., Mcqueen, P.G., and Misteli, T. (2004). Tissue-specific spatial organization of genomes. Genome Biol. 5, R44.
Parada, L.A., Mcqueen, P.G., Munson, P.J., and Misteli, T. (2002). Conservation of relative chromosome positioning in normal and cancer cells. Curr. Biol. 12, 1692–1697.
Rabl, C. (1885). Uber zelltheilung. Morphol. Jahrb. 10, 214–330.
Rao, S.S., Huntley, M.H., Durand, N.C., Stamenova, E.K., Bochkov, I.D., Robinson, J.T., Sanborn, A.L., Machol, I., Omer, A.D., Lander, E.S., and Aiden, E.L. (2014). A 3D map of the human genome at kilobase resolution reveals principles of chromatin looping. Cell 159, 1665– 1680.
Roix, J.J., Mcqueen, P.G., Munson, P.J., Parada, L.A., and Misteli, T. (2003). Spatial proximity of translocation-prone gene loci in human lymphomas. Nat. Genet. 34, 287–291. Skinner, B.M., and Johnson, E.E. (2017). Nuclear morphologies: their diversity and functional relevance. Chromosoma 126, 195–212. Solovei, I., Kreysing, M., Lanctot, C., Kosem, S., Peichl, L., Cremer, T., Guck, J., and Joffe, B. (2009). Nuclear architecture of rod photoreceptor cells adapts to vision in mammalian evolution. Cell 137, 356–368.
Spilianakis, C.G., Lalioti, M.D., Town, T., Lee, G.R., and Flavell, R.A. (2005). Interchromosomal
associations between alternatively expressed loci. Nature 435, 637–645.
Tanabe, H., Muller, S., Neusser, M., Von Hase, J., Calcagno, E., Cremer, M., Solovei, I., Cremer, C., and Cremer, T. (2002). Evolutionary conservation of chromosome territory arrangements in cell nuclei from higher primates. Proc. Natl. Acad. Sci. U S A 99, 4424–4429.
Williams, A., Spilianakis, C.G., and Flavell, R.A. (2010). Interchromosomal association and gene regulation in trans. Trends Genet. 26, 188–197. Yerle-Bouissou, M., Mompart, F., Iannuccelli, E., Robelin, D., Jauneau, A., Lahbib-Mansais, Y., Delcros, C., Oswald, I.P., and Gellin, J. (2009). Nuclear architecture of resting and LPS-stimulated porcine neutrophils by 3D FISH. Chromosome Res. 17, 847–862.
Yin, H., Wang, M.D., Svoboda, K., Landick, R., Block, S.M., and Gelles, J. (1995). Transcription against an applied force. Science 270, 1653–1657. Zhao, Z., Tavoosidana, G., Sjolinder, M., Gondor, A., Mariano, P., Wang, S., Kanduri, C., Lezcano, M., Sandhu, K.S., Singh, U., et al. (2006). Circular chromosome conformation capture (4C) uncovers extensive networks of epigenetically regulated intra- and interchromosomal interactions. Nat. Genet. 38, 1341–1347. Zhu, Y., Gong, K., Denholtz, M., Chandra, V., Kamps, M.P., Alber, F., and Murre, C. (2017). Comprehensive characterization of neutrophil genome topology. Genes Dev. 31, 141–153.