HAL Id: hal-02320524
https://hal.archives-ouvertes.fr/hal-02320524
Submitted on 18 Oct 2019HAL is a multi-disciplinary open access archive for the deposit and dissemination of sci-entific research documents, whether they are pub-lished or not. The documents may come from teaching and research institutions in France or abroad, or from public or private research centers.
L’archive ouverte pluridisciplinaire HAL, est destinée au dépôt et à la diffusion de documents scientifiques de niveau recherche, publiés ou non, émanant des établissements d’enseignement et de recherche français ou étrangers, des laboratoires publics ou privés.
Sensitive High Frequency AC Susceptometry in
Magnetic Nanoparticle Applications
Fredrik Ahrentorp, Andrea Astalan, Christian Jonasson, Jakob Blomgren, Qi
Bin, Olin Thompson Mefford, Minhao Yan, Jeremie Courtois, Jean-François
Berret, Jérôme Fresnais, et al.
To cite this version:
Fredrik Ahrentorp, Andrea Astalan, Christian Jonasson, Jakob Blomgren, Qi Bin, et al.. Sensitive High Frequency AC Susceptometry in Magnetic Nanoparticle Applications. 8th International Confer-ence on the Scientific and Clinical Applications of Magnetic Carriers, May 2010, Rostock, Germany. pp.213-223, �10.1063/1.3530015�. �hal-02320524�
Sensitive High Frequency AC Suceptometry
in Magnetic Nanoparticle Applications
F. Ahrentorp
a, A. P. Astalan
a, C. Jonasson
a, J. Blomgren
a,
Q. Bin
b, O. T. Mefford
b, M. Yan
c, J.
Courtois
c, J.-F. Berret
c, J. Fresnais
d,
O. Sandre
d, S. Dutz
e, R. Müller
eand C. Johansson
aa
Imego AB, Arvid Hedvalls Backe 4, SE-400 14 Göteborg, Sweden.
b
Clemson University, Materials Science and Engineering, 201A Olin Hall, Clemson, SC-29631-0971,USA
c
Matière et Systèmes Complexes, UMR 7057 CNRS Université Denis Diderot Paris-VII Bâtiment Condorcet, 10 rue Alice Domin et Léonie Duquet, 75205 Paris, France
d
UPMC Paris VI – Laboratoire de PhysicoChimie des Electrolytes, Colloides et Sciences Analytiques UMR 7195 CNRS 4 place Jussieu, 75252 Paris Cedex 05, France
e
Institut of Photonic Technology, Albert-Einstein-Str. 9, 07745 Jena, Germany
Abstract. We report on the development of a sensitive high frequency susceptometer capable of measuring in the
frequency range from 25 kHz up to 10 MHz with a volume susceptibility sensitivity of 3.5 × 10⁻⁵ at 100 kHz
corresponding to about 0.3 % of the measured AC susceptibility. In combination with the previous reported DynoMag system capable of measuring dynamic magnetic properties in the range from 1 Hz to 200 kHz we are thus able to measure dynamic magnetic properties between 1 Hz to 10 MHz with high magnetic sensitivity. We will show AC susceptometry applications and results within the fields of magnetic hyperthermia and dynamic magnetic characterization of magnetic nanoparticle system with different particle sizes and magnetic properties.
Keywords: AC susceptometer, Brownian relaxation, Néel relaxation, magnetic nanoparticles, magnetic hyperthermia, magnetic characterization.
PACS: 75.20.Ck, 75.50.Mm, 75.50.Tt, 75.75.Jn.
INTRODUCTION
AC susceptometry is used in many magnetic nanoparticles applications such as magnetic biodetection [1-3], magnetic hyperthermia [4], magnetic characterization of magnetic nanoparticles [5, 6] and studies of particle stability [7]. In order to gain as much knowledge as possible it is of great importance to both have high magnetic sensitivity and a large excitation frequency range so that it is possible to cover all the magnetic relaxations that are present in a magnetic nanoparticles system, for instance the Brownian and Neel relaxation processes. High frequency AC susceptometers have earlier been reported using toroidal shaped high permeability material [5] or induction techniques [8]. With the toroidal shaped AC susceptometry systems it is possible to reach up to the GHz range but the magnetic sensitivity is low, the sample mounting it is somewhat complicated and it is very important to clean the measurement slit in the toroid minutely in order to have an accurate background response. For induction techniques AC susceptometers the highest reported measurement frequency is in the range of 1 MHz [8-9]. By using the induction technique with well balanced detection coil system the magnetic sensitivity can be very high, the sample mounting can be easy and the background measurements can be accurate.
Imego have earlier showed results of a high sensitive AC susceptometer (DynoMag®) [6] with which it is possible to measure dynamic magnetic properties from a few Hz up to 200 kHz. In order to reach the Neel relaxation frequencies for small particles (below about 12 nm for magnetite nanoparticles at room temperature) we started to develop a high frequency version of the DynoMag system within an EU project FP7-214137-Nano3T. With this new
AC susceptometer Imego can today measure dynamic magnetic properties from 25 kHz to 10 MHz combined with a high magnetic sensitivity. Thus, together with the medium frequency range DynoMag system we can measure AC susceptibility in the frequency range from a few Hz up to 10 MHz with a very high sensitivity. In the developed AC susceptometers at Imego we use ordinary induction coil techniques with well balanced differential coils in the centre of an excitation coil and sample movement between in the detection coil system, which will be explained further in the experimental detail chapter. Here we will report on the development of a high frequency AC susceptometer and show results from magnetic nanoparticles applications.
EXPERIMENTAL DETAILS
The High Frequency AC susceptometer
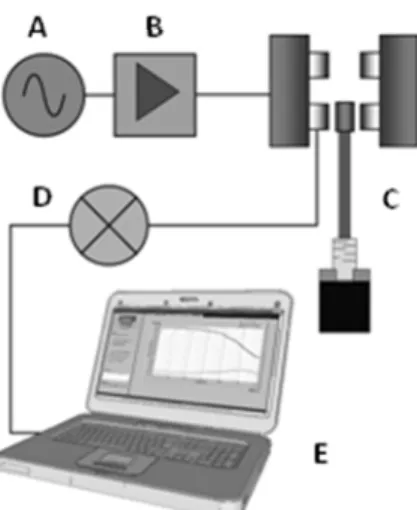
A major concern in the design of an induction coil susceptometer is the parasitic capacitance present throughout the coil system, which limit the frequency range of the AC-susceptometer. The inductance, resistance and parasitic capacitance results in a resonance frequency that must be above the highest measurement frequency. Thus, in order to increase this upper frequency limit, the parasitic capacitance must be minimized. Imego has succeeded to minimize the parasitic capacitance, and are able to measure dynamic magnetic properties in the range from 25 kHz to 10 MHz. The system comprises a combination of standard laboratory equipment, signal conditioning electronics, software, and mechanics. The principal building blocks of the system are seen in Figure 1 below.
FIGURE 1. The principal building blocks of the Imego high frequency AC susceptometer, consisting of AC signal source (A),
current amplifier (B), coil system and mechanics (C), lock in amplifier (D), and user interface software (E).
The excitation coil produces the excitation field with field strength of approximately 24 A/m. The detection coil system is in the form of a first order gradiometer, and is located inside the excitation coil. Without a magnetic material in the detection coils, no detection coil signal should be present. Inevitably though, small variations in geometry between the detection coils exist, giving rise to a background signal. In order to detect small magnetic signals from samples with low content of magnetic material or low magnetic susceptibility, these small variations of the two coils have to be compensated for. This is done by moving the sample between the detection coils and measuring the signal in each coil separately. The measurement resolution of the system, defined as the standard deviation of the volume susceptibility measured at 100 kHz and field amplitude 24 A/m, has been found to be 3.5 × 10⁻⁵ ,corresponding to about 0.3 % of the measured AC susceptibility.
The SHP instrument
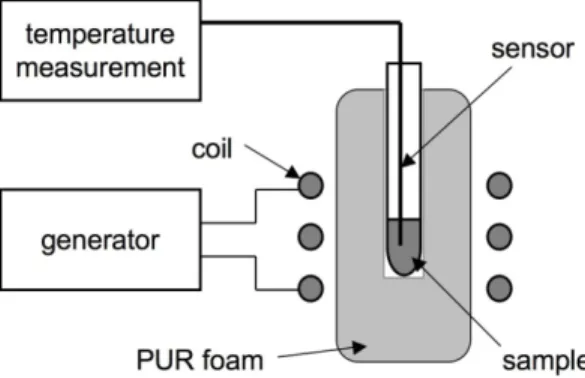
For the calorimetric determination of the Specific heat Power, SHP, the iron oxide suspensions (usually 1ml) were thermally isolated in PUR foam and placed into a circular coil (diameter 5.5 cm; three turns). In order to measure temperature changes over time during exposure to an alternating magnetic field (amplitudes of 11 and 24 kA/m and frequency 410 kHz were used in the experiments), we used a temperature measuring device with a
fibreoptical sensor (OPTOcon, Dresden, Germany). There is no effect of the magnetic field on the sensor. For thermally equilibrated samples with steady temperatures before exposure to an alternating magnetic field, the SHP was calculated by the following formula:
dt
dT
m
m
c
SHP
p s=
(1)where c is the specific heat capacity of the sample, mp is the total iron oxide particle mass in the suspension, ms is
the mass of the sample, dT/dt is the heating rate determined in the linear range (the first ≈30 sec) after switching on the magnetic AC field. Because of the low particle concentration of the samples the specific heat capacity of water was used for the calculation.
We determined the maghemite particle concentration of the dispersions by measuring the specific saturation magnetisation by VSM using either a MicroMag™ 3900 commercial set-up (Princeton Measurements Corp., USA) or a home-made VSM apparatus. We assumed a particle intrinsic saturation magnetisation of 65 Am2/kg, which is a
typical value for maghemite nanoparticles at room temperature. The magnetization curves used for particle size determination were also determined with the VSM instruments.
FIGURE 2. Setup for determination of the SHP consisting of the field generating coil driven by a HF generator as well as the
temperarture measuring system with a fibreoptical sensor
Magnetic Nanoparticle Systems
Maghemite Single-Core Nanoparticles
Superparamagnetic nanoparticles made of maghemite (γ-Fe2O3) were synthesized in water according to
Massart’s procedure [10]. Briefly, magnetite Fe3O4 nanocrystals were prepared at first by alkaline coprecipitation of
a quasi-stoichiometric mixture of iron +II and iron +III salts in HCl (pH≈0.4). Ammonia was quickly added onto the iron salts mixture, which instantaneously produced a black solid suspension. Those Fe3O4 nanoparticles were
acidified with nitric acid and then oxidized by adding ferric nitrate. After 30 min at boiling temperature, the suspension had turned to a red colour characteristic of maghemite γ-Fe2O3. After washing steps in acetone to remove
ions in excess, the flocculate was readily dispersed in water to form a true “ionic ferrofluid”. The iron oxide surface bears positive charges due to adsorption of protons in the acidic medium, a dilute HNO3 solution of pH≈1.5. Such a
ferrofluid remains in a monophasic state under the application of a magnetic field of arbitrary value. On the microscopic scale, the nano-crystals exhibit a Log-Normal distribution of diameters of parameters D0=7.1 nm and σ
=0.37, as measured by VSM magnetometry. Maghemite nanoparticles with such a relatively high size polydispersity were treated with a size-sorting procedure based on fractionated phase-separation [11]. More precisely, the addition of more HNO3 increased the ionic strength and screened the electrostatic repulsions between the nanoparticles.
Above a threshold electrolyte concentration, a phase separation occurs between a concentrated “liquid-like” phase and a dilute “gas-like” phase. After magnetic sedimentation on a strong magnet to accelerate demixtion, a culot (denoted C1) could be readily separated from the supernatant (denoted S1). Then the two fractions were washed by acetone to decrease back the ionic strength. Once redispersed in water, we measured again by VSM their size distributions: D0=8.8 nm / σ =0.36 for C1 and D0=7.2 nm /σ =0.30 for S1. The enrichment of the “liquid-like” phase
by the larger size tail of the distribution compared to the dilute “gas-like” phase originates from the sensitivity of the inter-nanoparticle (mainly Van der Waals’s) potential with diameters. By repeating the phase-separation steps, we obtained a C1C2 fraction of parameters D0=10.7 nm and σ =0.27, and so on until a C1C4 sample characterized by
D0=11.2 nm /σ =0.32. After the size-sorting procedure, the fractions of interest were coated with polyacrylic acid
using a protocol based on electrostatic complexation and adsorption. Poly(sodium acrylate), the salt form of PAA2K
of molar mass MW = 2000 g mol-1 and molar mass dispersity of 1.7 was purchased from Sigma Aldrich. In order to
adsorb polyelectrolytes onto the surface of the nanoparticles, we followed the precipitation-redispersion protocol [12]. The precipitation of the cationic iron oxide dispersion by PAA2K was performed by mixing at pH 2. Then the
precipitate was separated from solution by centrifugation and its pH was increased with NH4OH. The precipitate
redispersed spontaneously at pH≈7.5, yielding a clear solution of polymer coated particles. The hydrodynamic sizes of those γ-Fe2O3@PAA2K core-shells were found 5 nm larger than the uncoated particles, indicating a corona
thickness h=2.5 nm [13] The surface coverage on nanoparticles was estimated to be around 1 adsorbed chain per nm-2. As a final step, the dispersions were dialyzed (Spectra Por 2 MWCO=12 kD) against DI-water. The pH being
adjusted to 8, 90 % of the carboxylate groups of the PAA coating were ionized, as stated by their ζ potential -50mV for a hydrodynamic size Zave=36nm (measured for C1C4@PAA2K with a Malvern NanoZS operating at 173°). An
additional treatment by magnetophoresis on a strong magnetic field gradient was performed overnight [14]. Unlike the addition of excess electrolyte, this procedure does not work on a true phase-separation but simply on the formation of a vertical concentration profile: by pipetting at the bottom of the flasks next to the magnet, we obtained fractions denoted C1C2@PAA2K-sed and C1C4@PAA2K-sed with a slightly larger tail of the distribution towards
the largest diameters.
Table 1 shows the particle size parameters of the prepared maghemite nanoparticles determined with VSM analysis i. e. the magnetization, M, was fitted to the Langenvin expression L(...) integrated over a Log-Normal size distribution, fLN, according to:
∫
=
f
V
dV
kT
VH
M
VL
M
V
M
LN S S S)
(
)
(
1
μ
0 (2)where VS is the volume of the sample, MS the intrinsic saturation magnetization (65 Am2/kg, typical for maghemite
nanoparticles), V the volume of the particles, μ0 the permeability of free space, k the Boltzmann’s constant and T is
the temperature.
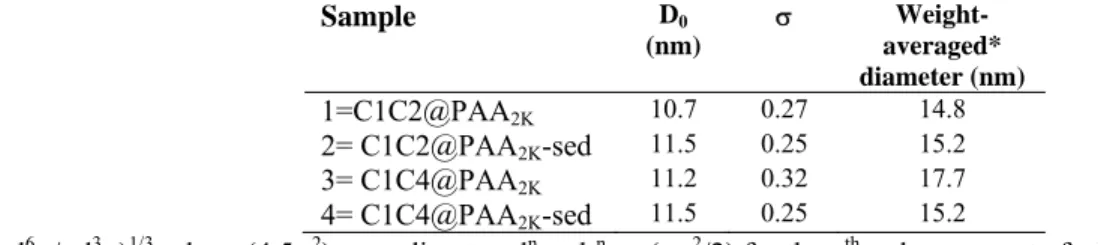
TABLE 1. Particle size parameters, median diameter D0 and standard deviation σ determined from the VSM analysis described
in the text. Sample D0 (nm) σ Weight-averaged* diameter (nm) 1=C1C2@PAA2K 10.7 0.27 14.8 2= C1C2@PAA2K-sed 11.5 0.25 15.2 3= C1C4@PAA2K 11.2 0.32 17.7 4= C1C4@PAA2K-sed 11.5 0.25 15.2 * <d6>/<d3>)1/3 =d
0exp(4.5σ2) according to <dn>=d0nexp(nσ2/2) for the nth order moment of a Log-normal law.
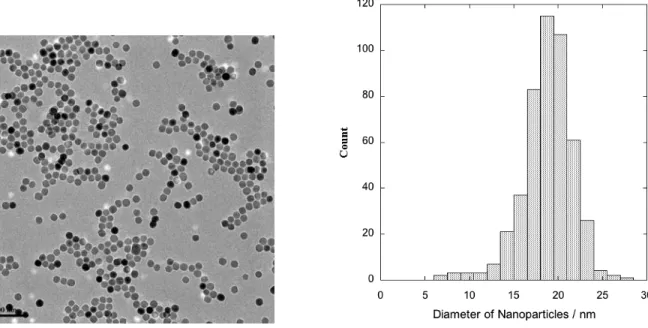
The samples were further analyzed by Transmission Electron Microscopy (TEM) on a JEOL100 microscope operating at 80kV. A TEM picture of a representative area of sample 3 can be seen in figure 3. From TEM analysis, the diameter averaged on 237 particles was dTEM=17.9 nm. We estimated also the weight-averaged diameters of the
samples by calculating the 3th and 6th order moments of the Log-normal distributions deduced by VSM (Table 1).
We found dVSM=17.7 nm for sample 3, which well compares to dTEM from the analysis of the electron micrographs.
The slight deviation may be ascribed to the magnetic anisotropy and magnetic interactions not included in this VSM analysis using only Langevin’s function integrated over a size distribution according to equation 2 [15,16].
0 10 20 30 40 50 60 2 8 14 20 26 32 38 44 50 56 Diameter (nm) Number of pa rticl e s
FIGURE 3. A representative TEM picture (left) of sample 3 of the maghemite nanoparticles(bar length is 100nm) and a size
histogram (right) of the diameters of the nanoparticles.
Magnetite Single-Core Nanoparticles
Ferric chloride anhydrous was purchased from Spectrum Chemical, sodium oleate was purchased from TCI, oleic acid (90%) and hexane (95+%) were purchased from Alfa Aesar, ethanol, anhydrous was purchased from Fisher Scientific. All chemicals were used directly without further purification. Particles were synthesized based on methods previously reported by Park et al [17]. Particles were formed by first creating an iron-oleate complex. This complex was then thermal decomposed at elevated temperatures yielding the monodisperse particles. First, an iron-oleate complex was formed. Briefly, 10 mmol of ferric chloride and 30 mmol of sodium iron-oleate were dissolved in a mixed solvent composed of 20 ml ethanol, 15 ml distilled water, and 35 ml hexane. This solution was then heated to 70°C and held at this temperature for four hours. After cooling down to room temperature, the solution separated into to two layers, and then the upper organic layer was washed 3 times with 30 ml distilled water in a separatory funnel to remove residual hexane. The resulting iron-oleate complex was a waxy solid form.
To form the nanoparticles, 10 mmol of as prepared iron-oleate complex and 20 mmol of oleic acid were dissolved in 64 ml of 1-octadecene at room temperature. Then the mixture was heated to 320 °C with the ramping rate of 3.3 °C/min, and kept to reflux at that temperature for 30 min, then cooled to room temperature by removing the heating source. Nanoparticles were precipitate out by adding 100 ml ethanol into the prepared solution. The nanoparticles were separated by centrifugation and washed by the mixture of ethanol and hexane (volume ratio 1:1) for five times and then redispersed in hexane. Particles for high-resolution transmission electron microscopy (HR-TEM) characterization were obtained by drying a dispersion on copper grid coating with carbon film, and then tested by Hitachi H-9500 (300 kV), see figure 4. Then the images were analyzed by FOVEAPRO 4.0 and the data were calculated by KaleidaGraph to obtain size histogram. The as prepared nanoparticles were diluted by hexane and characterized via dynamic light scattering (DLS, Malvern Instrument Nano-ZS) to measure their hydrodynamic volume. The volume weighted hydrodynamic diameter determined by the DLS analysis was found to be about 30 nm.
FIGURE 4. To the left a TEM image of the 20 nm magnetite nanoparticles deposited on copper grid coating with carbon film.
The scale bar is 100 nm. To the right size distribution histogram of as synthesized 20 nm magnetite nanoparticles. The mean value of the particles in diameter is 18.9 nm, with the standard deviation of 2.8 nm.
Magnetite Multi-Core Nanoparticles
We analyzed also the dynamic magnetic properties of Nanomag-D nanoparticles with a diameter of 130 nm from Micromod Partikeltechnologie GmbH. These particles are magnetic multi-core particles meaning that the particles contain a large number of single-domains. The single-domains are magnetite crystals with diameters in the range of 12 nm.
RESULTS AND DISCUSSION
Magnetic Hyperthermia Applications
Magnetic hyperthermia using magnetic nanoparticles relies on the fact that the particle system absorbs energy when it is subjected to an alternating magnetic field at a specific frequency. The amount of energy absorbed depends on the magnetic loss of the magnetic nanoparticle system. In order to optimize the energy absorption of the
nanoparticle system the size of the particles has to be fitted to the used hyperthermia frequency and the size distribution has to be as low as possible. In order to determine the magnetic loss spectra in a large frequency range for a nanoparticle system it is very straightforward to use high frequency AC susceptometry that covers the used hyperthermia frequency range. From the AC susceptometer data the specific heat power absorption, SHP,expressed in W/g can be estimated in a large frequency range. The traditional way to do this is to approximate that the
amplitude of the imaginary part of the magnetization, M’’, is linear to the excitation field amplitude, H0, and P is
then given by [4].
S
V
fH
SHP
=
πμ
0χ
″
02 (3)where f is the frequency and χ’’ is the imaginary component of the susceptibility. However, at large field amplitudes the magnetization is no longer linear to the field as can be seen from figure 5.
0 0.5 1 1.5 2 2.5 3 0 5 10 15 20 25 N o rm al ui z e d m a g neti c m o m e n t (a rb. un it ) H (kA/m)
FIGURE 5. Magnetization curve for sample 4. The used field amplitudes in the SHP determination are 11 kA/m and 24 kA/m.
The linear line is the extrapolation of the low field linear portion of the magnetization curve to higher fields.
At the highest field amplitude used in this study (24 kA/m) the ratio ofmagnetic energy to thermal energy (
μ
0M
SVH
/
kT
) is about 2 and as we can see from figure 5 the magnetization is no longer linear to the field at these field strengths. In order to take into account the non-linear response we propose that the measuredmagnetization curve, Mexp, and the measured imaginary part of the AC susceptibility normalized to the static
susceptibility (f=0),
χ ,
'' can be used to estimate the non-linear field dependence of the imaginary part of the magnetization, M’’, and SHP values can then be estimated according to.0 '' exp exp
H
M
SHP
∝
χ
(4)Further, the shape of M’’ versus field is deviating from an ellipse at high fields and the exact curve shape and thereby the true loop area (absorbed energy) can also be determined at higher field amplitudes. When the
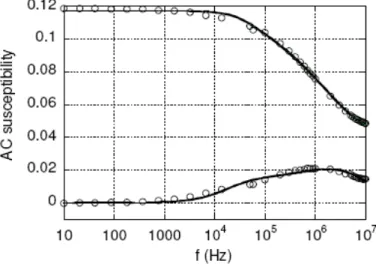
temperature increase in the nanoparticle system, the susceptibility value decreases (according to a Curie law for non-interacting particles) and the relaxation frequency (Néel relaxation) is shifted to higher frequencies. All of the temperature effects will decrease the dynamic magnetic response at the used SHP frequency (410 kHz) since the relaxation peak is at about at 1 MHz, see figure 6 showing the AC susceptibility versus frequency for sample 4. When we take all these effects into consideration, we can estimate the SHP values from the AC susceptometry analysis described above. The results can be seen in table 2.
TABLE 2. The table shows the measured SHP values in W/g(magnetic material) for the maghemite single-core nanoparticles at
two different field amplitudes and the estimated SHP values from the AC susceptometry measurements. All the measurements were carried out with the particles in solution.
Sample Measured at 11 kA/m Measured at 24 kA/m Estimated at 11 kA/m Estimated at 24 kA/m 1 97 250 100 305 2 96 242 105 315 3 72 200 70 215 4 72 197 75 225
As can be seen from table 2 the resemblance between the measured and estimated SHP values is good especially at the lower field amplitudes. At the high field amplitudes there are some discrepancies between measured and estimated values, which can be explained by the fact that at higher field amplitudes, higher orders of the dynamic magnetic response [18] have to be taken into account. In addition, at higher field amplitudes the effect of particle clustering due to magnetic interaction can increase which will influence the dynamic magnetic response. It is
however seen that some of the non-linear effects can be explained by the non-linear response from the magnetization curve. The field dependence in the measured SHP values can also be predicted by using equation 4.
Dynamic Magnetic Characterization Applications
For a general magnetic material, AC susceptometry gives information of the different magnetic relaxations that are present in the magnetic system. For a magnetic nanoparticle system in a carrier liquid both the Brownian relaxation and the Néel relaxation can be present depending on the size of nanoparticles for a specific material in the nano-particles, carrier liquid, and the temperature in the nanoparticle system. The magnetic response as a function of the excitation frequency, f, can be represented by the susceptibility component that is in the phase with the excitation field (the real part) and the susceptibility component that is in quadrature to the excitation field (the imaginary part).
Maghemite Single-Core Nanoparticles
One example of dynamic magnetic measurements where we used both the DynoMag system from 10 Hz to 200 kHz and the high frequency AC susceptometer from 25 kHz to 10 MHz can be seen in figure 6 for sample 4 of the maghemite nanoparticles.
FIGURE 6. AC susceptibility, real (upper curve) and imaginary part (lower curve) versus excitation frequency of sample 4 at
300 K. The solid line is the result of the fitting to the single-core model as described in the text. Measurements are carried out with the particles in solution (water).
From figure 5 we can see that there is a very good overlap between the two used AC susceptometers. The peak in the imaginary part of the susceptibility at about 2 MHz is due to the internal Néel’s relaxation of the nanoparticles. From the above result for the single-core maghemite particle system (sample 4) we can fit the data to a single-core Debye model according to:
( )
(
( )
)
( )
H H high H eff Cdr
r
f
r
j
r
C
χ
ωτ
ω
χ
+
+
=
∫
1
6 (5) Where the pre-factor, C, is dependent on the temperature and the intrinsic saturation magnetization, rC the radius ofthe magnetic core, f(rH) is the size distribution (log-normal) of the hydrodynamic radius, rH, of the particles, ω=2πf,
j equal to
−
1
and χhigh is the high frequency response for instance due to the intra-well potential contribution tothe AC susceptibility [19]. In the fitting procedure the hydrodynamic radius and magnetic core radius were set equal (i. e. rC = rB). The effective relaxation time, τeff, is given by:
B N
τ
τ
τ
1
1
1
eff+
=
(6)τN is the Néel relaxation time given by 0
exp(
)
kT
KV
N
τ
τ
=
where τ0 is characteristic relaxation time in the rangeof 10-9 s – 10-10 s, K the magnetic anisotropy and V is the volume of the single-domain. The Brownian relaxation
time τB is given by
kT
V
B
η
τ
=
3
where η is the viscosity of the carrier liquid. In the size analysis we used a value of the magnetic anisotropy to be 3 × 10⁴ J/m3 [16] a typical anisotropy value for maghemite nanoparticles in this sizerange. The results from the above described particle size analysis gives a median particle diameter of 11.5 nm that are well matched with the obtained VSM size analysis, 11.5 nm, as described in the experimental chapter.
Magnetite Single-Core Nanoparticles
AC susceptibility versus frequency of the 20 nm magnetite single-core nanoparticles can be seen in figure 7.
0 0.001 0.002 0.003 0.004 0.005 0.006 0.007 104 105 106 107 AC s u sc ept ibi li ty f (Hz) Imaginary Real
FIGURE 7. AC susceptibility (the real and imaginary part) versus excitation frequency of the magnetite single-core
nanoparticles at 300 K. Measurements were carried out with the nanoparticles in solution (hexane).
The relaxation peak at about 5 MHz is due to the Néel relaxation. Since the magnetite single-core nanoparticles has a mean diameter of about 20 nm and that the Néel relaxation peak is as high as 5 MHz the effective magnetic anisotropy must be small compared to other magnetite single-nanoparticles in this size range.
Magnetite Multi-Core Nanoparticles
Another example of the AC susceptometry measurements can be seen in figure 8 where we have measured on the Nanomag-D 130 nm magnetite multi-core particles from Micromod.
0 0.01 0.02 0.03 0.04 0.05 1 10 100 1000 104 105 106 107 Real part Imaginary part A C sus c ep ti bi lit y f (Hz)
FIGURE 8. AC susceptibility, real (and imaginary part versus excitation frequency of nanomag-D 130 nm particle system from
Micromod at 300 K. Measurements were carried with the nanoparticles in solution (water).
The peak in the imaginary part at about 350 Hz is due to Brownian relaxation consistent with the particle diameter of the particle system. If we use a multi-core model and fitting the AC susceptibility [6] we can estimate a particle hydrodynamic diameter of about 130 nm which is consistent with the specification from Micromod. Note that all the single domains in this particle system are thermally blocked with respect to the particle rotation since no Néel’s relaxation can be observed at higher frequencies (> 1 MHz). The non-zero value of the real part above the Brownian relaxation frequency is probably due to the intra-potential-well contribution to the AC susceptibility [19].
CONCLUSIONS
We have shown that AC susceptometry based on induction techniques is a valuable magnetic characterization tool for magnetic nanoparticles for instance within the fields of magnetic hyperthermia and for dynamic magnetic analysis of magnetic nanoparticles. When the proper non-linear field dependence of the magnetization is taken into account SHP values can be estimated from the AC susceptometry analysis with good accuracy when compared to measured SHP values. When the full high frequency AC susceptometer response is analyzed for nanoparticles undergoing Néel’s relaxation, the particle sizes can be estimated or the magnetic anisotropy if the particle sizes are known from other independent analysis techniques for instance size analysis from VSM data.
ACKNOWLEDGMENTS
We would like to acknowledge Micromod Partikeltechnologie GmbH for providing the Nanomag-D particle systems. We would also like to acknowledge the EU project Nano3T FP7-214137-Nano3T for financial support.
REFERENCES
1. A. P. Astalan, F. Ahrentorp, C. Johansson, K. Larsson, A. Krozer. Biosens. Bioelectron., 19, 945–951 (2004). 2. M. Strömberg, J. Göransson, K. Gunnarsson, M. Nilsson, P. Swedlindh, M. Strømme, Nano Lett., 8 (3), 816–
821 (2008).
3. F. Öisjöen, J. F. Schneiderman, A. P. Astalan, A. Kalabukhov, C. Johansson, D. Winkler. Biosensors and
Bioelectronics 25, 1008–1013 (2010).
4. R. Hergt, S. Dutz, R. Müller, M. Zeisberger. J. Phys.: Condensed Matter 18, S2919-S2934 (2006). 5. P. C. Fannin, B. K. P. Scaife, S. W. Charles. J. Phys. E: Sci. Instrum. 19 (1986).
6. A. P. Astalan, C. Jonasson, K. Petersson, J. Blomgren, D. Ilver, A. Krozer, C. Johansson. Journal of Magnetism
and Magnetic Materials 311, 166-170 (2007).
7. A. P. Herrera, C. Barrera, Y. Zayas, C. Rinaldi. Journal of Colloidal and Interface Science 342, 540-549 (2010).
8. M. Zeisberger, S. Dutz, R, Müller, R. Hergt, N. Matoussevitch, H. Bönnemann. Journal of Magnetism and
Magnetic Materials 311, 224-227 (2007).
9. F. Ludwig, A. Guillaume, M. Schilling, N. Frickel and A. M. Schmidt, to be published in J. Appl. Phys. (2010). 10. R. Massart, IEEE Transaction on magnetics, 17 (2), 1247 (1981).
11. R. Massart, E. Dubois, V. Cabuil, E. Hasmonay, J. Magn. Magn. Mater. 149, 1-5 (1995). 12. A. Sehgal, Y. Lalatonne, J.-F. Berret, M.Morvan, Langmuir, 21 (20), 9359-9364; (2005). 13. B. Chanteau, J. Fresnais, J.F. Berret. Langmuir, 25 (16), 9064-9070 (2009).
14. Berret, J.-F.; Sandre, O.; Mauger, A., Langmuir 2007, 23, (6), 2993-2999.
15. M. Hanson, C. Johansson, S. Morup, J. Phys.: Condens. Matter 5 725-732 (1993).
16. C. Johansson, M. Hansson, M.S. Pedersen, S. Mørup, Journal of Magnetism and Magnetic Materials 173, 5-14 (1997).
17. J. Park, E. Lee, N.–M. Hwang, M. Kang, S. C. Kim, Y. Hwang, J.-G. Park, H.-J. Noh, J.-Y. Kim, J.-H. Park, T. Hyeon, Angewandte Chemie 2005, 44, 2872-2877.
18. T. Yoshida and K. Enpuku, Japanese Journal of Applied Physics 48 127002 (2009).
19. P. Svedlindh, T. Jonsson, J. L. Garcia-Palacios, Journal of Magnetism and Magnetic Materials 169, 323-334 (1997).