HAL Id: cea-02509727
https://hal-cea.archives-ouvertes.fr/cea-02509727
Submitted on 17 Mar 2020
HAL is a multi-disciplinary open access
archive for the deposit and dissemination of
sci-entific research documents, whether they are
pub-lished or not. The documents may come from
teaching and research institutions in France or
abroad, or from public or private research centers.
L’archive ouverte pluridisciplinaire HAL, est
destinée au dépôt et à la diffusion de documents
scientifiques de niveau recherche, publiés ou non,
émanant des établissements d’enseignement et de
recherche français ou étrangers, des laboratoires
publics ou privés.
Opportunities and challenges of photovoltaic (PV)
growth with self-consumption model
H.-J. Yu, N. Popiolek
To cite this version:
H.-J. Yu, N. Popiolek.
Opportunities and challenges of photovoltaic (PV) growth with
self-consumption model. 38th IAEE International Conference - International Association for Energy
Economics, May 2015, Antalya, Turkey. �cea-02509727�
1. Introduction
The photovoltaic (PV) system is one of the promising technologies for power generation as it provides an abundant energy resource and lends itself well to decentralized systems. The photovoltaic (PV) market has demonstrated exponential growth over the last decades. Grid parity is achieved in many countries thanks to the reduced PV system prices. Over the decades, technological progress and industry development have helped to reduce the PV system per unit production cost. In addition, the Feed-in-Tariffs (FIT) system has played an important role in the recent PV market growth, providing incentives to investors. Policy support with a long-term vision has helped stimulate PV demand and accordingly attracted industrial investment, thus leading to more cost reductions via economies of scale in manufacturing [1]. The FIT system is an effective tool but needs a sophisticated price design mechanism to avoid any uncontrolled market development [2]. The FIT scheme is very tariff-sensitive policy instrument containing a risk factor; investors aim to maximize windfall profits from a margin of the marginal PV electricity generation cost and the fixed tariff. Under the FIT system, there are installation peaks just before the application of new reduced tariffs; this is to maximize economic gains by installing PV systems at the latest possible times to encourage price drops in module prices (see the appendix) [3].
The global PV market needs a new approach that is more stable to incite further PV growth. Since energy systems evolve with the aim of supplying energy to end-users at the lowest possible costs, energy policy should aim to minimize PV electricity costs, while minimizing grid integration costs and risks as PV penetration progresses. The PV system’s integration in the current or future energy system can be justified when such efforts are based on the way of improving social welfare.
In this context, this article explores opportunities for PV electricity use under a self-consumption mechanism to find ways of PV penetration growth. The objective is to find better ways of increasing PV installations in a society with least costs. The promotion of self-consumption of PV system can be a more natural way of using PV systems. It can improve the use of PV electricity in the current and future energy system if applicable under a properly designed framework. The study aims to look for opportunities of PV electricity use under a self-consumption mechanism following the steps below.
1. Explore new opportunities based on a model of self-consumption Present the PV self-consumption model
Conduct stakeholder analysis: Identify stakeholders of PV self-consumption and understand their interests/ influences
Define policy risks and mitigation strategies
2. Conduct a micro-economic case study to quantify self-consumption opportunities: France’s existing supermarkets
Present key data & assumptions
Demonstrate possible opportunities of PV electricity use in the building sector Identify possible impacts on stakeholders and mitigation strategies
3. Policy recommendations/conclusion
2. Opportunities and challenges based on a PV self-consumption model 2.1. PV self-consumption model
PV self-consumption is a new way of using distributed PV installations in the energy system. The self-consumption of PV power refers to the use of PV electricity directly at the same site where it is produced, with a smaller amount of electricity feed into the grid [4]. The self-consumption model reduces the distance between electricity generation and consumption through onsite consumption of power.
1 This paper will be presented at the 38th IAEE (International Association for Energy Economics) International Conference, May 25-27, 2015, Antalya,
Turkey
OPPORTUNITIES AND CHALLENGES OF PHOTOVOLTAIC (PV)
GROWTH WITH SELF-CONSUMPTION MODEL
1Hyun Jin Julie Yu, Institute for Techno-Economics of Energy Systems (I-tésé), French Alternative Energies and Atomic Energy Commission (CEA Saclay), Gif sur Yvette, France, +33(0)1 69 08 67 10, julie.yu@cea.fr
Nathalie Popiolek, Institute for Techno-Economics of Energy Systems (I-tésé), French Alternative Energies and Atomic Energy Commission (CEA Saclay), Gif sur Yvette, France, +33(0)1 69 08 67 10, nathalie.popiolek@cea.fr
2.1.1. Economic incentives of the PV self-consumption model
End-users have economic incentives to adapt the mode of self-consumption of PV electricity when it helps them to reduce their electricity bills or provide them with some financial incentives compared with the conventional way of purchasing electricity from the grid. Furthermore, the self-consumption of PV power is interesting for countries which have high electricity tariffs with less attractive feed-in-tariffs for PV [5]. Furthermore, PV system costs are one of the most important levers when defining the initial investment needed to calculate the levelized costs of PV energy (LCOE, $/kWh). LCOE will also depend on other factors like module efficiency, capacity factor, cost of capital and lifetime. Combined with high retail rates of electricity, the reduced PV LCOE will motive end-users to install PV systems. In addition, the ratio of self-consumption, which defines the rate between onsite consumption and the total production of the system installed on the site, is a very important factor in terms of defining the economics of the self-consumed model of PV power. Therefore, it is necessary to choose PV installation sites where it is possible to best correlate the pattern of onsite energy use with PV system output to have an optimal adaptation of the load profile for the self-consumed model [6].
2.1.2. Applicable areas
The self-consumed model can be applicable in various sectors with different ratios of self-consumption to the output of the PV system. Possible applications for each sector are described below: [7]
1. Industrial/commercial: good correlation between onsite consumption & production profile with most consumption during the day
2. Separate residential (without storage): weak correlation between onsite consumption & production profile with impacts on the network with injected electricity
3. Collective buildings: better correlation between onsite consumption & production with broader geographical spread with interconnected collective buildings in a zone
4. Non interconnected zone (with storage): ideal to provide power in isolated areas to replace fossil fuels or to resolve interconnection problems.
The residential sector has a peak demand in the morning and in the evening; however, supermarket and office areas have a mid-day peak, which means they are more suitable for the self-consumption model because of the correlation of the mid-day PV production and consumption pattern. The good matching of PV output and onsite demand is found in commercial and office buildings rather than in the individual residential sector because self-consumers are often not home during the day. If the installed PV system cannot capture the full value of PV output, the return on investment will be significantly reduced.
Figure 1: The self-consumed model of PV system [4][8] Figure 2: Daily electricity demand and PV system outputs [4]
2.1.3. Grid connection type
PV systems can be connected to the grid according to different options. Some countries allow PV systems to feed 100% of the electricity produced into the grid (in front of the meter grid connection), while others only allow the transfer of excessive PV output after onsite-consumption (behind the meter grid connection) in the grid. The first mechanism is related to the FIT scheme policies, whereas the latter is mostly associated with policies like net metering [6][9].
Figure 3: FIT scheme Figure 4: Net metering scheme
o FIT scheme: PV installers are allowed to transfer all electricity produced to the grid and consume electricity from the grid. The injected electricity will be compensated on the basis of pre-defined tariffs during a fixed period, and they will pay for the electricity consumed according to the applicable electricity rates [10].
o Net metering system: End-users who produce electricity from PV systems are allowed to inject excessive electricity into the grid (the difference of PV output to onsite consumption). Billing will be calculated on the basis of the net electricity from/to the grid during the applicable period [8][11].
o PV system +storage: PV systems can be self-consumed without connecting to the grid. In this case, a storage system is needed. This can be considered as an option to provide power to isolated areas, which mostly relies on fossil fuel generation [6].
FIT and net-metering policies differ from one country or state to the next, e.g., different rates are applicable in terms of the compensation amount or level, and often different strategies are in place with respect to the instantaneous consumption of onsite production. The self-consumption system combined with the net metering system has developed in several countries like the US, Japan, Canada and some European countries, based on different legal frameworks [12].
2.1.4. Benefits of the PV self-consumed model
The benefits of PV self-consumption are not limited to economic drivers of end-users. The PV self-consuming electricity model is a smart way of utilizing the nature of PV systems i.e. they are easily decentralized. With the widespread penetration of PV systems into the existing energy system, grid-related costs can be added in terms of grid reinforcement and extension [13][14][15]. However, the PV self-consumed system reduces network stress. In addition, when PV outputs are self-consumed during peak times, the level of avoidance is much greater by reducing power feed-in at the point of interconnection, thereby decreasing the occurrence of voltage problems [16]. Under a properly designed policy framework, the self-consumption model can provide some specific benefits by minimizing distance between production and consumption to almost zero. Some benefits are captured as below [6];
Reduce power losses during transmission and distribution (T&D) Avoid system congestion
Curtail investments for grid extension when using the existing surfaces of buildings connected to the grid Avoid further investment for grid upgrading when the PV system helps reduce electricity demand peaks Increase energy independence eventually by coupling with storage systems.
In addition, one important benefit of solar PV installations is related to land use. PV can optimize the existing infrastructures to avoid significant impact on land use; it can be easily integrated into existing buildings or parking lots. In addition, unlike conventional energies (e.g. coal, nuclear), it does not require large spaces for waste disposal [6]. Furthermore, the development of solar energy can bring environmental benefits (e.g. reduction of greenhouse gas (GHG) emissions) and economic benefits, which create jobs in manufacturing, installation, service industries, and associated industries for the national economy [17][18].
2.1.5. Limits and challenges of the PV self-consumed model
Limits and challenges to develop the PV self-consumed model are related to general weak points of PV system. A large penetration of distributed PV systems in the current grid infrastructures can change energy market mechanisms. Possible challenges are explained below [4][6][8][19]:
Issues in terms of grid stability (e.g. overloading, congestion issues by excess power export, or power quality degradation). These problems are location-specific; some local areas, which have weak grid infrastructures or excess grid congestion, will encounter more problems than other regions that have solid grid systems with little grid congestion. Technological progress sometimes provides better performance levels to maintain the grid quality; e.g. advanced inverters support better network stability. The PV self-consumed model can be a good solution in congested areas within the grid.
Financial impact on other stakeholders (e.g., grid operators, other utilities, end-users of electricity, government). There are concerns around the cost recovery of fixed grid costs and reduced tax revenues.
Difficulties for long-term planning and forecasting of the national electricity supply. However, a well-designed cluster of small-decentralized PV systems can help smooth PV intermittency, thus limiting the balancing costs that can be induced by large centralized PV plants.
In addition, new technology development (e.g. smart grids, etc.) is very important in terms of integrating distributed PV systems into the electric mix. Furthermore, how the policy prepares the long-term vision with a proper institutional framework affects the success of the PV self-consumed system’s development.
The exiting institutional framework should be adapted to support this development with the objective to avoid damaging the interests of stakeholders. In this regard, it is important to understand stakeholder concerns associated with the integration of the self-consumption model in energy system and its impact on their interests and benefits on a national level.
2.2. Stakeholder analysis: PV self-consumption’s impacts on stakeholders and their strategies
The introduction of the PV self-consumed model in the energy system brings about changes in stakeholder interests. As impacts can be positive or negative according to the party concerned, stakeholders will take different strategies regarding the new usage mode of PV power. Political strategies on the PV self-consumption model have a great influence on stakeholder movements. When the policy decision conflicts with their interests, they sometimes generate political
pressure to affect the political decision and thereby create obstacles that hinder the use of the PV self-consumed model [6]. In this context, a deep understanding of stakeholder positions is necessary as a precedent exercise to help prepare proper steps forward to develop the PV self-consumed model. Therefore, this article conducts a stakeholder analysis to identify the key stakeholders and their interests. Based on the defined situation of each stakeholder, possible strategies to address potential policy risks related to stakeholders can be prepared.
2.2.1. Identification of key stakeholders
The current energy system is comprised of several groups of stakeholders. Any group or entity whose interests may be affected or feel they have concerns with the new policy action or organizational change, can be considered in the stakeholder analysis. The stakeholder analysis used herein is frequently used in business science, but is often applied in other fields like political or environmental sciences or game theory [20].
The stakeholder analysis should be conducted in a systemic way under the energy market mechanisms. Below Figure 5 captures the key stakeholders in a simplified value chain for the energy market with the introduction of the PV self-consumed model. End-users with the PV self-self-consumed model are described as PV system owners interacting with other stakeholders like the existing grid operation under policy and regulations. The new mode of PV power usage is associated with stakeholder interests in the value chain for the energy market.
Figure 5: Stakeholders in the value chain for the energy market [21][22]
2.2.2. Understanding stakeholders interests and assessing the importance of influences
With the implementation of the new mode of PV power usage, stakeholders experience changes in their interests in the current energy market model. It is important to understand stakeholder viewpoints with potential opportunities or threats that they can create. In doing so, strategies can be better prepared to take into account negotiations with opposing groups (if any) or to mitigate policy risks.
Table I gives a general explanation of the impacts on stakeholders’ interests. Self-consumers using PV systems have economic drivers to adapt the new mode with the objective of either reducing their electricity bill or gaining profits from the PV system installation. However, this movement will influence other stakeholder interests by changing the existing energy market mechanisms. First, existing power generation companies and grid operators will generate less revenue; PV self-consumers buy less electricity from the grid. End-users probably pay increased electricity bills because fewer consumers pay for the electricity from the grid. The government collects less tax faced with reduced electricity ratepayers and reduced sales of FIT electricity. In order to address such impacts, a fair cost-sharing mechanism should be considered.
Even though the large penetration of the PV self-consumed model gives rise to conflicting interests for some stakeholders, increased PV self-consumption in the energy system brings environmental (e.g. GHG emission reduction) and economic (e.g. investments in associated investments and job creation) benefits. Therefore, policy makers should conduct in-depth analysis to compare policy costs and expected benefits so as to find a balance among stakeholders with the objective of increasing social benefits prior to making policy choices for the national energy strategy.
Table I: Stakeholder analysis with penetration of the self-consumed model [4][6][8][17][23]
Stakeholders Objectives Impact on stakeholder interests
PV self-consumers Pay less for electricity Profit-seeking Energy independence Preference of green electricity
Returns (positive/negative) on investment Self-consumption of PV power
Power generation companies
Maximize profits
Amortize existing investment
Reduced profits due to decreased sales of electricity
- Lower revenue from spot-market sales - Less investment for long-term decisions
Grid operators Stable supply of electricity Grid reliability with large penetration of intermittent PV power
Reduced revenue due to reduced electricity consumption from the grid
End-users (electricity consumers)
Pay less for electricity Electricity rates increase with fewer ratepayers (under recovery of fixed costs)
- Cost-shifting for surcharges to ratepayers (fair share of fixed infra
costs)
Government Maximize social welfare Tax revenue
Energy security, Energy equity,
Energy transition, Green economic growth
Tax revenue loss from reduced retail sales Reduced income taxes on FIT revenues Increase energy diversification
Increase economic and environmental benefits
Investors (e.g. banks)
Maximize profits Returns (positive/negative) on investment
Associated industries
Maximize profits Induced investments and job creation:
e.g. storage, demand response, heat pumps, electric cars, companies of components of PV value chain, and smart grid
2.2.3. Policy risks and mitigation strategies
As seen, the large deployment of the PV self-consumed model conflicts with some stakeholder interests. This can be threat factors when the government decides to develop the PV self-consumed model in the energy system. Therefore, possible strategies to avoid expected hindrance actions from stakeholders should be considered. Targeted strategies should be used when dealing with different stakeholders. The defined stakeholders are reorganized into a 2x2 Interest-Influence matrix2. This is based on the World Bank’s approach for stakeholder mapping in terms of policy design or reform [20][24].
Figure 6: Interest-Influence matrix: Stakeholders with the PV self-consumed model (author’s analysis)
Promoter: Stakeholders who have significant interests in the policy and help to make it successful (e.g. the
government, policy makers)
Defenders: Stakeholders who have relative interests in the policy and make an effort to promote it in the
community with the aid of media or opinion groups with little actual power (e.g. PV prosumers, PV industry, associated industries)
Latents: Stakeholders who have no particular interest in the policy but have power to influence it when the
policy impacts their interests (e.g. power generation companies, grid operators, end-users)
Apathetics: Stakeholders who have little interest and little power; they are perhaps unaware of the policy (e.g.
electricity end-users who are not very price-sensitive).
Policymakers should take into account expected change in stakeholders’ interests with the new mode of energy usage. Understanding the possible influence of stakeholders on the policy decision is very important to reach the expected results. The position of promoter group is directly related to the success of the PV self-consumed model since promoter groups have great influence to develop it. Let assume a government as promoter who is willing to develop the PV self-consumed model. The government prepares appropriate policy support and the institutional framework to provide favorable conditions for the PV self-consumed model’s development in a national energy system. On the contrary, when the government decides against being a promoter of the new mode, the PV self-consumed model faces a great obstacle. Prior to the policy decision, the government can compare expected costs and benefits on a national level to decide on their policy vision. Defenders are the public who want to develop the new model to gain expected interests (e.g. PV self-consumers, PV or associated industries). The latent group should be closely examined because they represent a large potential threat. When the policy results are expected to conflict with their interests, they will strongly oppose the policy making and disturb the development of the PV self-consumed model. In this regard, targeted strategies for defined stakeholders from the latent group are needed to address any opposing movements; e.g. power generation firms, grid operators, and end-users. This study attempts to identify the latent groups and expected changes in their interests so as to draw proper policy recommendations to address those changes.
2Authors’ analysis based on World Bank’s definition
3. Micro-economic case study: opportunities with the self-consumption model in French supermarkets 3.1. PV self-consumption modeling methodology
A micro-economic case study has been conducted to review opportunities for the PV self-consumed model by using the existing surface area of supermarkets in France. The supermarket sector theoretically shows the best correspondence between onsite consumption and PV outputs, while providing large unoccupied surface areas to install PV systems. This section describes a simulated model to give a quick yet precise idea of the opportunities of PV self-consumption. Possible challenges and risks under this model are also considered so as to better prepare future strategies. Policy strategies to support the model are discussed at the end of this article. The modelling methodology has the following steps.
Firstly, the key drivers of the PV self-consumed model were studied to define the key input data; these data are related to the economics of the self-consumed system. For example, electricity prices for supermarkets, LCOE, surface area available, and the ratio of correspondence between onsite consumption and PV output. Secondly, the production and consumption curves in supermarkets were modeled according to the input data defined in the above step. Thirdly, the collective outcomes were calculated; expected installed capacity, PV electric output, impacts on the grid (avoided system congestion, contribution to lowering the electricity peak) and the increased energy independence. Lastly, based on the results, we aim to review costs/benefits for key stakeholders with a focus on the latent group (utility power plants, grid operators, and the government). It is because they represent a potential threat if the PV self-consumed model conflicts with their interests. The key findings may prove useful when make policy recommendations related to the PV self-consumed model.
3.2. Key input data & assumptions
We have identified key economic drivers, which define the economics of the PV self-consumption system. Key data and assumptions are presented here below.
3.2.1. Electricity price
Higher retail electricity prices lead to economic incentives for using a PV self-consumed system or vice-versa. In most countries, retail rates of electricity include electricity generation costs, T&D costs, profit margins and additional surcharges or taxes [6]. Table II indicates France’s electricity tariff changes in residential and small industrial areas over time. France has relatively low electricity rates compared with other neighboring or European countries. However, tax represents a large fraction in the electricity tariff in France, having increasing from 25% in 2008 to 33% in 2014. Since 2009, there is a rising trend in electricity prices in both residential and industrial sectors in France. A similar trend also exists in the German electricity rates over the last years; as Table II shows, Germany’s electricity rates have risen by 53% from 19.49 c€/kWh in 2007 to 29.81c€/kWh in 2014. This is mainly due to the increased EEG (renewable energy sources act) to finance the national energy transition.
Table II: Electricity Prices in France and Germany [25][26][27]
France Germany Household Year Electricity price ( c€/kWh) CSPE (c€/kWh) 2000 11.79 0 2007 12.11 0.45 2014 15.85 1.65 Industry < 2000MWh Year Electricity price ( c€/kWh) CSPE (c€/kWh) 2000 6.59 0 2007 7.01 0.45 2014 11.57 1.65 Household Year Electricity price ( c€/kWh) EEG (c€/kWh) 2000 15.26 0.2 2007 19.49 1.02 2014 29.81 6.24 Industry < 2000MWh Year Electricity price ( c€/kWh) EEG (c€/kWh) 2000 7.98 0.2 2007 12.72 1.02 2014 20.71 6.24
In the French electricity system, customers pay a fixed charge for grid connection which is set by the government (subscription fees [28]) depending on the subscribed power. In France, a time-of-use tariff option is currently applied for peak shaving; this is focused on smoothing the seasonal peak rather than the hourly variation (higher tariffs applicable from November to March). There are no taxes on self-consumed electricity in France [6].
The government has an important role in setting electricity rates. France has regulated electricity tariffs; blue tariffs for residential & professional segments (less than 36 kWh of electricity use), yellow tariffs for SMEs consumers (36-240 kWh [29]) and green tariff (more than 240 kWh) for large industrial consumers. Most supermarkets have been offered yellow tariffs by EDF. However, yellow and green tariffs will be abolished at the end of 2015 and blue tariffs will remain until 2025 [30].
These electricity tariffs include energy costs (electricity) and the grid cost for electricity delivery (user fee for the electrical public network known as TURPE3). TURPE represents 90% of ERDF's revenue [31]. TURPE is calculated
taking into account both fixed and variable costs which depend on the subscription type, the options taken, and the consumption profile. On average, yellow-tariff consumers pay a similar amount of TURPE as they do energy costs. There are other segments in the retail electricity rates; different taxes and fees are added to these tariffs [32][33][34][35]:
Contribution to Electricity Public Services (CSPE4) used to offset the charges related to public services such as renewable energy generation, social tariffs and nationwide equalization electricity tariffs. The CSPE for 2015 is set at 0.195€/kWh. In 2013, solar support represented 41% of the CSPE [36].
Tax on Final Electricity Consumption (TCFE5) is a local tax varying on the local policy. The average tax is 2.1% of the total electricity price.
Transmission Tariff Contribution (CTA6) goes towards the national electricity and gas industries fund (CNIEG). The CTA represent 21% of the transmission part of any fixed electricity subscription. The average CTA represents 3.1% of the electricity price.
Value Added Tax (VAT) is set at 20% of the electricity price. In general, yellow-tariff users are free from VAT. This tax is not considered in the study.
The diagrams in Figure 7 show different price breakdowns of the average residential, commercial and industrial electricity rates in France in 2014.
Residential Commercial Industrial
Figure 7: Price breakdowns of the average residential, commercial and industrial electricity rates in France (2014) [35]
In the simulation, we assumed that yellow tariffs were applicable for all the supermarkets and hypermarkets in question. In the supermarket segment, the electricity consumption per square meter (m2) stays relatively constant regardless of the supermarket size. A study gives a mean consumption of around 650 kWh/m2/year for large supermarkets (> 1000m2) and
hypermarkets (> 5000m2) [37]. We assumed that the consumption profile was proportional to the surface area.
There are four different prices in the yellow tariff category: winter (November to March), summer (April to October), off-peak hours (lower price) and peak hours (higher price) for each season. Off-peak hours and peak hours vary depending on the local government policy but peak hours are usually during the day while off-peak hours are during the night (the local differences in terms of peak periods are neglected in this study). The day tariff is applicable from 6 am to 10 pm and supermarkets mainly use the day tariff. The day price during the winter is 0.09522 €/kWh and 0.04990 €/kWh in the summer [38].Therefore, the electricity prices paid by yellow-tariff consumers are shown in Table III (tariffs used for our simulation).
Table III: Electricity tariff paid by yellow-tariff consumers
€/kWh November to March April to October Electricity Tariff 0.0952 0.0499 Electricity production 0.0476 0.02495 TURPE (Network) 0.0476 0.02495 CSPE 0.0195 0.0195 CTA 0.0038 0.0023 TCFE 0.0025 0.0015 Total 0.1210 0.0732
The use of the PV self-consumption model will bring about some changes in electricity tariffs. The changed tariff of each segment is related to stakeholder interests. The Table IV explains the possible impacts on stakeholders. The possible impacts will be further examined later in this article.
Table IV: Possible impacts on stakeholders
Electricity production Impact on the electricity market and revenues of the electricity producers TURPE (Network) Reduced revenues of grid operators (transportation and distribution)
CSPE With less consumed electricity from the grid, the CSPE paid by end-users will increase to maintain the same level. Moreover, the support of PV installation can increase the CSPE.
CTA Electricity industry employees, government
4 French abbreviation for Contribution au Service Public de l’Electricité 5 French abbreviation for Taxe sur la Consommation Finale d'Electricité 6 French abbreviation for Contribution Tarifaire d'Acheminement
TCFE Reduced tax revenues of local government VAT Reduced tax revenues of government
3.2.2. PV electricity production costs
PV power is commonly priced as levelized costs of electricity (LCOE, $/kWh). Solar PV system costs are an important lever when defining the initial investment needed to calculate the levelized costs of PV energy. LCOE will also depend on other factors like module efficiency, capacity factor, cost of capital and lifetime [39]. In order to calculate the LCOE7 of the PV self-consumed model in France, we referred to the following data and assumptions.
o PV system price: 1.9€/W in 2013 using c-Si PV technology8
for large commercial roofs with simplified integration (ISB), which is > 100kWc [40]
o Insolation: Average global standards from 3.12 kWh/m2/day to 4.27kWh/m2/day [6]. Insolation is higher in the
southern regions of France. Insolation in Paris (3.32 kWh/m2/day [41]) was used for modeling in this study, while the location difference was ignored to simplify the simulation. If we had conducted the same study using data from the southern regions, e.g. Nice, the results would have been quite different.
o O&M: 1% of PV system price [42].
o A discount rate of 5% is used to consider the weighted average costs of capital (WACC) for the respective investment [43][44].
o Module efficiency: We assumed 16% of module efficiency using the monocrystalline technology [4]. o 77% of PV system efficiency using electrical conversion hardware [45]
o 20 years of lifetime.
3.2.3. Available surface areas
The data on French supermarket surface areas was taken from the website www.distripedie.com. The total sum of nation-wide supermarkets & hypermarkets were used; as of 2009, France had a total of about 16 million m2 of supermarket (Table V). We assumed that every supermarket was a 1-floor independent building with a flat roof usable for PV installation.
Table V: Data on French supermarket surface areas [46][47]
Total surface area of French hypermarkets
(nation-wide)
Total surface area of French supermarkets
(nation-wide) Hypermarket
(2009)
Number Average area (m2) Total area (m2) E. Leclerc 467 5100 2381700 Carrefour 231 9100 2102100 Auchan 134 10500 1407000 Géant-Casino 120 7400 888000 Hyper-U 61 4900 298900 Cora 59 9600 566400 TOTAL 7644100 Big supermarket (2009)
Number Average area (m2) Total area (m2) Intermarché 1494 1900 2838600 Champion-Carrefour market 987 1830 1806210 U 718 2100 1507800 Atac – Simply 414 1500 621000 Casino 380 1470 558600 Monoprix 276 1800 496800 Match 149 1550 230950 E. Leclerc 115 1800 207000 TOTAL 8266960
3.2.4. Ratio of matching between onsite consumption and PV output
Literatures explain that the ratio of correspondence between onsite consumption and PV output is an important variable in defining the economics of the self-consumption model [4][6][8]. As explained, the residential sector shows a weak correlation between PV output and onsite consumption and only a small share of generated PV power is self-consumed without a storage system (between 30% and 40% [48]). Moreover, the peak demand time for the residential sector is winter in the evening; this gives the worst correlation between PV output and onsite consumption. It does not reduce congestion levels because the generated PV electricity during peak times is often higher than the onsite consumption. This may require further investment on grid reinforcement when aggregated surplus of electricity exceeds the current capacity of the grid infrastructure. On the contrary, the application in supermarkets shaves the peak demand during summer at midday thanks to the possibility of full self-consumption.
Here below, we have attempted to justify the correspondence ratio between electricity consumption and PV output in supermarkets using 2010 data [49]. The simulation attempts to give an approximation of opportunities for PV 7LCOE =∑ Investmentt+O&𝑀t+Fuelt (1+r)t n t=1 ∑n Electricity generationt(1+r)t t=1
8PV technology: In this study, we considered the c-si technology. We assumed that PV modules were installed using horizontal placement and covered
the entire surface available. This is an approximation because space between modules is needed in terms of installation and maintenance. In addition, other installations can exist on roofs. Technological constraints (weights, temperature sensitiveness) were neglected. If weight matters, c-Si modules can be replaced by a thin-film solution with less efficiency (8%-10% efficiency) but cheaper selling price. This solution can be supported by a national innovation policy. The module orientation can be optimized according to the local or seasonal conditions.
consumption. Figure 8 demonstrates the supermarket model containing the consumption profile (winter, summer) and the maximum production curve of PV electricity.
Figure 8: Consumption profile and maximum production curve of PV electricity
Supermarket consumption profile (winter, summer and closing day)
The supermarket consumption profile is based on a study, which shows an analysis of the real consumption profile (every 15 minutes) of a medium-sized supermarket [49]. Data on real consumption profiles in winter and in summer were taken to develop the demand curve. The main sources of energy use in the supermarket sector can be divided as follows:
• Cold storage (negative cold for frozen goods and positive cold for perishable goods) • Lighting (indoor for a large majority)
• Heating in the winter and air-conditioning in the summer.
In winter, the power demand has a linear growth from 5 am to the opening hour (9 am), it stays constant during the opening hours (~160 W/m2) and comes back to the night demand at closure (7 pm). In summer, the power demand has a linear growth from 1 am to midday. The peak demand period is constant between midday and 5 pm9. Then, the demand reduces steadily until the closing hour and comes back to the level of night demand after closure. During days-off and nights, the constant power demand is about 40 W/m2. It is used for negative and positive cold storage [37] which must operate all day constantly without interruption. The level stays constant in both winter and summer.
Theoretical maximum PV production
The theoretical maximum PV production was determined for comparison with the above supermarket consumption (demand) curves. This curve was developed using the European Commission’s Photovoltaic Geographical Information System (PVGIS) [50], based on the assumption of average solar irradiation in June under a clear sky in Paris, weighted by the module’s efficiency (16%) and the system’s efficiency (77% [45]). We assumed that PV modules were installed using horizontal placement and covered the entire surface area available.
From the PV self-consumption model developed, we have found that: - All the PV production can be self-consumed during the opening days
- The PV production peak never exceeds the demand peak and there is no need for grid reinforcement. Therefore, in this study we assumed 100% of the PV production was self-consumed in supermarket sectors without further investment due to grid reinforcement.
3.3. Results: Opportunities with a PV self-consumption model
Opportunities for the PV self-consumed model using supermarket surface areas will be defined in this part. We attempt to calculate the expected installed capacity, PV electric output, impact on the grid (avoided system congestion, contribution to lowering electricity demand peak), and the increased energy independence. In addition, the reduced GHG emissions and economic benefits (job creation, sales, and avoided fossil fuel imports) can be included to define benefits of the PV self-consumed model. However, these results are not quantified in this study even though there are obvious consequences. The profitability of the self-consumed model is compared under scenarios without any support and with the current FIT scheme to define policy support needed to make the model profitable. Possible quantified impacts on stakeholders are then presented with the objective of preparing strategies to mitigate policy risks in search of PV self-consumption growth.
3.3.1. Opportunities of supermarkets/ hypermarket surface areas
The real maximum PV productions in summer and winter, which reflect the real production condition, are modeled as below. We drew the real maximum PV output curve, which produces less electricity than the theoretical curve. When PV power is self-consumed onsite, supermarkets use less electricity from the grid which moves the demand curve down. A new shaped demand curve is expected (see Figure 9) with the following aspects:
- PV production reduces the electricity consumption from the grid, thereby reducing the electricity demand peak - The midday electricity demand peak in supermarkets is shifted to the end of the day (~ 6 pm). The impact is
greater during the summer than in winter and depends on the local configuration; the demand peak is reduced
by around 55 W/m2 in Paris during the summer, therefore putting less pressure on the grid. The peak shaving
result will produce larger positive results in regions or countries with a midday peak in summer (e.g. the US).
Summer Winter
Figure 9: Demand from the grid with and without self-consumption
From this simulation, we were therefore able to conclude that the supermarket sector fits well with PV self-consumed usage model for PV power for the following reasons:
1. Opportunities to utilize the existing large surface areas to install PV modules on the roof.
2. Good correspondence between onsite consumption and produced PV power: almost all power generated can be self-consumed (assumption: when the entire available surface area is used to produce electricity).
3. The new mode will reduce electricity peak demand purchased from the grid with self-consumption of PV power, thereby reducing pressure on the grid.
4. Grid reinforcement is not needed: PV electricity production never exceeds the electricity demand level of supermarkets.
PV installations
We have also found that possible nation-wide PV installations in France could represent 2.56 GWp10 on the condition that all the existing supermarkets in question install the PV systems on their roofs. This accounts for 47% of the total French PV installation of 2015 [51].
Electricity produced & increased energy independence
The PV production per square meter (m2) in Paris is given in Table VI.
Table VI: PV production in Paris [50]
Paris Jan Feb Mar Apr May Jun Jul Aug Sep Oct Nov Dec Total
Monthly irradiation
kWh/m2 27.3 45.1 96.7 137.4 160.9 173.4 176.7 149.1 110.1 65.7 32.4 24.1 PV production
kWh/m2 3.4 5.6 11.9 16.9 19.8 21.4 21.8 18.4 13.6 8.1 4.0 3.0 148
The total annual PV production in Paris is 148 kWh/m2, which is around 23% of supermarket consumption (~650 kWh/m2/year). This means the model contributed to increase the energy independence of supermarkets to 23%. If we consider that production in Paris is representative of the French average production, the total possible production could reach 2.36TWh11 (0.5% of the total French electricity consumption, 447 TWh [52]).
3.3.2. Profitability of the PV self-consumed model: viewpoint of PV system users
In this paper, we aim to define the economic incentives of end-users to adapt the PV self-consumed model. The profitability of the PV self-consumed model is country-specific depending on various factors such as the economics of PV power, electricity tariffs and political decisions. If the PV LCOE is much higher than the electricity price paid by the commercial consumers, there are insufficient economic incentives to install PV self-consumed systems in supermarkets
1016 million m2 x 160 Wp/m2 = 2.56 GWp (47% of the current installations)
unless they generate interesting financial returns on the initial investment through policy support or other revenue creation. It is therefore important to define the break-even point of the proposed model. If it is not economically competitive on its own, policy support can lead PV installation growth using the defined self-consume model.
PV end-user investment and expected revenue
Electricity end-users have economic incentives to install PV systems on the roof when it gives them a sufficient rate of return on their investment. In order to define profitability, it is necessary to know the investment required and the expected revenue stream under the PV self-consumed model.
Investment to install PV systems with operation and maintenance (O&M)
Investment refers to the total costs in terms of PV system installation with operation and maintenance (O&M) during the
lifetime of the PV system. The PV initial investment was estimated at 1.9 €/Wp in 2013 [40] using monocrystalline PV modules with an efficiency of 16%. Based on the standard test conditions to define watt peak12 [53] of 1 kW/m2 of solar irradiance, we concluded that 160Wp was produced by m2 based on a monocrystalline module efficiency of 16%; this means that 6.25 m2 is needed to produce 1 kWp.
Therefore, the initial investment per square meter (m2) is IPV= 1.9 €/Wp x 160 Wp/m2 = 304 €/m2.
The O&M costs, which are usually set at 1% of the investment, should be included. The total cost is discounted during the lifetime of PV system (20 years). The discounted cost of the System CPV is;
𝐶𝑃𝑉= 𝐼𝑃𝑉+ ∑𝑁=1 𝑡𝑜 20𝐼(1+𝑟)𝑃𝑉×1% 𝑁 = 342 €/m2 , with r=5%
For example, for a medium-sized supermarket with 2000 m2, the total investment amounts to €684,000. Expected revenue streams
Revenue concerns avoided electricity bills in the case of self-consumption, sales of PV electricity surplus, sales of green
certificates (if applicable), and potentially, government support.
A. PV electricity production for self-consumption without any policy support
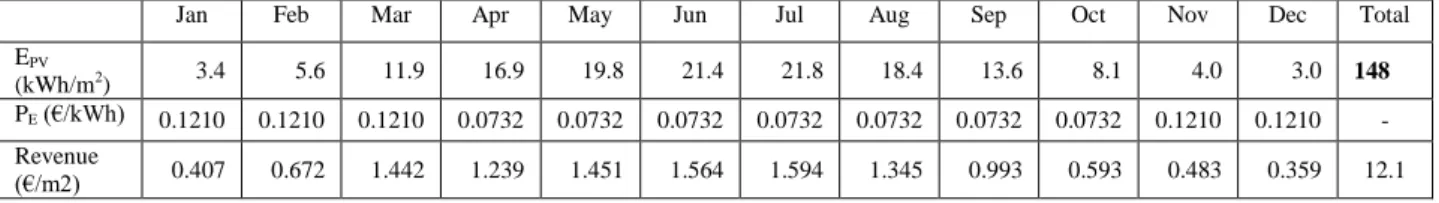
Here we assumed that there was no policy support for the PV self-consumed model; e.g. no installation subsidies, no FIT, no permission for feed-in electricity to the grid. When the entire PV production is self-consumed without such supports, the expected revenue is equal to the retail electricity price avoided based on the PV electricity produced (EPV). The
discounted revenue depends on the retail electricity price (PE) change with time. The electricity price is related to
profitability. Since 2008, the average electricity price excluding taxes has increased by 3.5% every year in France [25]. Assuming the constant EPV every year13, the expected revenue (=EPV x PE) is given in the Table VII.
Table VII: Expected revenue with self-consumption in Paris
Jan Feb Mar Apr May Jun Jul Aug Sep Oct Nov Dec Total
EPV
(kWh/m2) 3.4 5.6 11.9 16.9 19.8 21.4 21.8 18.4 13.6 8.1 4.0 3.0 148
PE (€/kWh) 0.1210 0.1210 0.1210 0.0732 0.0732 0.0732 0.0732 0.0732 0.0732 0.0732 0.1210 0.1210 -
Revenue
(€/m2) 0.407 0.672 1.442 1.239 1.451 1.564 1.594 1.345 0.993 0.593 0.483 0.359 12.1 For example, a 2000 m2 supermarket can save 24,200€ of annual electricity fees by avoiding power purchase from the grid.
With a discount rate of 5% [44], the discounted revenue (RSC) over 20 years was calculated according to the annual
increase in the retail electricity price (a);
𝑅𝑆𝐶= ∑
𝐸𝑃𝑉× 𝑃𝐸 𝑟𝑒𝑡𝑎𝑖𝑙× (1 + 𝑎)𝑁
(1 + 𝑟)𝑁 𝑁=1 𝑡𝑜 20
By comparing the investment required (𝐶𝑃𝑉) and the expected revenue (RSC), we came to the conclusion that the PV
self-consumed model was not economically attractive without policy support (see Table VIII).
Table VIII: Comparison between the investment required and the expected revenue from self-consumption
Segment Investment (€/m2) Revenue
(expected) (€/m2)
Payback period Investment gains/ losses over 20 years (€/m2)
Self-consumption: a=0% 342 151 > 30 years 191
12Watt peak (Wp) refers to the peak power of a PV module or system under standard test conditions (light intensity: 1000 W/m2, temperature: 25 ºC,
and air mass: 1.5)
Self-consumption: a=2% 342 177 > 30 years 165
Self-consumption: a=5% 342 230 > 30 years 112
a: annual increase in retail electricity prices
B. PV electricity production under the current FIT scheme
In this case, 100% of PV electricity produced is fed into the grid with a financial compensation based on the current FIT system. The fixed tariff was set at the beginning of the 20-year long-term contract. The annual constant EPV (=148
kWh/m2) was also considered to calculate the expected revenue (RFIT).The FIT was 0.1727 €/kWh during the first
quarter of 2013 [54] for commercial-sized systems above 36 kWp14. The discounted revenue (RFIT) over 20 years was
calculated with a discount rate of 5% [44].
𝑅𝐹𝐼𝑇= ∑
𝐸𝑃𝑉× 𝐹𝐼𝑇
(1 + 𝑟)𝑁 𝑁=1 𝑡𝑜 20
RFIT = 319 €/m2
The discounted revenue (RFIT) over 20 years proves to be smaller than the required investment (CPV) of €342 per m2. In
this calculation, we used the mean PV system price with uncertainties on the discount rate (r) and the differences in solar irradiance according to the location (see Table IX). The calculation can be considered concise and the results will be different depending on the assumptions and data used. The tariff is not attractive in Paris but is sufficient in the sunniest regions located in the south of France. To make the PV system profitable, the discounted revenue (RFIT) should be at least
equal to the discounted investment required (𝐶𝑃𝑉). The general equation is:
𝐶𝑃𝑉= 𝑅𝐹𝐼𝑇 𝐼𝑃𝑉+ ∑ 𝐼𝑃𝑉× 1% (1 + 𝑟)𝑁 𝑁=1 𝑡𝑜 20 = ∑ 𝐸𝑃𝑉× 𝐹𝐼𝑇 (1 + 𝑟)𝑁 𝑁=1 𝑡𝑜 20
To make the PV system profitable in Paris, the FIT should be at least equal to the LCOE. The investment (𝐶𝑃𝑉) of €342
per m2 with a 5% discount rate needs a minimum support of 0.186 €/kWh15.
Table IX: Impact of the location in France on the profitability of the FIT
Segment Investment (€/m2) Revenue (expected)
(€/m2)
Payback period Investment gains/losses during 20 year (€/m2)
Paris with FIT 342 319 23 years -23
Nice with FIT 342 428 15 years +86
3.3.3. PV supports and results: viewpoint of policy makers
Policy support (𝑆) is needed to make the proposed model profitable. Otherwise, there are no economic incentives to install PV systems for end-users. Here below, we have attempted to formularize the financial support to give economic incentives to end-users to install PV system on their roof for the purpose of self-consumption. This support is decided by the country and can be conducted via different policy instruments, e.g. direct installation subsidies or a long-term contract. 𝑆 =𝐼𝑃𝑉+∑ 𝐼𝑃𝑉× 1% (1 + 𝑟)𝑁 𝑁=1 𝑡𝑜 20 − ∑ 𝐸𝑃𝑉× 𝑃𝐸 𝑟𝑒𝑡𝑎𝑖𝑙 (1 + 𝑟)𝑁 𝑁=1 𝑡𝑜 20
Necessary financial support for PV self-consumption
Policies to promote PV systems should be interpreted in a global perspective. Policymakers have the global targets in terms of PV installation, PV electricity production, the share of renewable energies in the electricity production mix, GHG emission reduction, and related economics objectives like job creation.
France has the PV installation target of 5400 GWp by 2020; this target was actually reached at the end of 2014 [51]. However, the new law on the energy transition is currently under discussion; this new law aims to increase the part of renewable energies in the final gross energy consumption to 23% by 2020 and 32% by 2030 (cf. 14% in 2013 [55]) and in the electricity production to 40% by 2030 [56] (cf. 19% in 2014). The objective of this new law is to improve financing for renewable energies and to create jobs. PV power can be an interesting levier to reach these objectives because the PV sector becomes more competitive and has potential to improve its economic competitiveness. In addition, PV has better social feasibility compared with wind power [57]. In this context, it is interesting for the government to review the opportunities offered by the PV self-consumed model to meet the target of increasing renewable energies in the electricity system.
14The support is limited to the installation lower than 100kWc. In this study, we ignore this limitation and apply the given tariff of 0.1727€/kWh for all
the size.
The Table X explains possible benefits and the minimum financial support needed to apply the proposed model. Supermarket surface areas in France represent significant opportunities for PV installation, as well as PV power production. If France were to use all its supermarket surface areas (16 million m2)16, it could add an extra PV installed capacity of 2.56 GWp, which accounts for around 47% of the current cumulative installation in France. This provides an annual electricity production of 2.36 TWh. Furthermore, the produced PV power in supermarkets could be consumed 100% onsite thanks to the good correspondence between PV output and the power consumption profile. Consequently, the self-PV consumed model could help reduce the midday peak of supermarkets using self-consumption.
Table X: Expected benefits of the PV self-consumed model and policy support [39]
Energy transition Possible installations: 16 million m2 x 160 Wp/m2 = 2.56 GWp (47% of the current installations)
Electricity production: 16 million m2 x 148 kWh/m2/year = 2.36 TWh/year (0.5% of the total electricity
consumption of 447 TWh (Eurostat)) Land usage 16 million m2 available without new land use
Local grid pressure reduction
no grid reinforcement needed and T&D losses avoided
Depends on local configuration, the summer peak is reduced by about 55 W multiplied by the supermarket surface area
Economic Benefits Job creation, exports, domestic sales Reduced fuel costs (e.g. imported oil or coal)
CO2 emission avoided GHG emission reduction: little impact with the large part of nuclear power in France
Policy costs under self-consumption Policy costs under FIT scheme
Annual policy costs of the support € 215 million17 2.36 TWh x 0.1727 €/kWh = €408 million Discounted policy costs of the support over
20 years 16 million m2 x 165 €/ m2 = €2.6 billion (a=2%) 16 million m2 x 319 €/m2 = €5.1 billion
We have found that PV electricity production using the self-consumption model seems more interesting compared with the FIT system. Under these two different configurations, PV electricity under the self-consumed model offers more benefits in terms of reducing the summer demand peak. In addition, it generates fewer policy costs.
3.3.4. Impact on other stakeholders
The government’s policy strategy is directly related to the success of the PV self-consumed model. Other stakeholders, particularly the latent group, can threaten the policy decision on the PV self-consumed model if the new usage mode of PV electricity conflicts with their interests. The proposed model reduces the purchased electricity from the grid, influencing the profits of energy market players, e.g. utility generators and grid operators. In addition, as more people install PV systems for self-consumption to pay lower electricity bills, other end-users who continue to use electricity from the grid will pay increased electricity rates to cover CSPE and the fixed costs of grid investment [4][6][8]. If the government aims to promote the PV self-consumed model to take advantages of the model, the preparation of policy threats from stakeholders is an essential step. Therefore, policy makers should examine the expected impact on other stakeholders’ interests to mitigate policy risk and to avoid any interruption. Below, the possible impacts are quantified to capture policy risks.
Impact on stakeholders’ interests under the FIT scheme
By using the FIT scheme, PV producers continue to pay all taxes and fees. However, with the penetration of PV electricity production, the existing power generators will sell less electricity in the market (the average wholesale market price was 0.0443 €/kWh in 2014), thus leading to reduced sales revenue for other power generators. Moreover, the financing of the FIT is supported by the CSPE from the electricity rates. Possible impacts on stakeholder interests are calculated Table XI. This means €408 million is paid to support the PV installation of 2.56 GW.
Table XI: Impact on stakeholder interests of the FIT scheme
FIT policy Stakeholder Amounts by m2 of installation (annual) Nation-wide amount (annual)
Conventional electricity production decrease
Utility generators €6.55/m2 €105 million
Sub-total 6.55 €/m2 €105 million
FIT financing (CSPE) End-users of electricity €25.56/m2 €408 million
Total 32 €/m2 €512 million
Impact on stakeholder interests under the self-consumption model
In case of self-consumption, the produced PV power is consumed onsite and the surplus can be fed into the grid. The impact on stakeholder interests can be roughly calculated by reviewing changes in electricity bills with the penetration of
16 The solar irradiation in Paris has been used to represent the average solar irradiation conditions in France. 17 Assumption: LCOE= 0.1727€/kWh
the self-consumption model. The losses can be calculated by multiplying the electricity tariff for each segment by the electricity avoided from the grid:
EPV (kWh/m2) x the part of electricity tariff (P stakeholder) (€/kWh) = Revenue losses stakeholder (€/m2)
The Table XII captures the expected impact on each stakeholder. Due to reduced purchasing from the grid, end-users who own PV systems use less electricity from the grid. The existing power plants and grid operators will earn less revenue. In addition, end-users will pay more for the CSPE. The government will have less tax revenue. In this study, the government’s reduced tax revenue from VAT is excluded: French supermarkets do not pay VAT. However, this impact is notable in the residential sector with 20% of VAT. Further financial support is needed to achieve the PV self-consumed model.
Table XII: Impact on stakeholder interests of the self-consumption scheme
Self-consumption Stakeholder Amounts by m2 of installation (annual) Nation-wide amount (annual)
Conventional electricity production decrease
Utility generators 4.31 €/m2 €69 million
TURPE (network) Distribution 4.31 €/m2 €69 million
CSPE End-users of electricity 2.88 €/m2 €46 million
CTA Retired electricity employees /
Government
0.38 €/m2 €6.0 million
TCFE Local government 0.26 €/m2 €4.1 million
Sub-total 12.14 €/m2 €194 million
Self-consumption support 13.4 €/m2 €214 million
Total 25.54 €/m2 €408 million
Based on the above calculations, we have found that the same level of cost exists under the FIT system and the self-consumption model to make the PV system profitable. However, there are important differences.
Firstly, under the FIT system, PV electricity is supported by fixed tariffs based on long-term contracts and this is directly financed by CSPE, placing the burden mainly on end-users. We have seen the rapid increase in electricity retail tariffs in France and Germany mostly due to the contribution of CSPE and EEG respectively. The financial support to the energy transition has increased retail prices and there are now issues about energy poverty and industrial competitiveness. However, the PV self-consumption model with its good correspondence ratio requires less direct financial support and electricity bill savings make up the profitability of the model.
Secondly, the FIT scheme has larger potential losses than the PV self-consumption model; the total sum adds the policy supports for purchased PV electricity and potential revenue losses of exiting utility generators with the increase of PV power production in the energy market. In the second calculation, we can find that the potential revenue losses are widespread among stakeholders as more PV power is consumed onsite. An interesting point is that such impacts on stakeholders are quite similar to the results of reduced electricity loads from an energy efficiency policy, which has priority in the EU energy policy [6].
In addition, under the FIT system, PV system installers do not have economic incentives that match their real consumption profile; instead, there can be a windfall effect for profit-seeking. Uncontrolled installations require further policy support, leading to an increase in the CSPE. However, a well-designed policy framework can incite people to maximize onsite self-consumption, thus avoiding such windfall effects. This will lessen the burden of the CSPE.
Lastly, under the self-consumption model, we gain a clearer overview of the impact on stakeholders with the penetration of PV electricity. This clear overview allows the government to approach policy design and implementation in a shrewd manner to address potential policy risks factors.
A possible negative impact on the revenue stream of other stakeholders could be counterbalanced by the benefits that the PV self-consumed model creates. As said, good utilization of the self-consumption solution reduces the burden on end-users with a lower CSPE increase. In addition, the PV self-consumed model cuts the peak demand level; the midday peak shifts to an end-day peak around 55 W/m2 lower, thereby reducing grid pressure. A lower participation in the grid infrastructure (TURPE) is somehow partially justified. Furthermore, even though the PV self-consumed model affects the interests of stakeholders, it also brings about a positive impact for society. The PV self-consumed model can bring environmental, economic and energy mix benefits. PV is worth investigating to meet the national target of renewable energy growth in the future energy mix. All populations - including stakeholders - will benefit. For example, more eco-friendly living conditions will be available to populations through the large penetration of PV installation in the energy mix. In addition, the PV self-consumed model stimulates economic growth in terms of job creation, development of the PV industry and associated industries. Increasing energy diversification and independence improves the national energy security.
4. Policy recommendation
This paper analyzes the benefits and issues of the PV self-consumed model. The new mode of power consumption requires additional costs 1) to change the general organization needed to penetrate the energy mix, and 2) to avoid
provoking impacts on other stakeholders. It is important to define strategies to stimulate the PV self-consumed model. In addition, such strategies should help drum up the participation of other stakeholders. Here, we have attempted to define possible strategies to help develop the proposed PV self-consumed model. Figure 10 explains possible promotional policies with different strategy directions.
Figure 10: Possible promotional policies with different strategy directions
1. Establishing long-term policy vision of PV self-consumption (long-term promotion policy plan)
The national policy strategy - whether to encourage or prevent the use of such a model - will determine the level of promotion of the PV self-consumed model in the energy mix. The organizational changes are taking place under the new regulatory system to introduce new business practices and grid models. When the political strategy aims to promote self-consumption of PV power putting stress on benefits, policy support should be deployed to give incentives to install PV systems for self-consumption. This policy support should present a long-term vision to secure stable growth.
Appropriate remuneration schemes should be prepared to encourage the self-consumption of decentralized PV
electricity generation when the self-consumed model is not yet competitive on its own [8]. The proposed opportunities of PV growth using the existing supermarket surface areas can be gained via long-term policy support: e.g., solar
commercial building mandates can be one solution with proper compensation that covers PV installation investment. 2. Giving priority to PV installation with the best corresponding profile between onsite demand and production
We have seen that the self-consumed PV system can maximize benefits with the best correspondence between onsite demand and production, encouraging better returns on investment than in poorly corresponding areas.
First, policy should promote targeted areas with the best correlation between onsite consumption and PV production peak like supermarkets. In addition, local PV production should be consumed locally to increase the self-consumption ratio on a local level. The PV self-consumed model may provide a good solution for congested regions or areas with grid problems.
3. Increasing the correspondence profile between onsite demand patterns and production
Sectors with poorer correlation can be promoted in line with the demand-side policy to obtain optimal correspondence between PV power production and PV self-consumption [8]. The results will smooth the PV injection peak during the PV generation peak, thereby reducing the impact on the exiting power grid system. A smart grid may provide a dynamic policy instrument to improve correspondence between PV prosumer demand profiles and the production pattern, based on a more responsive grid system. Smart grids are designed to better control load managements by improving the transparency of the electricity market. Improving the storage solution is a good way to improving the correspondence of the supply-demand balance for the PV self-consumed model. PV self-consumption with storage increases the flexibility of PV systems by shifting the electricity demand load to non-peak times of PV production. However, the issue is to improve the economic competitiveness of such storage systems.
4. Allowing connection to the grid with a proper compensation scheme
The permission to connect to the electricity network is needed to secure the reliability of PV systems. The rules and regulations regarding grid connection will play a key variable in the economics of the model affecting prosumer decisions for usage [6]. In the long term, the PV self-consumed model can be developed by disconnecting from the grid when the storage system becomes economically viable for users. However, before this happens, the PV self-consumed model needs policy support which allows for grid connection with proper economic compensation. The compensation level, type and amount will vary according to the country’s policy decisions.
Historically, the FIT system allows PV power generators to feed all electricity generated into the grid by providing long-term fixed-tariff compensation, which is usually set at higher level than the retail rate. However, the compensation level of the current FIT system differs from country to country; for example, the German FIT rate for residential producers (EUR 0.131/kWh in May 2014) is lower than average retail rate of electricity (~0.29 €/kWh in 2014) [6].
Countries compensate for excessive generation depending on the country’s position of instantaneous self-consumption.

![Figure 5: Stakeholders in the value chain for the energy market [21][22]](https://thumb-eu.123doks.com/thumbv2/123doknet/12907852.372111/5.892.77.710.366.537/figure-stakeholders-value-chain-energy-market.webp)

![Table II: Electricity Prices in France and Germany [25][26][27]](https://thumb-eu.123doks.com/thumbv2/123doknet/12907852.372111/7.892.84.724.715.915/table-ii-electricity-prices-france-germany.webp)
![Figure 7: Price breakdowns of the average residential, commercial and industrial electricity rates in France (2014) [35]](https://thumb-eu.123doks.com/thumbv2/123doknet/12907852.372111/8.892.129.769.361.516/figure-breakdowns-average-residential-commercial-industrial-electricity-france.webp)


![Table X: Expected benefits of the PV self-consumed model and policy support [39]](https://thumb-eu.123doks.com/thumbv2/123doknet/12907852.372111/14.892.74.810.243.471/table-expected-benefits-self-consumed-model-policy-support.webp)

