HAL Id: hal-03126894
https://hal.archives-ouvertes.fr/hal-03126894
Submitted on 1 Feb 2021
HAL is a multi-disciplinary open access
archive for the deposit and dissemination of
sci-entific research documents, whether they are
pub-lished or not. The documents may come from
teaching and research institutions in France or
abroad, or from public or private research centers.
L’archive ouverte pluridisciplinaire HAL, est
destinée au dépôt et à la diffusion de documents
scientifiques de niveau recherche, publiés ou non,
émanant des établissements d’enseignement et de
recherche français ou étrangers, des laboratoires
publics ou privés.
Integrating paleoecology and phylogeography reveals
congruent bioclimatic regions in the Brazilian Atlantic
forest
Marie-Pierre Ledru, A. C. Carnaval, C. Y. Miyaki
To cite this version:
Marie-Pierre Ledru, A. C. Carnaval, C. Y. Miyaki. Integrating paleoecology and phylogeography
reveals congruent bioclimatic regions in the Brazilian Atlantic forest. Past Global Changes
Maga-zine, Past Global Changes (PAGES) project, 2017, 25 (2), pp.92-93. �10.22498/pages.25.2.92�.
�hal-03126894�
PAGES MAGAZINE ∙ VOLUME 25 ∙ NO 2 ∙ AUGUst 2017 CC-BY
92
SCIENCE HIGHLIGHTS: SuStaining Earth'S BiodivErSity
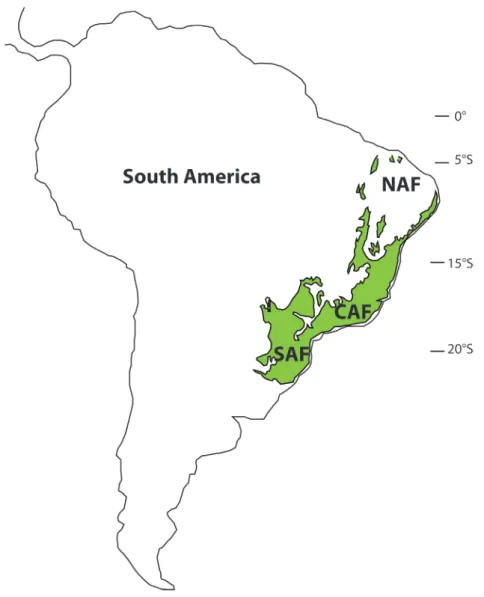
the Atlantic forest is the second most biodi-verse domain in Central and south America after the Amazonian rainforest. Its distribu-tion today has been strongly reduced to less than 16% of its original cover because of intensive deforestation. the Atlantic forest covers a large region along Brazil’s 4000 km coast, from the Equator to 30°s (Fig. 1), and consequently is subject to a wide range of
climatic conditions. these geographical characteristics, combined with a wide alti-tudinal range, resulted in one of the highest degrees of species richness and rates of endemism on the planet (Joly et al. 2014).
Three paleoclimatic regions
Modern regional climatic behaviors and past forest expansion and regression phases
revealed by fossil pollen records (Ledru et al. 2016) define three main areas within the Atlantic forest: North Atlantic Forest (NAF) between 5° and 15°s, Central Atlantic Forest (CAF) between 15° and 23°s and south Atlantic Forest (sAF) from 23° to 30°s. NAF has a moist, cool, semi-deciduous forest restricted to coastal zones, lowland gallery forest and mountaintops. An evergreen forest was well developed during the late glacial instead of a deciduous forest (Fig. 2). CAF is composed of coastal forest patches of mainly dense evergreen forest, whereas more inland areas are occupied by semi-deciduous forests. the evolution of the CAF shows several phases of expansion and regression during the past 17 ka, which are linked to the precession cycle of the insola-tion (Ledru et al. 2009). sAF hosts Araucaria or mixed evergreen forest characterized by the presence of species adapted to cooler and wetter climates. the sAF expanded into the central region replacing the semi-deciduous forest during the late glacial, and since 3 ka is progressively expanding to the south (Fig. 2). this observation is in agree-ment with model predictions (salazar et al. 2007). two fossil pollen records from an interior northern site (Caço Lake, currently not forested) and from the central region (Colônia, currently forested) indicate that the expansion of the Atlantic forest cover was out-of-phase between these two regions - the northern site witnessed forest expansion from 17 ka to the beginning of the Holocene, while the central forest cover retracted (Ledru et al. 2016). Additional paleoecologi-cal datasets likewise indicate considerable expansion of the (nowadays small-ranged) northern forests during the deglaciation (17 to 12 ka; Wang et al. 2004).
Genetic diversity
Comparative phylogeographic data from plants and animals provide a direct link between asynchronous Late Quaternary climatic shifts, the historical demography of forest-depended species, and genetic diversity patterns we observe today. If animal populations in the south have been tracking the Atlantic forest expansion in the late Holocene, then signatures of
The integration of paleoecological studies and genetic data from various Brazilian Atlantic forest organisms reveals
three main regions of contemporary spatial distribution of genetic diversity related to late Quaternary shifts in
monsoon activity.
integrating paleoecology and phylogeography
reveals congruent bioclimatic regions
in the Brazilian atlantic forest
Marie-Pierre Ledru
1, A.C. Carnaval
2, C.Y. Miyaki
3and “AF Biota” project participants
4https://doi.org/10.22498/pages.25.2.92
Figure 1: Map showing the modern distribution of the Brazilian Atlantic forest with three main regions. NAF:
PAGES MAGAZINE ∙ VOLUME 25 ∙ NO 2 ∙ AUGUst 2017
CC-BY
93
SCIENCE HIGHLIGHTS: SuStaining Earth'S BiodivErSity
population expansion should be detected in DNA sequence data from multiple species. For instance, when a population becomes isolated, the succession of the generations within this population will generate new DNA imprints that will differ from the DNA imprints of the remote populations. On the other hand, populations restricted to north-ern, inland, highland sites must have been exposed to forest contraction over the same period and hence show genetic evidence of strong population bottlenecks that will reduce the diversity. NAF coastal popula-tions, presumably exposed to permanently humid conditions throughout the last 21 ka (Carnaval and Moritz 2008; Carnaval et al. 2009), are expected to show high levels of genetic diversity due to climatic stability. Genetic data from coastal populations in the sAF confirm this hypothesis and show much lower levels of genetic diversity relative to NAF coastal populations, tied to genetic signatures of expansion and colonization that date post LGM. this pattern is detected in a vast array of forest taxa, including frogs, lizards, birds, bats, and plants (e.g. Cabanne et al. 2008; Carnaval et al. 2009; Fitzpatrick et al. 2009; Martins et al 2009; Ribeiro et al. 2010; Fig. 2). Post-3 ka colonization of the sAF is also seen in frogs and plants (Ramos et al. 2009; Carnaval et al. 2009). In turn, lineages restricted to mountaintop Holocene forest refugia in inland northeastern Brazil are narrowly endemic and show signatures of recent bottlenecks, presenting low levels of diversity (e.g. Ramos et al. 2009).
Climatic and diversity barriers
these asynchronous patterns of forest movements over the last 17 ka were tracked by various forest organisms, and largely determined contemporary spatial patterns of genetic diversity. shift in monsoon activ-ity, from north to south and south to north, driven by the precession cycles, led to sig-nificant differences in precipitation patterns (Cruz et al. 2005) and, thus, in the tempo and mode of rainforest contraction and expan-sion in lowland and mid-altitude tropical areas. this mechanism must have triggered strikingly different demographic trajectories between northern, central and southern spe-cies pools within forests distributed among this gradient. such tracking of forested envi-ronments by whole tropical assemblages or species pools should largely explain contem-porary patterns of genetic diversity in these tropical regions. In the Brazilian Atlantic forest, proposed forest refugia and areas of high genetic diversity and endemism match areas within the sea-saw monsoonal sector that were permanently moist over the last 17 ka. the three bioclimatic regions evidenced by phylogeography are located in the three paleoecological and paleoclimatic regions revealed by pollen records and related to past fluctuant monsoon activity at these latitudes.
the use of plant fossil information and genetic data from forest species to illustrate past climatic shifts and their associated re-sponses from the fauna and flora of eastern south America question the timescale and pace of diversification, the role of refugia in
tropical forest dynamics and the species-level tolerances to climate change. AFFILIAtIONs
1Institut de Recherche pour le Développement (UMR
IsEM), University of Montpellier, France
2Department of Biology, City University of New York,
UsA
3Departamento de Genética e Biologia Evolutiva,
Universidade de são Paulo, Brazil
4Project “AF Biota” FAPEsP (BIOtA 2013/50297-0), NsF
(DEB 1343578) and NAsA
CONtACt
Marie-Pierre Ledru: Marie-Pierre.Ledru@ird.fr
REFERENCEs
Cabanne sG et al. (2008) Mol Phylogenet Evol 49: 760-773
Carnaval AC, Moritz C (2008) J Biogeogr 35: 1187-1201
Carnaval C et al. (2009) science 323: 785-789 Cruz et al. (2005) Nature 434: 64-66
Fitzpatrick sW et al. (2009) Mol Ecol 18: 2877-2896 Joly C et al. (2014) New Phytol 204: 459-473 Ledru M-P et al. (2009) Palaeogeogr Palaeoclimatol
Palaeoecol 271: 140-152
Ledru M-P et al. (2006) Quat sci Rev 25: 1110-1126 Ledru M-P et al. (2016) Biotropica 48: 159-169 Martins FM et al. (2009) BMC Evol Biol 9: 294 Ramos ACs et al. (2009) J Heredity 100: 206-216 Ribeiro RA et al. (2010) Heredity 106: 46-57 salazar LF et al. (2007) Geophys Res Let 34: L09708 Wang et al. (2004) Nature 432: 740-743
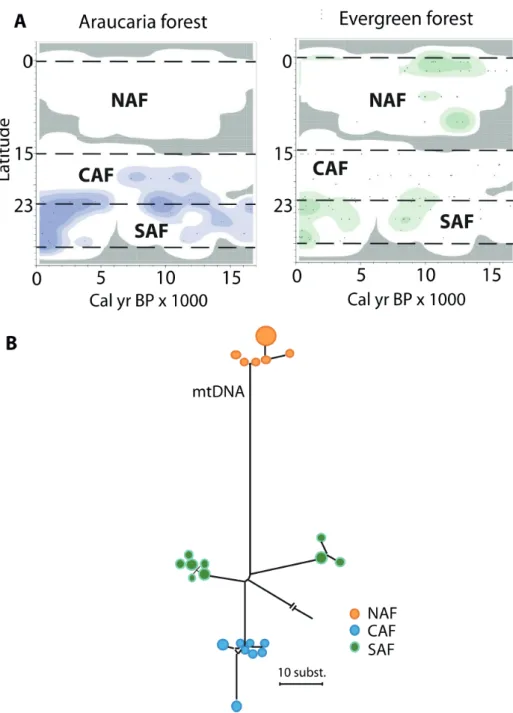
Figure 2: Paleoecology and biodiversity in the Brazilian Atlantic forest with: (A) Changes in the spatial
distribution of groups of pollen taxa from Araucaria and evergreen forests as a function of time and latitude (modified from Ledru et al. 2016). Darker colors represent higher pollen concentrations. (B) Network showing relationships among mitochondrial DNA sequences of a bird species (modified from Cabanne et al. 2008). Each circle represents a sequence and their sizes are proportional to their frequency in the sample, the length of the lines represents the number of differences, and colors represent main areas (NAF, CAF and sAF). Note that two subgroups were distinguished within the sAF, but factors other than the monsoon shifts may have caused this separation.