HAL Id: hal-03014633
https://hal.inrae.fr/hal-03014633
Submitted on 19 Nov 2020
HAL is a multi-disciplinary open access
archive for the deposit and dissemination of
sci-entific research documents, whether they are
pub-lished or not. The documents may come from
teaching and research institutions in France or
abroad, or from public or private research centers.
L’archive ouverte pluridisciplinaire HAL, est
destinée au dépôt et à la diffusion de documents
scientifiques de niveau recherche, publiés ou non,
émanant des établissements d’enseignement et de
recherche français ou étrangers, des laboratoires
publics ou privés.
Isolation and characterization of microsatellite markers
for the threatened African endemic tree species
Pterocarpus erinaceus Poir.
Benziwa Nathalie Johnson, Marie Luce Akossiwoa Quashie, Gilles Chaix,
Letizia Camus-kulandaivelu, Kossi Adjonou, Kossi Novinyo Segla, Adzo Dzifa
Kokutse, Christine Ouinsavi, Babou André Bationo, Habou Rabiou, et al.
To cite this version:
Benziwa Nathalie Johnson, Marie Luce Akossiwoa Quashie, Gilles Chaix, Letizia Camus-kulandaivelu,
Kossi Adjonou, et al.. Isolation and characterization of microsatellite markers for the threatened
African endemic tree species Pterocarpus erinaceus Poir.. Ecology and Evolution, Wiley Open Access,
2020, �10.1002/ece3.6944�. �hal-03014633�
Ecology and Evolution. 2020;00:1–9. www.ecolevol.org | 1 Received: 30 April 2020
|
Revised: 5 October 2020|
Accepted: 9 October 2020DOI: 10.1002/ece3.6944
O R I G I N A L R E S E A R C H
Isolation and characterization of microsatellite markers for the
threatened African endemic tree species Pterocarpus erinaceus
Poir.
Benziwa Nathalie Johnson
1| Marie Luce Akossiwoa Quashie
1| Gilles Chaix
2,3|
Letizia Camus-Kulandaivelu
2,3| Kossi Adjonou
1| Kossi Novinyo Segla
1| Adzo
Dzifa Kokutse
1| Christine Ouinsavi
4| Babou André Bationo
5|
Habou Rabiou
6| Kouami Kokou
1| Hélène Vignes
2,3This is an open access article under the terms of the Creative Commons Attribution License, which permits use, distribution and reproduction in any medium, provided the original work is properly cited.
© 2020 The Authors. Ecology and Evolution published by John Wiley & Sons Ltd 1Laboratoire de Recherche Forestière (LRF),
Université de Lomé, Lomé, Togo 2CIRAD, UMR AGAP, Montpellier, France 3AGAP, Univ Montpellier, CIRAD, INRAe, Institut Agro, Montpellier, France 4Laboratoire d'Etudes et de Recherches Forestières, Faculté d'Agronomie, Université de Parakou, Parakou, Bénin
5Institut de l'environnement et de recherches agricoles (INERA), Burkina Faso 6Faculté des Sciences Agronomiques (FSA), Université de Diffa, Diffa, Niger
Correspondence
Benziwa Nathalie Johnson, Laboratoire de Recherche Forestière (LRF), Université de Lomé, 01BP 1515, Lomé, Togo.
Email: benziwa.johnson@gmail.com Funding InformationThis research was financially supported by Sud Expert Plantes Développement Durable (SEP2D) program [AAP1-45], Agence Universitaire de la Francophonie (AUF) [DRAO-1448-2019-02], Programme d'Appui à la Lutte contre le Changement Climatique: PALCC –AMCC+ [DCI-ENV/2016/39289 Devis programme multi-annuel n°DCI-ENV-2017/387-416], Service de Coopération et d'Action Culturelle (SCAC) and Campus France, CIRAD for the “Actions Incitatives-Soutien aux doctorants” Program, and genotyping platform of Agap unit managed by Pierre Mournet.
Abstract
To study the genetic diversity and structure of the forest species Pterocarpus
erina-ceus Poir., seventeen polymorphic nuclear microsatellite markers were isolated and
characterized, using next-generation sequencing. Three hundred and sixty-five (365) individuals were analyzed within fifteen (15) West African populations. The number of alleles for these loci varied from 4 to 30, and the heterozygosity varied from 0.23 to 0.82. The seventeen (17) primers designed here will allow characterizing the ge-netic diversity of this threaten species on its natural stands and to better understand the population differentiation mechanisms shaping it.
K E Y W O R D S
African tree species, genetic diversity, next-generation sequencing (NGS), nuclear microsatellites, Pterocarpus erinaceus
2
|
JOHNSON etal.1 | INTRODUCTION
Pterocarpus erinaceus Poir. (Lamarck & Poiret, 1823) is commonly
known as African rosewood. This important tree belonging to the Fabaceae family is native from the Guinean forest–savannah mo-saic ecoregion and has been reported from Senegal to Cameroon (Adjonou et al., 2019; Arbonnier, 2004; Giffard, 1974). Stands of this Leguminous species are especially targeted for timber and wood fuelwood production, but this species has also several medicinal uses (Fontodji et al., 2011; Kokou et al., 2009; Segla et al., 2015). Recent scientific investigations on P. erinaceus inter-national trade have highlighted a considerable increase in export volume of its wood from West Africa countries for Asia, partic-ularly China (Dumenu, 2019; Lawson, 2015). As a consequence of its overexploitation, the Convention on International Trade in Endangered Species of Wild Fauna and Flora classified the species as threatened (CITES, 2016) and it has become the focus of con-servation concern in African countries. Because of its high-quality wood, but also as a drought and fire-resistant plant species with traditional medicine uses in sub Saharan Africa (Duvall, 2008; Karou et al., 2003; Ouedraogo et al., 2012), P. erinaceus is a good model species for the study of genetic diversity in Pterocarpus genus.
Understanding the dynamics of P. erinaceus populations’ evo-lution in West Africa in order to establish appropriate and effi-cient production and conservation strategies requires the study of its genetic diversity and structure on its natural stands. Among various molecular tools used to assess plant genetic diversity, mi-crosatellite simple sequence repeats (SSR) markers are the most widely employed because they are codominant and possess high levels of polymorphism and stability (De et al., 2017; Morgante & Olivieri, 1993).
So far, only few studies have addressed the question of genetic diversity and population structure with the Pterocarpus pantropical genus. Muller et al. (2006) have developed a set of eight (8) micro-satellite markers for Pterocarpus officinalis Jacq., an important tree species of the Caribbean wetland forest. More recently, in order to facilitate population identification and biodiversity protection, Hong et al. (2020) have sequenced and analyzed the whole chloroplast ge-nomes of five Pterocarpus species: P. macrocarpus, P. santalinus, P.
indicus, P. pedatus, and P. marsupium. This study has also led to the
description of chloroplastic SSR. The present study describes a new SSR set designed for P. erinaceus and its use to describe the genetic diversity of three hundred and sixty-five (365) individual trees orig-inating from West Africa. Owing to the laborious and expensive microsatellites development by conventional methods (Oliveira et al., 2006; Pimentel et al., 2018), we chose to use next-generation sequencing (NGS) technologies. The major advantage of this ap-proach is the identification of a large number of SSR allowed by the production an important volume of sequence data (Rico et al., 2013; Senan et al., 2014; Vieira et al., 2016).
2 | MATERIAL AND METHODS
We sampled nine to thirty adult trees in 15 populations (Table 1) with a total of 365 trees in four countries of West Africa which are Benin, Burkina Faso, Niger, and Togo (Figure 1).
Freshly collected leaves were dried in a coffee filter containing 10 g Silica gel. Each filter containing sample was put in a plastic zip bag for transport to the laboratory. Our genomic library was con-structed using DNA of P. erinaceus samples from twelve randomly selected individuals among populations (Table 1).
2.1 | DNA extraction
Total genomic DNA extraction was performed with a solution of alkyltrimethylammonium bromide (MATAB) using twenty milligrams of dried leaves from each tree sample. Extraction protocol used de-rived from Bousquet et al. (1990) methodology.
The quality of the genomic extracted DNA was controlled on a 1% agarose gel, and quantification was done by Hoechst assay using fluoroskan (Fluoroskan™ Microplate Fluorometer).
2.2 | Cross-amplification test of P. officinalis
microsatellites markers on P. erinaceus
Cross-amplification tests using the SSR developed by Muller et al. (2006) on P. officinalis were performed using P. erinaceus in-dividuals from different sampling sites except for Tamou reserve (Niger). Loci were amplified by PCR in a 96-well plate using 10-μL volume reaction containing 20 ng of DNA, 1X reaction buffer B (Mg2+ free; 0.8 M Tris–HCl, 0.2 M (NH
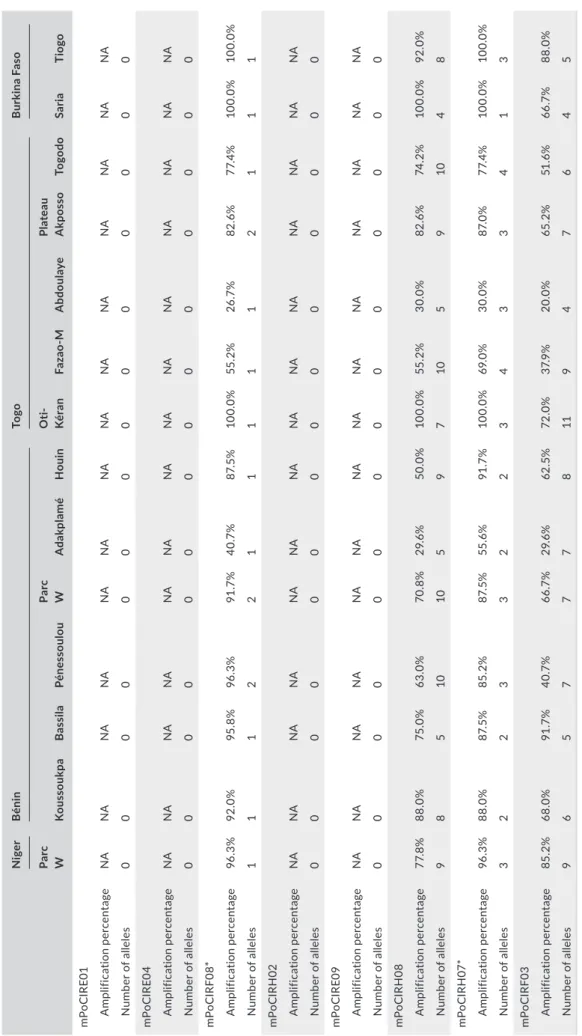
4)2SO4, 0.2% w/v Tween-20; Solis BioDyne), 0.08 μM of the M13-labeled primer, 0.1 μM of each primer forward fluorescent (FAM, NED, PET, and VIC) and the primer reverse, 0.1 μM of M13 fluorescent primer, 2 mM of MgCl2, 200 μM dNTPs, 0.4X Q-solution (Facilitates amplification of GC-rich templates; Qiagen®), 0.04 mg/ml of BSA solution (Bovine Serum Albumine; Qiagen®), and 0.06 U/µL of Taq DNA polymerase. PCR running conditions were as follows: initial denaturation at 94°C for 4 min followed by 36 cycles each at 92°C in 30 s, 1 min at 52°C, 45 s at 72°C, and with a final extension step at 72°C for 5 min. Electropherograms were analyzed, and allele sizes were determined using GeneMapper® software version 4.1 using GeneScan 600 LIZ as a size standard (Applied Biosystems). Four out of the eight primers failed to amplify the target loci (mPoCIRE01, mPoCIRE04, mPoCIRH02, and mPoCIRE09), and two showed little polymorphism (Table 2).
These eight loci were considered noninformative and showed insufficient variability to be used for genetic studies of P. erinaceus.
2.3 | Construction of the DNA library and validation
The Westburg NGS DNA Library PrepKit was used to prepare the DNA library with a pooled DNA extract from twelve samples. The library was built following the manufacturer instructions. Using this kit, enzymatic fragmentation allows for obtaining DNA fragment sizes from 200 to 600 bp (suggested by the manufacturer) depend-ing on the reaction time and the amount of DNA input. DNA was fragmented in an Eppendorf Mastercycler® nexus using 35 µl vol-ume of pooled DNA (1µg) to which 5 µl of ER/A-tailing buffer (10X) and 10 µl of ER/A-tailing enzyme mix (5X) were added. The frag-mentation program used in the thermocycler included a first step of precooling at 4°C for 5 min followed by the second step of fragmen-tation with three fragmenfragmen-tation times, 1 min at 4°C, 10 min at 32°C, and 30 min at 65°C.The sample was then ligated with Illumina adapters. The rec-ommended Illumina indexes in addition to the Westburg kit come from the following reference: TruSeq RNA Single Indexes Set A 12 Indexes (ref 20,020,492). Ligation reaction was performed in a PCR tube containing 45µl of fragmented DNA to which was added suc-cessively 20 µl of ligation buffer (5X), 10µl of DNA ligase, 10 µl of water, and 2.5µl of DNA illumina adapter. Incubation of the ligation reaction was performed at 20°C for 15 min.
Purification on magnetic beads (Agencourt AMPure XP beads -A63881-, Beckman Coulter) was performed before and after PCR. The amplification conditions included initial denaturation at 98°C for
2 min, followed by 7 cycles of 98°C for 20 s, annealing at 60°C for 35 s, elongation at 72°C for 30 s, and a final 1 min elongation step at 72°C.
The quality of DNA library was controlled using an Agilent 4,200 TapeStation with a screen tape D5000, and the fragments sized be-tween 100 and 600 pb mainly, with an average of 260 bp. The DNA library (fragments) was quantified using the Takara kit (638,324) on a qPCR machine (LightCycler® 480 Real-Time PCR System, Roche Life Science).
2.4 | Sequencing
MiSeq system Illumina sequencer DNA was used to perform DNA sequencing on the genotyping platform at CIRAD-Montpellier. A 500 cycles NANO V2 cartridge Illumina (2 x 250 pb) was used to sequence the library.
2.5 | Design and choice of primers
A total of 800,000 reads were generated for P. erinaceus DNA library. Development of optimized and streamlined microsatellites was based on a bioinformatics Galaxy pipeline and with following tools: FASTQ Groomer tool, Filter FASTQ tool, and ABySS parallel assem-bler (Simpson et al., 2009). The MISA MIcroSAtellite identification
F I G U R E 1 Map of study area and
location of sampling sites in the four West Africa countries. Burkina Faso: SA, Sarya; TI, Tiogo. Togo: OK, Oti-Kéran; FM, Fazao-Malfakassa; AB, Abdoulaye; AK, Plateau Akposso; TO, Togodo. Benin: KA, Koussoukpa; AD, Adakplamè; HO, Houin; BA, Bassila; PE, Pénessoulou; WA, Bénin Parc W. Niger: NI, Niger Parc W; NN, Tamou
4
|
JOHNSON etal.tool (Thiel, 2003) and primer modeling software Primer3 (Whitehead Institute) were used for the identification and design of microsatel-lites primers in the generated draft assembly. A data matrix contain-ing all the microsatellite primers was obtained as output.
Among the 38,715 single sequence repeats identified, primers were designed for 11,718 sequence repeats of which 3,530 were dinucleotide repeats, 2,970 trinucleotide repeats, 2,847 tetranucle-otide repeats, 1,001 pentanucletetranucle-otide repeats, 525 hexanucletetranucle-otide repeats, and 844 contained complex SSR motifs.
Thirty microsatellites were identified and selected for initial screening on the basis of the type and size of the repeat motif, as well as the annealing temperature as previously described Muller et al. (2006). Therefore, dinucleotide and trinucleotide SSRs with a repeat motif of 15 to 30 bp were randomly selected from those generated. The selected primers amplified SSR motifs with a mini-mum of five repetitions. The annealing temperature varied from 54 to 56°C, including that used by Muller et al. (2006) for P. officinalis (54°C). This first test was performed on an ABI 3500XL sequencer (Life technologies) using genomic DNA extract from eight individuals selected from different countries (Table 1).
An M13 tailed primer (5′-CACGACGTTGTAAAACGAC-3′), al-lowing detection of fluorescence, was added to the forward prim-ers. Each PCR amplification was performed in a 96-well plate using
10-μL volume reaction containing 20 ng of DNA, 1X reaction buffer B (Mg2+ free; 0.8 m Tris–HCl, 0.2 m (NH
4)2SO4, 0.2% w/v Tween-20; Solis BioDyne), 0.08 μm of the M13-labeled primer, 0.1 μm of each primer forward fluorescent (FAM, NED, PET, and VIC) and the primer reverse, 0.1 μm of M13 fluorescent primer, 2 mm of MgCl2, 200 μm dNTPs, 0.4X Solution “S” (additive solution that facilitates amplification of difficult templates; Solis BioDyne), and 0.05 U/µL of
Taq DNA polymerase. PCR running conditions were as follows: initial
denaturation at 94°C for 4 min followed by 36 cycles each at 92°C in 30 s, 1 min at 52°C, 45 s at 72°C, and with a final extension step at 72°C for 5 min.
The analysis of electrophoregrams with GeneMapper® software version 4.1 using GeneScan 600 LIZ as a size standard (Applied Biosystems) allowed determining allele sizes. Among the 30 primer pairs tested, 17 were selected. Indeed, we eliminated primers with profiles that were difficult to read on GeneMapper®, or with no or little polymorphism. The 17 selected primers are shown in Table 4 and were used for screening the remaining individuals in order to calculate genetic parameters.
Genetic parameters including alleles’ number per locus, number of private alleles, observed heterozygosity (Ho), and expected het-erozygosity (He) were computed using GenAIEx software version 6.0 (Peakall & Smouse, 2012). Deviation from the Hardy–Weinberg
Country Sampling sites
Number of trees
sampled GPS
Niger Parc W (NI) ** 27 12°14′31.8″ N 2°17′33.4″ E
Tamou (NN) ** 14 12°35′55.1″ N 2°20′34.3″ E Bénin Koussoukpa (KA) * 25 7°03′27.8″ N 2°17′02.1″ Bassila (BA) * 24 8°57′58.8″ N 1°39′01.9″ E Pénessoulou (PE) ** 27 9°18′01.7″ N 1°23′40.1″ E Parc W (WA) 24 7°38′33.8″ N 2°19′22.0″ E Adakplamè (AD) ** 27 7°38′33.8″ N 2°33′02.3″ E Houin (HO) * 24 8°07′34.5″ N 2°17′39.0″ E
Togo Oti-Kéran (OK)
** 25 10°06′12.2″ N 0°41′32.5″ E Fazao-Malfakassa (FM) * 30 8°30′31.7″ 0°51′56.3″ E Abdoulaye (AB) ** 30 8°40′30.2″ N 1°21′02.2″ E Plateau Akposso (AK) 23 7°35′27.6″ N 1°01′29.9″ E Togodo (TO) * 30 6°51′38.6″ N 1°30′45.4″ E
Burkina Faso Sarya (SA) ** 9 12°15′57″ N 2°08′47″ E
Tiogo (TI) ** 25 12°17′22″ N 2°47′12″ E
Total 365
*and ** geographic origin of individuals selected for genomic library construction. **geographic origin of individuals selected for the first screening.
TA B L E 1 Characteristics of sampled
sites for Pterocarpus erinaceus: country location, name of sampling sites, number of trees sampled per site, and GPS coordinates
T A B LE 2 Re su lts o f c ro ss -a m pl ifi ca tio n w ith P. o ff ic ina lis m ic ro sa te lli te s m ar ke rs o n P. er inac eu s p op ul at io ns f ro m T og o N ige r B énin To go B ur ki na F as o Pa rc W K ou ss ou kp a B as si la Pén es sou lou Pa rc W A da kpl amé H ouin O ti-K ér an Fa za o-M A bdou la ye Pl at eau A kp os so To go do Sa ria Ti ogo m Po C IR E01 A m pl ifi ca tio n per cen ta ge NA NA NA NA NA NA NA NA NA NA NA NA NA NA N um be r o f a lle le s 0 0 0 0 0 0 0 0 0 0 0 0 0 0 m Po C IR E0 4 A m pl ifi ca tio n per cen ta ge NA NA NA NA NA NA NA NA NA NA NA NA NA NA N um be r o f a lle le s 0 0 0 0 0 0 0 0 0 0 0 0 0 0 m Po CI RF0 8* A m pl ifi ca tio n per cen ta ge 96 .3 % 92 .0 % 95 .8 % 96 .3 % 91 .7 % 40 .7 % 87. 5% 10 0.0 % 55 .2 % 26 .7 % 82 .6 % 77. 4% 10 0.0 % 10 0.0 % N um be r o f a lle le s 1 1 1 2 2 1 1 1 1 1 2 1 1 1 m Po C IR H 02 A m pl ifi ca tio n per cen ta ge NA NA NA NA NA NA NA NA NA NA NA NA NA NA N um be r o f a lle le s 0 0 0 0 0 0 0 0 0 0 0 0 0 0 m PoC IR E09 A m pl ifi ca tio n per cen ta ge NA NA NA NA NA NA NA NA NA NA NA NA NA NA N um be r o f a lle le s 0 0 0 0 0 0 0 0 0 0 0 0 0 0 m Po C IR H08 A m pl ifi ca tio n per cen ta ge 77. 8% 88 .0 % 75 .0 % 63. 0% 70 .8 % 29 .6 % 50.0 % 10 0.0 % 55 .2 % 30.0 % 82 .6 % 74 .2 % 10 0.0 % 92 .0 % N um be r o f a lle le s 9 8 5 10 10 5 9 7 10 5 9 10 4 8 m Po C IRH 07* A m pl ifi ca tio n per cen ta ge 96 .3 % 88 .0 % 87. 5% 85 .2 % 87. 5% 55 .6 % 91 .7 % 10 0.0 % 69 .0 % 30.0 % 87. 0% 77. 4% 10 0.0 % 10 0.0 % N um be r o f a lle le s 3 2 2 3 3 2 2 3 4 3 3 4 1 3 m Po CI RF0 3 A m pl ifi ca tio n per cen ta ge 85 .2 % 68 .0 % 91 .7 % 40 .7 % 66 .7 % 29 .6 % 62 .5% 72 .0 % 37. 9% 20.0 % 65 .2 % 51 .6 % 66 .7 % 88 .0 % N um be r o f a lle le s 9 6 5 7 7 7 8 11 9 4 7 6 4 5 *l oc i w ith l itt le p ol ym or ph is m ; N A = n o a m pl ifi ca tio n
6
|
JOHNSON etal. equilibrium (HWE) was measured for each locus by chi-squared testsand p-value significance assessed in the context of multiple testing with a Bonferroni correction procedure (Rice, 1989). Significant link-age disequilibrium was rated among these loci by using GENETIX software version 4.05 (Belkhir et al., 1996). MICRO-CHECKER soft-ware version 2.2.3 (Van Oosterhout et al., 2004) was used to check for the null alleles in microsatellite data.
3 | RESULTS AND DISCUSSION
Contrary to Hong et al. (2020) results in chloroplast genomes of five
Pterocarpus species, among the single sequence repeats identified
there was no single-nucleotide repeats motifs accounted. The ob-served proportion of dinucleotide, trinucleotide, and tetranucleotide were respectively 30.1%, 25.3%, and 24.3%, while the tetranucleo-tide proportion was 2.27%. 4.5% of nucleotetranucleo-tides were hexanucleo-tide repeats, and 7.2% were complex SSR motifs.
A total of 237 alleles were identified for the 17 locus on the 365 characterized trees, with each locus having from 4 to 30 al-leles (mean of 13.9 alal-leles per locus) (Table 4). Table 3 shows the total numbers of specific alleles for each population (private al-leles) across all 17 loci. A total of 34 private alleles have been iden-tified out of the 15 populations. Their distribution varied from 0 allele (BA, AB, SA populations) to 13 alleles (OK population). The majority of them (22/34 alleles) was characterized by an allelic frequency smaller than 5%. The 12 remaining private alleles have a frequency varying from 5% to 12%. Mean values for the ex-pected heterozygosity (He) varied from 0.42 to 0.65 (0.57 ± 0.02) and from 0.41 to 0.65 (0.55 ± 0.02) for observed heterozygosity
(Ho) for the population screened (Table 3). Evidence of significant linkage disequilibrium was found for 12 out of 136 possible SSR pairwise combinations after Bonferroni corrections. Significant departures from Hardy–Weinberg equilibrium for 14 out of 17 loci were recorded after Bonferroni corrections, and presence of null alleles was suggested for all loci excepted for mPeCIR_D2 and mPeCIR_T3.
Two populations of Togo, Oti-Kéran and Fazao-Malfakassa, and the population of Pénélessou in Benin have a particularly high rate of private alleles scoring respectively to 11.5%, 5.6%, and 5.1%. On the other hand, the populations of Abdoulaye (Togo), Bassila (Bénin), and Sarya (Burkina Faso) have no private allele. Observed heterozygosity generally follows the trend of private alleles level with high values for Oti-Kéran (0.55), Fazao-Malfakassa (0.65), and Pénélessou (0.63) compared to Abdoulaye (0.41) and Bassila (0.50) (Table 3). From a conservation perspec-tive and on the basis of genetic diversity level, Oti-Kéran, Fazao-Malfakassa, and Pénélessou are the most interesting populations sampled in this study. These three populations notably come from protected sites (reserves and parks) located in the Sudanian area. On the contrary, Abdoulaye's samples come from the community forest exploited by the surrounding local populations following the principles of integrated and participatory management. The type forest management undergone by the tree populations may not be however the only explanative factor of the observed di-versity levels. Studied populations all belong to natural stands distributed according to the climatic gradient of the Sahelian, Sudanian, and Guinean zones and exhibit high morphological vari-ation. Johnson et al. (2020) identified 3 morphotypes for P.
erina-ceus in Togo characterized by phenotypic specificity related to
TA B L E 3 Private alleles and heterozygosity levels across populations
Country Sampling sites
Total number of alleles Number of private alleles Percentage of private alleles Observed heterozygosity (Ho) Expected heterozygosity (He)
Niger Parc W (NI) 100 2 2% 0.58 ± 0.22 0.61 ± 0.19
Tamou (NN) 79 3 3.7% 0.56 ± 0.24 0.57 ± 0.18
Bénin Koussoukpa (KA) 85 3 3.5% 0.52 ± 0.33 0.52 ± 0.29
Bassila (BA) 77 0 0% 0.50 ± 0.28 0.48 ± 0.25
Pénessoulou (PE) 123 7 5.6% 0.63 ± 0.23 0.65 ± 0.22
Parc W (WA) 96 2 2.1% 0.56 ± 0.22 0.62 ± 0.21
Adakplamè (AD) 83 1 1.2% 0.50 ± 0.29 0.52 ± 0.27
Houin (HO) 86 2 2.3% 0.49 ± 0.29 0.54 ± 0.28
Togo Oti-Kéran (OK) 113 13 11.5% 0.55 ± 0.28 0.65 ± 0.26
Fazao-Malfakassa (FM) 116 6 5.1% 0.65 ± 0.23 0.64 ± 0.23 Abdoulaye (AB) 43 0 0% 0.41 ± 0.38 0.42 ± 0.23 Plateau Akposso (AK) 89 1 1.1% 0.56 ± 0.26 0.57 ± 0.23 Togodo (TO) 91 3 3.2% 0.52 ± 0.30 0.53 ± 0.28
Burkina Faso Sarya (SA) 78 0 0% 0.58 ± 0.26 0.62 ± 0.20
a climate gradient. On the basis of descriptors related to leaves, fruits, and seeds, a morphotype adapted to the dry Sudanian zone was described in Oti-Kéran and Fazao-Malfakassa sites, a mor-photype adapted to the semiwet Sudano-Guinean zone was de-scribed in Abdoulaye site, and a third morphotype adapted to the wet Guinean zone was described in Akposso and Togodo sites. From this point of view, the level of genetic diversity could also be related to ecotypes but further work is requested to inves-tigate this hypothesis. Finally, we would advise to account both
for genetic diversity level and for ecotype specificity in future conservation programs for P. erinaceus.
This set of 17 specific primers of P. erinaceus would serve to study the genetic diversity of this species in West Africa. While the SSR set developed by Muller et al. (2006) on P. officinalis does not show a proper amplification and/ or polymorphism level on
P. erinaceus, the transferability of the SSR markers set presented
in this study on other Pterocarpus species should be further investigated.
TA B L E 4 Characteristics of 17 microsatellite primers designed for Pterocarpus erinaceus Poir
Primer name Primer sequences (5'−3')
Repeat
motif Allele size TA°C Na Ho He p-value
mPeCIR_D1 F: TTTCTTCTACTTTCCTTTCCC (CT)15 109–124 54.4 16 0.70 0.74 0.000***
R: AAGCAGGCTCAAGAGAAGA
mPeCIR_D2 F: AACATGCAAGCAAAGCA (AG)13 107–123 54.6 12 0.74 0.67 0.000***
R: AAGGTGGAGCTAAAGAAGGT
mPeCIR_D4 F: TCGGTTTTGGTCTTTGTG (TC)14 152–167 55.4 16 0.82 0.78 0.000***
R: CAGACCGTTGGGAAGAA
mPeCIR_D5 F: TGTCCCGTGAAGAAAGG (GA)10 102–159 55.3 10 0.43 0.38 0.000***
R: AAGCAGGCTCAAGAGAAGA
mPeCIR_D7 F: CGTCAGCCTCCAATCTC (GA)14 189–203 54.9 20 0.69 0.68 0.002***
R: CGCTTGATTTGGTCCTC
mPeCIR_D8 F: CTCATGGGCACAGAACAA (TA)11 177–205 56.4 30 0.71 0.75 0.008***
R: GATGGGCTTCACAGCAA
mPeCIR_D9 F: TTTCCCGGTGTCAAGAA (TC)16 188–208 55.8 20 0.71 0.68 0.002***
R: GACACACGCACATACAGAGA
mPeCIR_D10 F: TCACCAAAACATGCACAA (TG)14 214–230 55.1 11 0.46 0.52 0.000***
R: GCTCATGCTTAGCCCC
mPeCIR_D11 F: GGGTTAGAGTTTGAATGGG (AG)17 221–239 54.5 22 0.75 0.78 0.000***
R: GCCTTCCTCAGCACTATTT
mPeCIR_D12 F: AACCTGCCCATCCATTT (TC)16 238–253 56.1 10 0.52 0.54 0.000***
R: TACACTGGGTCGTTGGG
mPeCIR_D14 F: CAGCACTGGCACCAAC (AG)13 280–307 55.1 29 0.76 0.78 0.000***
R: CACCACACCGCTTAATGT
mPeCIR_T1 F: TCCATTGGGGTATCTATGTG (ATC)6 115–121 55.7 4 0.23 0.34 0.000***
R: CCTCAAGGGTGTTTTGTGT
mPeCIR_T2 F: ATCACGGGCTCTTCCTC (TCT)8 121–130 56.0 9 0.38 0.43 0.000***
R: TCATTGTTTCTGCAAATCCT
mPeCIR_T3 F: GGCCATTCTTCATGTGTTT (CTT)8 99–146 55.9 9 0.39 0.39 0.114ns
GGAGATGGGTGAGAGTGAA
mPeCIR_T4 F: CAGGAGGGGTGGTGG (GAA)6 146–152 56.3 4 0.31 0.31 0.308ns
R: GCATCCTAGCCCGATTT
mPeCIR_T5 F: AGACCCGAACTTGTCCC (TTA)11 145–167 55.7 11 0.48 0.61 0.459ns
R: TGCCAGTGTGTGATGGA
mPeCIR_T15 F: CCCTCATCAAGAAGAACCA (ACA)7 277–295 56.0 4 0.29 0.33 0.000***
R: CTTGCATCACCACCCTC
Note: He, expected heterozygosity under Hardy–Weinberg equilibrium; Ho, observed heterozygosity; Na, number of individuals; TA°C, annealing
temperature. p-values for the Hardy–Weinberg Equilibrium test, significance threshold adjusted using sequential Bonferroni correction. *p ≤ .05, ***p ≤ .001, ns = not significant.
8
|
JOHNSON etal.4 | CONCLUSION
In this study, thirty (30) microsatellites primers were developed based on P. erinaceus populations from three different African countries by using NGS (Illumina MiSeq sequencing technology). Seventeen (17) of these nuclear markers showed a high level of polymorphism in fifteen (15) locations, thus providing the first set of microsatellite markers for P. erinaceus. These microsatel-lite markers will be useful for characterizing genetic diversity and analyzing genetic structure for P. erinaceus populations in order to contribute to the implementation of optimal management and conservation plans for this species.
ACKNOWLEDGMENTS
We are grateful to Prof. Christine OUINSAVI head of the Forest Studies and Research Laboratory from the University of Parakou in Bénin, Prof Ali MAHAMANE and Dr Habou RABIOU from the University of Diffa in Niger, Dr Babou André BATIONO from Burkina Faso, and their laboratory teams and collaborators for providing plant material from these countries.
CONFLIC TS OF INTEREST
The authors have no conflicts of interest to declare.
AUTHOR CONTRIBUTION
Benziwa Nathalie Johnson: Conceptualization (equal); Data
cura-tion (equal); Formal analysis (equal); Funding acquisicura-tion (equal); Investigation (equal); Methodology (equal); Project administration (equal); Resources (equal); Visualization (equal); Writing-original draft (lead); Writing-review & editing (equal). Marie Luce Akossiwoa
Quashie: Conceptualization (equal); Funding acquisition (equal);
Investigation (supporting); Methodology (equal); Project adminis-tration (lead); Supervision (equal); Visualization (equal); Writing-original draft (supporting); Writing-review & editing (equal). Gilles
Chaix: Conceptualization (equal); Formal analysis (equal); Funding
acquisition (equal); Investigation (supporting); Methodology (equal); Project administration (equal); Resources (equal); Supervision (equal); Validation (equal); Visualization (equal); Writing-review & editing (equal). Letizia Camus-Kulandaivelu: Formal analysis (equal); Validation (equal); Visualization (equal); Writing-review & editing (equal). Kossi Adjonou: Conceptualization (supporting); Funding acquisition (equal); Investigation (supporting); Visualization (sup-porting); Writing-review & editing (equal). Kossi Novinyo Segla: Conceptualization (supporting); Investigation (equal); Visualization (supporting); Writing-review & editing (equal). Adzo Dzifa Kokutse: Conceptualization (equal); Funding acquisition (equal); Visualization (equal); Writing-review & editing (equal). Christine Ouinsavi: Resources (equal); Writing-review & editing (supporting). Babou
André Bationo: Resources (equal); Writing-review & editing
(sup-porting). Habou Rabiou: Resources (equal); Writing-review & edit-ing (supportedit-ing). Kouami Kokou: Conceptualization (equal); Fundedit-ing acquisition (equal); Visualization (equal); Writing-review & edit-ing (equal). Hélène Vignes: Data curation (equal); Formal analysis
(equal); Investigation (equal); Methodology (equal); Resources (equal); Visualization (equal); Writing-review & editing (equal).
DATA ACCESSIBILIT Y
The data have been deposited with links to BioProject accession number PRJNA604893 in the NCBI BioProject database (https:// www.ncbi.nlm.nih.gov/biopr oject/). 17 Primers designed and evalu-ated: end of text (Table 4).
ORCID
Benziwa Nathalie Johnson https://orcid. org/0000-0003-0018-8085
REFERENCES
Adjonou, K., Houetchegnon, T., Rabiou, H., Kossi, S. N., Abotsi, E. K., Johnson, B. N., Alaba, P., Ouinsavi, C. A. N., Quashie, A. M. L., & Kokutse, A. D. (2019). Challenges of conservation and sustainable management of African rosewood (Pterocarpus erinaceus) in West Africa. Natural Resources Management and Biological Sciences, (Intech
Open), 29, https://doi.org/10.5772/intec hopen.88796
Arbonnier, M. (2004). Arbres, arbustes et lianes des zones sèches d'Afrique
de l'Ouest (Éditions CIRAD, Margraf Publishers GMBH, MNHN). 579
p.
Belkhir, K., Borsa, P., Chikhi, L., Raufaste, N., & Bonhomme, F. (1996). GENETIX 4.05, logiciel sous Windows TM pour la génétique des pop-ulations. Retrieved from http://www.Genet ix.univ-montp2.fr/genet ix/genet ix.htm
Bousquet, J., Simon, L., & Lalonde, M. (1990). DNA amplification from vegetative and sexual tissues of trees using polymerase chain reac-tion. Canadian Journal of Forest Research, 20, 254–257. https://doi. org/10.1139/x90-037
CITES. (2016). Convention sur le commerce international des espèces de faune et de flore sauvages menacées d’extinction. Dix-septième session de la Conférence des Parties Johannesburg (Afrique du Sud). De, J., Zhu, W., Liu, T., Wang, Z., & Zhong, Y. (2017). Development of mi-crosatellite markers using Illumina MiSeq sequencing to characterize
Ephedra gerardiana (Ephedraceae) 1. Applications in Plant Sciences, 5,
4. https://doi.org/10.3732/apps.1600104
Dumenu, W. K. (2019). Assessing the impact of felling/export ban and CITES designation on exploitation of African rosewood (Pterocarpus
erinaceus). Biological Conservation, 236, 124–133. https://doi.
org/10.1016/j.biocon.2019.05.044
Duvall, C. S. (2008). Pterocarpus erinaceus Poir. [Internet] Record from PROTA4U. In D. Louppe, A. A. Oteng-Amoako, & M. Brink (Eds.),
PROTA (Plant Resources of Tropical Africa/Ressources végétales de l'Af-rique tropicale) (pp 478–482).
Fontodji, J. K., Atsri, H., Adjonou, K., Radji, A. R., Kokutse, A. D., Nuto, Y., & Kokou, K. (2011). Impact of charcoal production on biodiversity in Togo (West Africa). In Togo (West Africa), The Importance of Biological
Interactions in the Study of Biodiversity, Jordi Lopez Pujol, IntechOpen,
(pp. 215–230). https://doi.org/10.5772/22969. Available from: https://www.intec hopen.com/books/ the-impor tance -of-biolo gical -inter actio ns-in-the-study -ofbio diver sity/impac t-of-charc oal-produ ction -on-biodi versi ty-in-togo-west-afric
a-Giffard, P. L. (1974). L'Arbre dans le paysage sénégalais: sylviculture en zone tropicale sèche. Dakar : GERDAT--Centre technique forestier tropical. 452 p.
Hong, Z., Wu, Z., Zhao, K., Yang, Z., Zhang, N., Guo, J., Tembrock, L. R., & Xu, D. (2020). Comparative analyses of five complete chloroplast ge-nomes from the genus Pterocarpus (Fabacaeae). International Journal
Johnson, B. N., Quashie, M. L. A., Adjonou, K., Segla, K. N., Kokutse, A. D., & Kokou, K. (2020). Morphological variability of pterocarpus eri-naceus poir. in Togo. International Journal of Forestry Research, 2020, 16p.
Karou, D., Dicko, M. H., Sanon, S., Simpore, J., & Traore, A. S. (2003). Antimalarial activity of Sida acuta Burm. f. (Malvaceae) and
Pterocarpus erinaceus Poir. (Fabaceae). Journal of Ethnopharmacology, 89, 291–294. https://doi.org/10.1016/j.jep.2003.09.010
Kokou, K., Nuto, Y., & Honan, A. (2009). Impact of charcoal production on woody plant species in West Africa: A case study in Togo. Scientific
Research and Essays, 4, 881–893.
Lamarck, J. B. A. P., & Poiret, J. L. M. (1823). Tableau encyclopédique et
méthodique des trois règnes de la nature. Botanique. : Panckoucke.
Lawson, S. (2015). The illegal rosewood boom in West Africa; How Chinese
demand is driving conflict, corruption and human rights abuses.
Presentation to Chatham House Illegal Logging Stakeholder Update Meeting, 25th June 2015.
Morgante, M., & Olivieri, A. M. (1993). PCR-amplified microsatellites as markers in plant genetics. The Plant Journal, 3, 175–182. https://doi. org/10.1046/j.1365-313X.1993.t01-9-00999.x
Muller, F., Vaillant, A., Bâ, A., & Bouvet, J.-M. (2006). Isolation and char-acterization of microsatellite markers in Pterocarpus officinalis Jacq.
Molecular Ecology Resources, 6, 462–464.
Oliveira, E. J., Pádua, J. G., Zucchi, M. I., Vencovsky, R., & Vieira, M. L. C. (2006). Origin, evolution and genome distribution of microsat-ellites. Genetics and Molecular Biology, 29, 294–307. https://doi. org/10.1590/S1415 -47572 00600 0200018
Ouedraogo, N., Sawadogo, W., Tibiri, A., Bayet, C., Lompo, L., Hay, E. A., Koudou, J., Dijoux, M.-G., & Guissoux, P. I. (2012). Pharmacological properties and related constituents of stem bark of Pterocarpus
eri-naceus Poir. (Fabaceae). Asian Pacific Journal of Tropical Medicine, 5,
46–51.
Peakall, R., & Smouse, P. E. (2012). GenAlEx 6.5: Genetic analysis in Excel. Population genetic software for teaching and research—an up-date. Bioinformatics, 28, 2537–2539. https://doi.org/10.1093/bioin forma tics/bts460
Pimentel, J. S. M., Carmo, A. O., Rosse, I. C., Martins, A. P. V., Ludwig, S., Facchin, S., Pereira, A. H., Brandão-Dias, P. F. P., Abreu, N. L., & Kalapothakis, E. (2018). High-throughput sequencing strategy for
microsatellite genotyping using Neotropical fish as a model. Frontiers
in Genetics, 9, 8. https://doi.org/10.3389/fgene.2018.00073
Rice, W. R. (1989). Analyzing tables of statistical tests. Evolution, 43, 223– 225. https://doi.org/10.1111/j.1558-5646.1989.tb042 20.x
Rico, C., Normandeau, E., Dion-Côté, A.-M., Rico, M. I., Côté, G., & Bernatchez, L. (2013). Combining next-generation sequencing and online databases for microsatellite development in non-model or-ganisms. Scientific Reports, 3(1), https://doi.org/10.1038/srep0 3376 Segla, K. N., Adjonou, K., Radji, A. R., Kokutse, A. D., Kokou, K., Rabiou,
H., Kamana, P., Bationo, B. A., & Ali, M. (2015). Importance so-cio-économique de Pterocarpus erinaceus Poir. au Togo. European
Scientific Journal, ESJ, 11(23), 199–217.
Senan, S., Kizhakayil, D., Sasikumar, B., & Sheeja, T. E. (2014). Methods for development of microsatellite markers: An overview. Notulae
Scientia Biologicae, 6, 1–13. https://doi.org/10.15835/ nsb61 9199
Simpson, J. T., Wong, K., Jackman, S. D., Schein, J. E., Jones, S. J., & Birol, I. (2009). ABySS: A parallel assembler for short read sequence data. Genome Research, 19, 1117–1123. https://doi.org/10.1101/ gr.089532.108
Thiel, T. (2003). MISA—Microsatellite identification tool. Retrieved from http://Pgrc.Ipk-Gater sleben.de/Misa/ [Accessed 17 June 2019]. Van Oosterhout, C., Hutchinson, W. F., Wills, D. P., & Shipley, P. (2004).
MICRO-CHECKER: Software for identifying and correcting genotyp-ing errors in microsatellite data. Molecular Ecology Notes, 4(3), 535– 538. https://doi.org/10.1111/j.1471-8286.2004.00684.x
Vieira, M. L. C., Santini, L., Diniz, A. L., & de Munhoz, C. F. (2016). Microsatellite markers: What they mean and why they are so useful. Genetics and Molecular Biology, 39, 312–328. https://doi. org/10.1590/1678-4685-GMB-2016-0027
How to cite this article: Johnson BN, Quashie MLA, Chaix G,
et al. Isolation and characterization of microsatellite markers for the threatened African endemic tree species Pterocarpus
erinaceus Poir. Ecol Evol. 2020;00:1–9. https://doi. org/10.1002/ece3.6944