HAL Id: hal-02992299
https://hal.archives-ouvertes.fr/hal-02992299
Submitted on 7 Nov 2020
HAL is a multi-disciplinary open access archive for the deposit and dissemination of sci-entific research documents, whether they are pub-lished or not. The documents may come from teaching and research institutions in France or abroad, or from public or private research centers.
L’archive ouverte pluridisciplinaire HAL, est destinée au dépôt et à la diffusion de documents scientifiques de niveau recherche, publiés ou non, émanant des établissements d’enseignement et de recherche français ou étrangers, des laboratoires publics ou privés.
canine high-grade mammary tumor cells using single-cell
transcriptomics
Béatrice Cambien, Kevin Lebrigand, Alberto Baeri, Nicolas Nottet, Catherine
Compin, Audrey Lamit, Olivier Ferraris, Christophe Peyrefitte, Virginie
Magnone, Jérôme Henriques, et al.
To cite this version:
Béatrice Cambien, Kevin Lebrigand, Alberto Baeri, Nicolas Nottet, Catherine Compin, et al.. Iden-tification of oncolytic vaccinia restriction factors in canine high-grade mammary tumor cells using single-cell transcriptomics. PLoS Pathogens, Public Library of Science, 2020, 16 (10), pp.e1008660. �10.1371/journal.ppat.1008660�. �hal-02992299�
RESEARCH ARTICLE
Identification of oncolytic vaccinia restriction
factors in canine high-grade mammary tumor
cells using single-cell transcriptomics
Be´atrice CambienID1, Kevin LebrigandID2, Alberto Baeri2, Nicolas NottetID2, Catherine Compin1, Audrey Lamit1, Olivier Ferraris3, Christophe N. PeyrefitteID3,
Virginie Magnone2, Je´roˆ me Henriques1, Laure-Emmanuelle ZaragosiID4, Sophie Giorgetti-PeraldiID5, Fre´de´ric BostID5, Marine Gautier-IsolaID2, Roger Rezzonico4, Pascal Barbry2, Robert BarthelID6, Bernard Mari2, Georges VassauxID4*
1 Universite´ Coˆte d’Azur, CEA, Laboratoire TIRO, Nice France, 2 Universite´ Coˆte d’Azur, CNRS, IPMC, FHU-OncoAge, Valbonne, France, 3 Institut de recherche biome´dicale des arme´es, Universite´ de Lyon, Lyon, France, 4 Universite´ Coˆte d’Azur, INSERM, CNRS, IPMC, Valbonne, France, 5 Universite´ Coˆte d’Azur, INSERM, C3M, Nice, France, 6 Lucioles Consulting, Chateauneuf-Villevieille, France
*vassaux@ipmc.cnrs.fr
Abstract
Mammary carcinoma, including triple-negative breast carcinomas (TNBC) are tumor-types for which human and canine pathologies are closely related at the molecular level. The effi-cacy of an oncolytic vaccinia virus (VV) was compared in low-passage primary carcinoma cells from TNBC versus non-TNBC. Non-TNBC cells were 28 fold more sensitive to VV than TNBC cells in which VV replication is impaired. Single-cell RNA-seq performed on two differ-ent TNBC cell samples, infected or not with VV, highlighted three distinct populations: naïve cells, bystander cells, defined as cells exposed to the virus but not infected and infected cells. The transcriptomes of these three populations showed striking variations in the modu-lation of pathways regulated by cytokines and growth factors. We hypothesized that the pool of genes expressed in the bystander populations was enriched in antiviral genes. Bioin-formatic analysis suggested that the reduced activity of the virus was associated with a higher mesenchymal status of the cells. In addition, we demonstrated experimentally that high expression of one gene, DDIT4, is detrimental to VV production. Considering that DDIT4 is associated with a poor prognosis in various cancers including TNBC, our data highlight DDIT4 as a candidate resistance marker for oncolytic poxvirus therapy. This infor-mation could be used to design new generations of oncolytic poxviruses. Beyond the field of gene therapy, this study demonstrates that single-cell transcriptomics can be used to iden-tify cellular factors influencing viral replication.
Author summary
The identification of cellular genes influencing viral replication/propagation has been studied using hypothesis-driven approaches and/or high-throughput RNA interference screens. In the present report, we propose a methodology based on single-cell
a1111111111 a1111111111 a1111111111 a1111111111 a1111111111 OPEN ACCESS
Citation: Cambien B, Lebrigand K, Baeri A, Nottet N, Compin C, Lamit A, et al. (2020) Identification of oncolytic vaccinia restriction factors in canine high-grade mammary tumor cells using single-cell transcriptomics. PLoS Pathog 16(10): e1008660.
https://doi.org/10.1371/journal.ppat.1008660
Editor: Eric Bartee, Medical University of South Carolina, UNITED STATES
Received: May 23, 2020 Accepted: September 1, 2020 Published: October 19, 2020
Copyright:© 2020 Cambien et al. This is an open access article distributed under the terms of the
Creative Commons Attribution License, which permits unrestricted use, distribution, and reproduction in any medium, provided the original author and source are credited.
Data Availability Statement: Transcriptomic single cell and bulk data can be accessed on NCBI GEO accession number GSE142185. R Code can be accessed on github (https://github.com/ ucagenomix/sc.cambien.2020). The preprocessed objects required to reproduce analysis will be available on request.
Funding: This work was performed with the financial support from ITMO Cancer AVIESAN (Alliance Nationale pour les Sciences de la Vie et de la Sante´, National Alliance for Life Sciences &
transcriptomics. We have studied, in the context of oncolytic virotherapy, the susceptibil-ity of different grades of primary low-passage mammary carcinoma cells of canine origin to an oncolytic vaccinia virus (VV). We highlight a fault in replication of VV in cells that originated from high-grade triple-negative breast carcinomas (TNBC). Single-cell RNA-seq performed on TNBC cell samples infected with VV suggested that the reduced activity of the virus was associated with a higher mesenchymal status of the cells. We also demon-strate that high expression of one gene, DDIT4, is detrimental to VV production. Consid-ering that DDIT4 is associated with a poor prognosis in various cancers including TNBC, our data highlight DDIT4 as a candidate resistance marker for oncolytic poxvirus therapy. Beyond the field of cancer gene therapy, we demonstrate here that single-cell transcrip-tomics increases the arsenal of tools available to identify cellular factors influencing viral replication.
Introduction
Oncolytic vaccinia virus (VACV) represents a new class of anticancer agent with multiple mechanisms of action. VACV has been shown to act at three distinct levels [1]. VACV infects and selectively replicates in cancer cells, leading to primary oncolysis and resulting in cancer cell destruction [2]. It also disrupts the tumor vasculature [3] and reduces tumor perfusion. Finally, the release of tumor antigens from dead tumor cells participates in the initiation of an immune response that may be effective against tumor cells [1,4–7]. In humans, VACV, administered intratumorally or systemically has been well tolerated in various clinical trials [4].
Poxviruses are large viruses with cytoplasmic sites of replication and are considered to be less dependent on host cell functions than other DNA viruses. Nevertheless, the existence of cellular proteins capable of inhibiting or enhancing poxvirus replication and spread has been demonstrated. Cellular proteins such as dual specific phosphatase 1 DUSP1 [8] or barrier to autointegration factor (BAF) [9] have been shown to be detrimental to the virus. In contrast, the ubiquitin ligase cullin-3 has been shown to be required for the initiation of viral DNA rep-lication [10]. Furthermore, high-throughput RNA interference screens have suggested the potential role of hundreds of proteins acting as either restricting or promoting factors for pox-viruses [10–13]. These studies highlight the importance of cellular factors in VACV replication and spread. Theoretically, over-expression or down-regulation of these putative restricting or promoting factors in carcinoma cells could result in reduced sensitivity and even resistance to VACV when primary oncolysis is considered. The concept of resistance to primary oncolysis by VACV has, so far, not been formally demonstrated. For example, in the field of breast can-cer research,in vitro testing in established human cell lines and in vivo xenografts in mice, has
shown clearly and convincingly that VACV has anti-tumor activity against breast cancer [14,
15]. The efficacy of VACV was evident in mouse models of triple-negative high-grade breast carcinoma [15], a pathology associated with poor prognosis and for which new therapeutic options are urgently needed. Nevertheless, these studies were performed using established can-cer cell lines that may differ from the actual carcinoma cells present in the tumors.
Spontaneously occurring mammary cancers in dogs are of potential interest in the develop-ment of new anticancer agents [16–18] as the classification of canine breast carcinoma is rele-vant to that of human’s [19–23]. Although differences have been highlighted in complex carcinomas [24], simple canine carcinomas faithfully represent human breast carcinomas, both at the histological and molecular level [20,21]. This is particularly the case for the so
Health) within the framework of the Cancer Plan ("Plan Cancer 2009-2013": 12INS001MRAR, "Plan Cancer 2014-2019": 14APS001MCSR and 18CN045) and with support from the Canceropole PACA. The funders had no role in study design, data collection and analysis, decision to publish, or preparation of the manuscript.
called "triple negative carcinomas" (lack of estrogen and progesterone receptors and of epider-mal growth factor receptor type 2) [22,25,26], for which therapeutic options are currently lim-ited and unsatisfactory.
The aim of the present study was to determine whether differences in VACV -induced abil-ity to kill freshly isolated primary cells from low-grade versus high-grade canine breast carci-nomas could be demonstrated. Bulk and single cell RNA-seq were used to analyze events associated with VACV infection and to characterize genes potentially interfering with the VACV cycle.
Results
TNBC canine cells show reduced sensitivity to a vaccinia virus-Lister strain
deleted in the thymidine kinase gene (VV) compared with TNBC
carcinoma cells
Cells from TNBC or non-TNBC were infected with vaccinia virus-Lister strain deleted in the thymidine kinase gene (VV) at different multiplicities of infection (MOI) and the number of cells remaining in the culture well was monitored after four days.Fig 1Apresents an example of dose-response curves showing that non-TNBC cells were more sensitive to VV-mediated cell lysis than TNBC cells. This observation was in sharp contrast to the situation observed in human established cell lines in which MCF7 cells (as a representative of non-TNBC cells) and MDA-MB-231 cells (as a representative of TNBC cells) showed an equivalent sensitivity to VV-induced cell lysis (Fig 1B). The combined LD50 of experiments performed on n = 10 non-TNBC and n = 6 non-TNBC are presented inFig 1Cand show that non-TNBC cells were 28 fold more sensitive to VV than TNBC cells. By comparison, the LD50 on normal primary canine epithelial cells was around four-fold lower than that of non-TNBC (S1 Fig). Viral production was compared in canine TNBC and non-TNBC cells. Quantitative PCR to determine the num-ber of viral genomes produced on infection (Fig 1D) and titration to determine the number of viral particles showed a reduced number of infectious viral particles produced on infection of TNBC cells (Fig 1E).
Replication as opposed to viral infection/early stage of viral transcription is
affected mainly in canine TNBC cells
We used a vaccinia virus-Copenhagen strain in which GFP expression is driven by an immedi-ate-early vaccinia virus promoter (VACV-Cop-GFP) to infect non-TNBC and TNBC cells. Although the Copenhagen strain is more aggressive that the Lister strain used in the rest of the study, VACV-Cop-GFP represents a very useful tool to visualize and monitor infection/early viral gene transcription. Counting the number of propidium iodide-positive and GFP-positive cells (S2A–S2D Fig) revealed a statistically-significant, 5% difference in infection/early-stage of viral transcription between the two types of cells (S2E Fig). In addition, the difference in mean fluorescence intensity of GFP was statistically non-significant in non-TNBC and TNBC cells (S2F Fig). Propidium iodide staining showed a classical nuclear labelling as well as cytosolic dots (S2B and S2D Fig). These structures are usually found in cells infected with VV and are often referred to as DNA factories or mininuclei [27,28]. They are cytoplasmic sites of viral DNA replication [27]. The percentage of mininucleus-positive cells in GFP-positive cells eight hours after infection was 53% and 26.6% in non-TNBC and TNBC cells, respectively (S2G Fig). In mininuclei-positive cells, an average of three and one mininuclei were found in the cytosol of non-TNBC and TNBC cells, respectively (S2H Fig). Altogether, these data show that although a difference in the efficacy of infection/early stage of viral transcription can be
Fig 1. Comparison of the efficacy of VV on non-TNBC or TNBC of different origins. A. Primary canine cells (non TNBC: white circles; TNBC black circles) or B. human established cell lines (MCF7: white squares, as a non-TNBC established cell line; MDA-MB-231: black squares, as a TNBC established cell line) were infected at different MOIs with VV. Fours days later, the remaining cells were estimated using a MTT assay. The results are presented as a percentage of cell-survival in uninfected cells and are the mean +/- SEM of six different experimental points. The results presented are representative of two independent experiments. C. A similar experiment was performed on the cohort of non-TNBC and TNBC cells. For each primary line, two independent experiments involving each six experimental points were performed to calculate the LD50. Each point (white circles: non-TNBC, black circles: TNBC) represents the mean of the two experiments). The bars represent the mean LD50 +/- SE obtained on ten independent non-TNBC and six independent TNBC cultures. LD50 on the Y-axis is expressed as the ratio of infectious viral particles to mammalian cells capable of killing 50% of the cell population. D. Twenty-four hours after VV infection (MOI = 0.1), non-TNBC (white circles) or TNBC (black circles) cells were collected, and DNA was isolated and subjected to quantitative PCR to titer the number of viral genomes per well. Each circle represents the mean of two independent experiments performed in triplicate. The mean and SEM of the VV genome copies produced in non-TNBC and non-TNBC primary cells are presented (E). Three days after VV infection (MOI = 0.1), non-non-TNBC (white circles) or TNBC (black circles) cells were collected, homogenized and the number of infectious particles generated in the culture dishes were titrated. Each circle represents the mean of two independent experiments, each performed in 6 experimental points. The means and SEMs of VV produced in non-TNBC and TNBC primary cells are presented. Details of the samples used to obtain these data (Fig 1A to 1E) are listed inS1 Table. F. TNBC (blue) or non-TNBC (red) carcinoma cells were infected at a MOI of 5. At different times post-infection (2, 4, 8 hours), the cells were collected and processed for RNA sequencing. The data represent the levels of early (left panel), intermediate (middle panel) or late (right panel) viral gene expression. CPM on the Y-axis stands for “Counts Per Million”. CPM is the count of sequenced fragments mapping to each relevant gene scaled by the total number of reads times one million. Details of the samples used to obtain these data are listed inS1 Table.
detected in non-TNC and TNBC cells, the main quantitative difference lies in the number of DNA factories, as in an average population, six-fold more viral DNA factories can be detected in non-TNBC compared to TNBC cells.
Upon infection, early viral genes are rapidly transcribed by the viral RNA-polymerase pack-aged within the infectious particles [29]. By contrast, the expression of intermediate- and late-viral genes requiresde novo protein synthesis and viral replication in DNA factories [29]. An implication of the results presented inFig 1andS2 Figis that expression of the early viral genes should be comparable in non-TNBC and TNBC, while expression of intermediate and late genes should be largely impaired in TNBC. To assess this hypothesis, analyses of the kinetics of expres-sion of the early gene E9L and late gene A27L were performed on non-TNBC and TNBC.S3 Fig
shows that, the expression of E9L is comparable in non-TNBC and TNBC cells two and four hours after infection and a difference in E9L expression is clearly visible eight hours after infec-tion. The late viral gene A27L was hardly detectable two and four hours after infection and its expression markedly increased eight hours post-infection in non-TNBC, while A27L expression remained low at this time-point in TNBC. To extend these data, the kinetics of bulk viral RNA-expression in non-TNBC versus TNBC cells infected with VV was determined using another pair of donors.Fig 1Fshows that the difference in expression of early viral genes in non-TNBC versus TNBC cells is detectable and is statistically significant. However, this difference is much greater for intermediate and late viral gene expression. Altogether, these data suggest that although infection/very early viral gene expression is statistically significantly lower in TNBC than in non-TNBC cells, the number of mininuclei, the replication of the virus and subsequent expression of the intermediate and late viral gene are quantitatively much more affected.
Single-cell RNA sequencing to dissect VV infection of TNBC cells: impact
of the infection on cellular genes
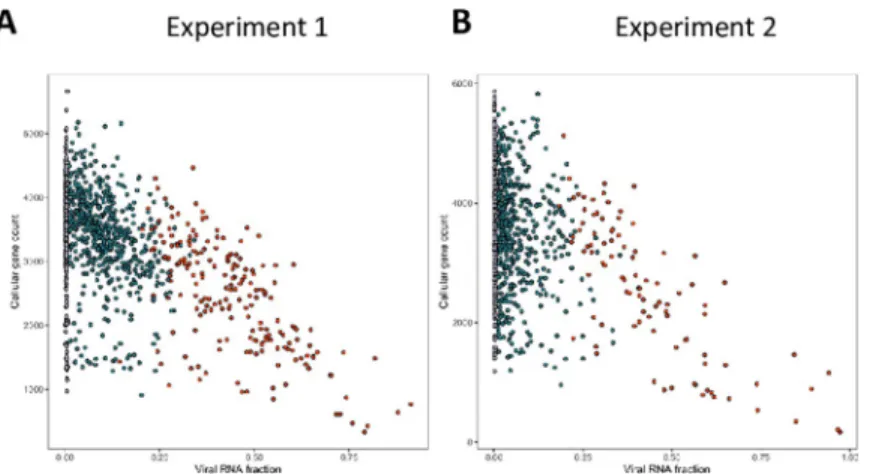
To characterize further the infection of TNBC cells by VV, we performed single-cell transcrip-tomic analyses. In these experiments, two independent TNBC primary cell cultures were either mock infected or infected with VV at a MOI of five. Six hours later, the cells were trypsinized and subjected to the 10X Genomics single-cell protocol, followed by sequencing.Fig 2shows
Fig 2. Correlation of cellular and viral genes expression measured by single-cell RNA sequencing. Cells from two independent TNBC were either mock infected or infected with VV (MOI = 5). Six hours later the cells were subjected to the 10X Genomics single-cell protocol, followed by sequencing. Dots represent cells positioned according to the percentage of viral gene expression (x-axis) and the number of cellular genes expressed (y-axis). Black dots represent mock infected cells, blue dots cells expressing early viral genes and red dots cells expressing early and late viral genes. A: experiment 1; B: experiment 2. Details of the samples used to obtain these data are listed inS1 Table.
that in the two experiments performed, the number of cellular genes expressed decreased as the extent of viral gene expression increased. More specifically, the number of cellular genes expressed was in the same range in the mock-infected cells (black dots) and in the cells expressing only the early viral genes (blue dots), while the decrease in expression of cellular genes was pronounced in cells expressing late viral genes (red dots).
Differential expression analysis using na
ïve, bystander and infected cells
For the two experiments, a standard statistical analysis using Seurat v3 was performed using cells with a percentage of mitochondrial genes below 25%. On the UMAP plots produced, the cells segregated in three (experiment 1,Fig 3A) and four (experiment 2,Fig 4A) clusters. Each cluster contained both control cells and cells exposed to the virus (Figs3Band4B). Three dis-tinct cellular populations were distinguished among the different clusters: naïve cells, defined as cells not exposed to VV; bystander cells, defined as cells exposed to the virus but expressing less than 0.01% of early viral genes; infected cells, defined as expressing more than 0.01% of early viral genes. Naïve, bystander and infected cells were localized onto the UMAP plot (Figs3Cand
4C) and the three cell types were present in all the three (Fig 3C) or four (Fig 4C) clusters. The quantitative analysis of the number of naïve bystander and infected cells in each cluster is
Fig 3. Single-cell transcriptomic analysis of TNBC infected with VV (experiment 1). Cells from TNBC were either mock infected or infected with VV (MOI = 5). Six hours later the cells were subjected to the 10X Genomics single-cell protocol, followed by sequencing. A: UMAP representing the three clusters annotated “COL1A2”, “SCRG1” and “KRT14” as these genes are top discriminents for the three clusters. B: Repartition of the cells incubated (red) or not (grey) with the virus. C: Repartition of naïve, bystander and infected cells in the three clusters. D: Venn diagram representing genes that are modulated in bystander versus naïve cells and infected versus bystander cells. The pattern of expression of the genes commonly regulated in the two differential analyses is presented as a heat-map. Red: gene upregulated, green gene down regulated. E: Ingenuity Pathways Analysis showing the upstream regulators describing differentially expressed genes in bystander versus naïve cells and infected versus bystander cells. Orange: pathway activated; blue: pathway inhibited. F: Example of genes that are part of the IFNγ pathway inversely regulated in bystander versus naïve cells and infected versus bystander cells. Genes in red are up-regulated and genes in green are down-regulated. Only four out of 44 genes (9.1%) are regulated in the same direction in the two conditions. These genes are noted:�. Details of the samples used to obtain these data are listed inS1 Table.
presented inTable 1. This analysis indicated that the “COL1A2” clusters showed a higher pro-portion of bystander cells in the two experiments. Assuming that a higher propro-portion of bystander cells within a cluster is associated with an increased refractoriness to the virus, we looked at the upstream regulators associated with the two “COL1A2” clusters using Ingenuity Pathway Analysis (IPA) analysis. The transcriptomic signatures of the cells showed, for these two clusters, a pattern highly consistent with “TGF-β” as a major upstream regulator (S4 Fig).
Single-cell transcriptomics provides a unique opportunity to describe, at the molecular level, the effects on cells of both the presence of VV in the culture medium, and of cellular infection with VV. The comparison of the gene expression profiles in bystander versus naïve cells provides information on the effects of the presence of the virus in culture medium on cell that have not been infected, as well as effects that factors secreted by virus-infected cells may have on non-infected cells. The comparison of the gene expression profiles in virus-non-infected versus bystander cells documents the changes in gene expression triggered by viral infection of cells. The data sets of these two differential expression analyses are presented inS2 Table(experiment 1) andS3 Table(experiment 2).Fig 3Dshows that 200 genes were commonly regulated in bystander-ver-sus-naïve and infected-versus-bystander cells. The genes upregulated in the bystander-versus-naïve analysis were found to be downregulated in the infected-versus-bystander analysis and
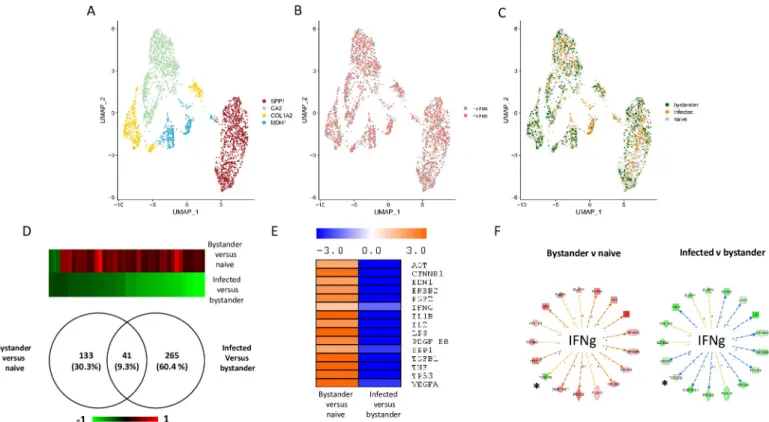
vice-Fig 4. Single-cell transcriptomic analysis of TNBC infected with VV (experiment 2). Cells from TNBC were either mock infected or infected with VV (MOI = 5). Six hours later the cells were subjected to the 10X Genomics single-cell protocol, followed by sequencing. A: UMAP plot representing the four clusters annotated “SPP1”, “CA2”, “COL1A2” and “MDH1” as these genes are top discriminant for the four clusters. B: Repartition of the cells incubated (red) or not (grey) with the virus. C: Repartition of naïve, bystander and infected cells in the four clusters. D: Venn diagram representing genes that are modulated in bystander versus naïve cells and infected versus bystander cells. The pattern of expression of the genes commonly regulated in the two differential analyses is presented as a heat-map. Red: gene upregulated, green gene down regulated. E: Ingenuity Pathways Analysis showing the upstream regulators describing differentially expressed genes in bystander versus naïve cells and infected versus bystander cells. Orange: pathway activated; blue: pathway inhibited. F: Example of genes that are part of the IFNγ pathway inversely regulated in bystander versus naïve cells and infected versus bystander cells. Genes in red are up-regulated and genes in green are down-regulated. Only one out of 17 genes (5.9%) are regulated in the same direction in the two conditions. This genes is noted:�. Details of the samples used to
obtain these data are listed inS1 Table.
versa (Fig 3D). IPA analysis of the differentially expressed genes provided information on the upstream regulators describing the differences between bystander and naïve cells and between infected and bystander cells.Fig 3Eshows that activation of the pathways regulated by, for exam-ple, TGF-β1, TNF, IL1β and IFN-γ can be observed when bystander cells are compared with naive cells. This pattern is likely to reflect the reaction of bystander cells to the presence of the virus in the culture medium and to the secretion of various cytokines by cells infected with VV. By contrast, these pathways were inhibited when the IPA analysis was performed on the differen-tially expressed genes between infected cells and bystander cells (Fig 3E). A similar phenomenon was observed in the second experiment (Fig 4D and 4E). However, in this second experiment, the number of genes modulated in bystander-versus-naïve cells was lower than that observed in experiment 1 (41 genes, seeFig 4D). As the TNBC cells used in experiment 2 are 10 times less sen-sitive to the virus than those used in experiment 1 (S5 Fig), these differences may be attributed to a blunted ability of cells more resistant to the virus to respond to the presence of the virus in the culture medium and to stimuli secreted by infected cells. Finally, the striking contrasts between bystander-versus-naïve cells and infected-versus-bystander cells were also observed at the level of individual pathways. For example, more than 90% of genes of the IFNγ pathway that were regu-lated in a particular direction in bystander-versus-naïve cells were reguregu-lated in the opposite direc-tion in the infected-versus-bystander cells (Figs3Fand4F).
Identification of genes over-represented in bystander versus infected cells
We hypothesized that genes with “antiviral” activities were overrepresented in the bystander compared with the infected population of cells.Fig 5Ashows the Venn diagram of the genes differentially expressed in bystander cells in experiments 1 and 2. Under our hypothesis, the 130 genes commonly regulated are candidate genes with antiviral activities (complete list inS4 Table). IPA analysis showed that these genes were consistent with an activation of the path-ways regulated by TGFβ1, LPS, TNF, CTNNB1 and IL1β (Fig 5A), suggesting that activation of these pathways is associated with an antiviral action. The comparison of the 130 candidates with genes identified as potential anti-viral genes in high-throughput RNAi screens showed that only one gene, SERPINE1 was found in common with the studies of Beard et al. [12] and none with the study of Sivan et al. [11] (Fig 5B).
DDIT4 exerts an antiviral activity
An alternative way to analyze the dataset is to consider each individual cluster in each experi-ment. This analysis grants less weight to clusters with high numbers of cells. We used the
Table 1. Repartition of the numbers of naïve, bystander and infected cells in the different clusters. In both cases, the cluster defined as “COL1A2” contains the higher proportion of bystander cells.
Clusters Naive Bystander Infected Ratio Bystander/Infected Experiment 1 COL1A2 510 418 271 1.54 KRT14 42 20 33 0.61 SCRG1 602 75 437 0.17 Experiment 2 COL1A2 256 156 55 2.84 CA2 503 258 188 1.37 SPP1 576 262 193 1.36 MDH1 136 73 107 0.68 https://doi.org/10.1371/journal.ppat.1008660.t001
FindConservedMarkers command in Seurat v3 to run differential expression tests cluster by cluster in order to identify the conserved markers between bystander and infected cells. We required a gene to have a log2(Fold Change) > 0.25 and a maximum Bonferroni-corrected P
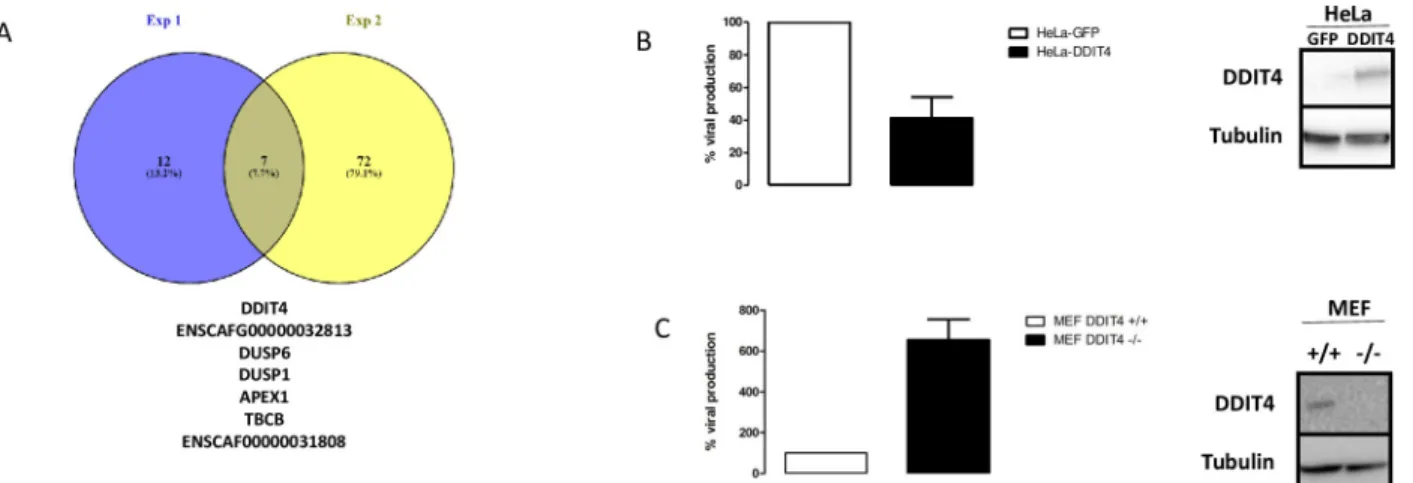
value threshold < 0.05 to be considered as a conserved marker. This analysis identifies genes that are differentially regulated between two conditions (i.e. bystander versus infected) across all clusters in one experiment. We identified 19 and 79 conserved genes in experiments 1 and 2, respectively. Interestingly, only seven genes were conserved between the two experiments (Fig 6A). Two of these genes were canine genes for which human homologs have not been identified (ENSCAFG00000032813 and ENSCAF00000031808). The five remaining genes are APEX1, DDIT4, DUSP6, TBCB and DUSP1. The latter has already been shown to be detri-mental to vaccinia virus [8].
We focused on one particular gene (DDIT4) in the list presented inFig 6A, as high DDIT4 expression has been associated with a poor prognosis in various malignancies including breast cancer [30], and in TNBC [31]. We examined the effect of DDIT4 on VV replication. Infection of HeLa cells overexpressing DDIT4 resulted in a 60% reduction in the production of infec-tious VV particles compared with control HeLa cells expressing GFP (Fig 6B). Inversely, infec-tion of mouse embryonic fibroblast (MEF) cells obtained from DDIT4 knock out mice resulted in a six-fold increase in the production of infectious VV particles compared with MEF isolated from wild-type mice (Fig 6C).
Discussion
We demonstrated that oncolysis induced by VV in primary, high-grade canine mammary car-cinoma cells was significantly less efficient than in equivalent cells obtained from lower grade tumors. This observation is in sharp contrast with the fact that the same virus was equally effi-cient in established cell lines from differentiated/low-grade and high-grade human TNBC.
Fig 5. Analysis of the differentially expressed genes in bystander versus infected cells. A: Venn diagram of the differentially expressed genes in bystander versus infected cells in experiments 1 and 2. A total of 130 genes are commonly regulated. Ingenuity Pathways Analysis showed that these genes were consistent with an activation of the pathways regulated by TGFβ1, CTNNB1, LPS, TNF and IL1β. The z-score for each pathway is presented. B: Comparison of the potential “antiviral genes” in the present study and in the studies of Sivan et al. [11] and Beard et al. [12].
Considering the close relationship between the human and canine pathologies [32], it is tempt-ing to attribute this difference in effectiveness of VV to the primary/low passage versus estab-lished cell line status of the experimental models. The relevance of estabestab-lished cell lines as experimental systems to develop new cancer therapeutic agents has been questioned in the past and the need for new preclinical models has been highlighted [33]. Patient-derived xeno-grafts have been proposed and are viewed as one of the most relevant model systems in oncol-ogy [34]. For a selected number of tumor types including breast cancer, canine tumors recapitulate the features of human tumors and resources from relevant canine tumors have been proposed as tools for the preclinical development of new cancer therapeutics [35]. One of these resources is very-low-passage primary cells grown in serum-free medium. Working with primary low-passage cells has to date been hampered by the small number of cells available from biopsies. It is rare to collect more than 2–3 million carcinoma cells from one biopsy, and, without amplification, this low number of cells considerably restricts the information that can be gathered experimentally. However, with the advent of single-cell transcriptomics, descrip-tive studies demonstrating whether a therapeutic agent is effecdescrip-tive or not can be comple-mented with high-resolution molecular data.
Single cell transcriptomic has been used previously in the field of infectious diseases. For example, the extreme heterogeneity of influenza virus infection [36] and influenza infection of mouse lungs in vivo [37] have been examined with this tool. However, to our knowledge, this technique has never been applied to the study of poxvirus infection. First, our study confirms the well-documented transcriptional down of cellular genes. In our dataset, this shut-down was correlated to the extent of viral gene expression (Fig 2). A unique feature of single-cell transcritptomic analysis is the possibility to identify different populations of single-cells that have been in contact with the virus. Cells expressing intermediate and late viral genes express a low number of cellular genes. Their inclusion in the analysis did not provide any particular infor-mation for identification of antiviral genes. By contrast, bystander cells (cells exposed to the
Fig 6. Analysis of the differentially expressed genes in bystander versus infected cells using the “conserved markers” strategy. A: Venn diagram of the differentially-expressed genes in bystander versus infected cells in experiments 1 and 2, using a conserved marker analysis. The 7 commonly regulated genes in the two experiments are indicated. ENSCAFG00000032813 and ENSCAF00000031808 are canine genes without human homologs. B Three days after VV infection, HeLa-GFP (white bars) or HeLa-DDIT4 (black bars) cells were collected, homogenized and the number of infectious particles generated in 30μL homogenate were titrated. The results are expressed as the percentage of infectious particles obtained from HeLa-GFP cells. A western blot showing the over-expression of DDIT4 in HeLa-DDIT4 compared to HeLa-GFP is presented. C: Three days after VV infection, wild-type MEF (white bars) or MEF DDIT4-/-(black bars) were collected, homogenized and the number of infectious particles generated in 30μL of homogenates were titrated. The results are expressed as the percentage of infectious particles obtained from wild-type MEFs. A western blot showing the down-regulation of DDIT4 in MEF DDIT4 knock out compared to MEF wild type is presented. For B and C, the results are the mean +/- SD of three independent determinations.
virus and expressing less than 0.01% of viral genes) provided a unique source of information. Comparison of bystander and naïve cells showed an activation of the pathways regulated by cytokines and growth factors in bystander cells. These activations are likely to be the result of the combined action of the pathogen-associated molecular pattern of the virus as well as auto-crine factors secreted by infected and dying cells. The comparison of the activations observed in the two single-cell transcriptomic experiments shows that in the second experiment involv-ing a culture of TNBC cells more refractory to the virus, a blunted response was observed, including the number of genes and the degree of modulation of the regulated genes. Inversely, an inhibition of cytokine and growth factor pathways could be observed when infected versus bystander cells were compared. These inhibitions are likely to have resulted from the expres-sion of viral genes that counteract the cellular responses.
Our study demonstrates that tinformation gathered through single-cell RNA-seq can lead to the identification of pathways with potential antiviral properties. We hypothesized that genes with “antiviral” activities were overrepresented in the bystander compared with infected cell population. Differential expression analysis on the bulk set of data identified 130 genes commonly overrepresented in the bystander populations in the two experiments performed. IPA analysis identified upstream regulators likely to produce these expression profiles (Fig 5A). The constitutive activation of the interferon pathway has been already documented as an “anti-oncolytic” mechanism for different viruses [38,39], and this pathway, as well as general pathways associated with inflammatory responses (IL1β, lipopolysaccharides (LPS) TNF) were also identified in our dataset with poxvirus infection (Fig 5A). Additional pathways appear to characterize cells from the bystander population: CTNNB1 (β-catenin) and TGF-β (Fig 5A), the latter having already been identified as characteristic for the COL1A2 cluster showing increased “resistance” to poxvirus (Table 1). These two pathways, associated with “inflamma-tory” pathways, have been widely implicated in the epithelial to mesenchymal transition (EMT) in general and in EMT in breast cancer in particular [40–42]. It is therefore tempting to postulate that cells with a higher “EMT index” would be less sensitive to vaccinia virus. This hypothesis will need to be thoroughly tested in future studies.
A list of 130 candidates is presented inS4 Table. The comparison with genes identified as potential anti-viral genes in high throughput RNAi screens showed that only one gene, SER-PINE1, was found in common with these studies (Fig 5B). This low overlap is hardly surprising considering that both the virus and the cells were different in these screens. Nevertheless, this highlights the complexity of the interactions of vaccinia virus with host cells.
An analysis taking into account the individual clusters provided a more stringent test, with only seven genes emerging as commonly over-represented in bystander cells in the two experi-ments (Fig 6A). Two of those are canine genes with no known human homolog. The five remaining genes are APEX1, DDIT4, DUSP1, DUSP6 and TBCB. The fact that DUSP1 expres-sion has already been demonstrated to be detrimental to vaccinia virus [8] provides a reassur-ance of the validity of the hypothesis whereby “antiviral” genes are overexpressed in the bystander populations, and highlights the relevance of the methodology we used. The proteins encoded by DUSP1 and DUSP6 are phosphatases with dual specificity for tyrosine and serine. These proteins can dephosphorylate MAPK1/ERK2. DUSP1 has been shown to be involved in the replication and host range of vaccinia virus and in the regulation of host immune
responses through the modulation of MAPKs [8]. Although DUSP1 and DUSP6 have been attributed different roles, in immune regulation and development, respectively [43], they may exert antiviral activities through similar mechanisms. Tubulin folding cofactorB (TBCB) has been shown to be required for microtubule network formation [44] but, to our knowledge, an involvement of TBCB in viral infection has never been shown. However, considering the major cytoplasmic reshuffle observed in vaccinia-virus-infected cells, a negative role of TBCB
would not be surprising. APEX1 is a major apurinic/apyrimidic (AP) endonuclease in human cells. AP sites are pre-mutagenic lesions and this enzyme is therefore part of the DNA repair machinery [45]. Relationships between APEX1 and viral infection have been documented: inhibition of APEX1 redox activity affects Kaposi’s sarcoma-associated herpes virus [46] and its knock down inhibits HIV1 and HIV2/SIV infection [47]. However, a role of APEX1 in the vaccinia virus lytic cycle has never been reported.
We decided to investigate whether DNA damage-inducible transcript 4 (DDIT4) affects VV replication and we showed, using gain- and loss-of function studies that this is the case (Fig 6B and 6C). DDIT4 is expressed in breast cancer and is associated with a poor prognosis in various cancers including breast cancers [30]. In high-grade triple-negative breast cancers, DDIT4 is also associated with a poor prognosis in human patients [31]. This observation positions DDIT4 as a potential marker that may also be associated with a lower response to oncolytic vaccinia virus. Considering the association of DDIT4 with a worse prognosis in human patients with acute mye-loid leukemia, glioblastoma multiform, colon, skin and lung cancers in addition to breast cancer [30], future preclinical and clinical studies should determine the real importance of this gene in the response of various cancer types to oncolytic VV. DDIT4 is an interferon-stimulated gene with anti-retrovial activity [48]. Biochemically, DDIT4 has been described as a negative regulator of the mTOR signaling pathway [49–51]. Rapamycin, a pharmacological inhibitor of the mTOR signaling pathway, has also been reported to reduce virus yield upon VV infection [52]. A possible mechanism may be that mTOR activation results in the phosphorylation of 4E-BP, which in turn releases the translation factor elF4E, the component of el4F that binds to the 5’-cap structure of mRNA and promotes translation [52,53]. Upon VV infection, the factor elF4E has been reported to be redistributed in cavities present within viral factories [27,54] where viral translation can proceed. It is therefore tempting to hypothesize that DDIT4, by inhibiting the mTOR signaling pathway, reduces the amount of elF4E available for viral translation. However, considering the complexity of mTOR effects on VV infection [55], the exact nature of the molecular events associ-ated with the inhibitory effect of DDIT4 remains to be elucidassoci-ated.
Finally, the identification of cellular genes promoting or restricting vaccinia virus infectiv-ity/replication has been studied using hypothesis-driven approaches [8,9,56] or high-throughput RNA interference screens [10–13] and in this context single-cell transcriptomics increases the arsenal of experimental tools available. Considering the large transgene capacity of poxviruses, this information could be exploited to generate new generations of oncolytic poxviruses with more efficient direct oncolytic properties.
Materials and methods
Cells
Very low passage canine primary cell cultures were provided by Lucioles Consulting. They were derived from a panel of canine primary tissues including normal mammary tissues, hyperplastic lesions, benign tumors, carcinomas in situ and all grades of carcinomas. The list of the different biopsies and their utilization in the different experiments of this report are pro-vided inS1 TableandS5 Table. The tissues were phenotyped using standard histopathology and immunohistochemistry techniques and the ER, PR and HER2 status in relevant samples was determined (S6 Table). Cell survival assays were performed as previously described [57]. BHK21, MCF7, MDA-MB231, HeLa and DDIT4 +/+ and -/- MEF cells were obtained and cul-tured as previously described [50,58–62]. Fluorescence imaging and Western blots were per-formed as previously described [63,64]. Quantification of the number of fluorescent cells as well as the intensity of fluorescence was performed using the CellQuant program (available at:
Viruses
A Lister strain deleted in the thymidine kinase gene (referred to as VV) and VACV-Copenhagen recombinants encoding GFP downstream of a synthetic early promoter (VACV-Cop21 and VACV-Cop 32) were described previously [65,66]. Vaccinia virus titration was performed on BHK21 cell monolayers infected for two days and stained with neutral red. Len-tiviruses (encoding either GFP or DDIT4) were purchased from Sigma-Aldrich and are part of the MISSION TRC3 LentiORF collection.
qPCR assay for generic detection of Orthopoxvirus
DNA was extracted using the QIAamp DNA Mini Blood kit (QIAgen). The qPCR assay used for the detection of orthopoxviruses was a modification of the assay described by Scaramoz-zino et al [67]. Probes were designed to amplify a 157 bp fragment of orthopoxvirus A27L gene. Each qPCR assay was carried out in 20μl reaction mixture containing 5μl extracted DNA as template, 400 nM of each primer and 250 nM of probe and 10μl IQ Supermix for QPCR (Biorad). The reaction was performed as follows: 1 cycle at 95˚C for 3 min, followed by 45 cycles each at 95˚C for 15 s, followed by 62˚C for 60 s. A fluorescence reading was taken at the end of each 62˚C step. Data acquisition and analysis were carried out with the Bio-Rad CFX Manager software 3.1. Sample curves were analyzed using the second derivative. Each DNA solution was assayed in duplicate per qPCR assay. Standard curves were generated from serial dilution of a solution of pVACV_Lis-A27L enabling absolute quantification.
qPCR assay for generic detection of early and late genes, E9L and A27L
respectively, and a housekeeping gene
Total RNA was extracted using the RNAeasy kit (Qiagen). Reverse-transcription was per-formed using the PrimeScript RT Reagent Kit (Perfect Real Time, TAKARA). The A27L (late gene) qPCR assay was performed as described above. The E9L (early gene) and beta-actin qPCR were performed as described by Kulesh et al.[68] and Piorkowski et al. [69], respectively, with slight modifications. Each qPCR assay was carried out in 20μl reaction mixture contain-ing 5μl cDNA as template, 300 nM of each primer and 100 nM of probe and 10 μl IQ Supermix for qPCR (Biorad). Each DNA solution was assayed in duplicate per qPCR assay. Standard curves were generated from serial dilution of a supernatant of a vaccinia virus-Copenhagen strain-infected culture. PCR efficiencies of both the targets genes and the reference gene were between 90% and 110% and did not differ by more than 10%. The delta Ct method was then used for relative quantification.
Bulk RNA sequencing
Cells were either mock infected or infected at a MOI of 5 with VV. At different time after infection, cells were washed with PBS. Poly(A) RNAs were purified using a Dynabeads mRNA purification kit (Invitrogen) and fragmented for 7 min at 95˚C. Libraries were then generated with the Ion Total RNA seq kit V2 (Life technologies) and sequenced on the Ion Proton system with P1 chip V3 following the manufacturer’s instructions. Reads were aligned to the dog genome release canFam3 and the Vaccinia virus genome release NC006998 with bowtie v2-2.2.4. Quantification of genes was then performed using HTSeq-count release HTSeq-0.6.1 with “—minaqual = 0—mod = intersection-nonempty” options. To assess the response differ-ences to the viral infection between non TNBC and TNBC samples, we used the classification of early, intermediate and late poxvirus genes described previously [70]. P-values on boxplots were calculated by the Wilcoxon rank sum test.
Single cell RNA-sequencing
Single cell suspensions were converted to barcoded scRNA-seq libraries using the Chromium Single Cell 3’ Library, Gel Bead & Multiplex Kit and Chip Kit (10x Genomics), aiming for an estimated 2000 cells per library and following the manufacturer’s instructions. Samples were processed using kits pertaining to V2 barcoding chemistry of 10x Genomics. Libraries were sequenced on an Illumina NextSeq500 with a High Output v2 kit (150 cycles): the forward read had a length of 26 bases that included the cell barcode and the UMI; the reverse read had a length of 98 bases that contained the cDNA insert. Raw sequencing FASTQ files were ana-lyzed within 10x Genomics CellRanger suite (v1.3.0) with a transcriptome reference composed of canFam3 Canis familiaris genome build and the Vaccinia virus complete genome (NCBI reference sequence NC_006998).
Single cell gene expression quantification and determination of the major
cell types
Raw gene expression matrices generated with 10xGenomics CellRanger suite (v1.3.0) were loaded and processed into R (version 3.5.2). Both experiments were analyzed independently using the Seurat R package (version 3.0.0). First, all cells that had over 25% of mitochondrial RNAs were removed. From the remaining cells, gene expression matrices were normalized using the SCTransform method. To reduce dimensionality, variably expressed genes were summarized by principle component analysis, and the 30 PCs were further summarized using UMAP dimensionality reduction. Both samples (i.e. infected and not infected) from the two experiments (i.e. 1 and 2) were then aggregated using FindIntegrationAnchors and Integrate-Data functions preceded by the PrepSCTIntegration function described in the Seurat develop-ment version. Clusters were called using a low resolution of 0.1, and gene markers were assessed using FindAllMarkers function with standard parameters.
Supporting information
S1 Fig. Efficacy of VV on primary normal canine mammary epithelial cells. Primary normal
canine mammary epithelial cells cells were infected at different MOIs with VV. Fours days later, the remaining cells were estimated using a MTT assay. The results are presented as a per-centage of cell-survival in uninfected cells and are mean +/- SEM of six different experimental points. This result is representative of two independent determinations.
(PPTX)
S2 Fig. Primary canine TNBC cells infected with a vaccinia virus-Copenhagen exhibit a reduced numbers of mininuclei compared to primary canine non-TNBC cells. Non-TNBC
(A, B) or TNBC (C, D) cells were infected with a vaccinia virus-Copenhagen strain recombi-nant in which GFP expression is driven by an immediate-early vaccinia virus promoter (MOI = 5). Three hours after infection, the cells were fixed and stained with propidium iodide (PI). A and B: GFP staining; C and D: propidium iodide staining; M: mininuclei. F, G, H, I. Non-TNBC (white bars) or TNBC (black bars) cells were infected with a vaccinia virus-Copen-hagen strain recombinant in which GFP expression is driven by an immediate-early vaccinia virus promoter (MOI = 5). Three hours after infection, the cells were fixed and stained with propidium iodide (PI). The number of PI and GFP positive cells was determined. The percent-age of GFP+ cells (F), the mean GFP fluorescence per cell (G), the percentpercent-age of mini-nuclei in GFP+ cells (H) and the number of mini-nuclei in nuclei-positive cells (I) are presented. (��� p < 0.001;��p < 0.01;�p < 0.05; n.s: p > 0.05). The data were obtained from the analysis of
detail of the samples used to obtain these data is listed inS5 Table. (PPTX)
S3 Fig. Differential expression of the E7L and late A27L genes in a pair of non-TNBC and TNBC canine primary cells. Non-TNBC (white bars) or TNBC (black bars) cells were
infected at MOI of 0.1 and total RNA were extracted 2, 4 and 8 hours post-infection. The levels of expression of E9L and A27L were determined by quantitative RT-PCR and normalized to the expression of beta-actin.
(PPTX)
S4 Fig. Network of genes associated with an activation of TGF-b1 in the clusters COL1A2.
The genes caracteristic of the clusters COL1A2 in the two experiments were anaylsed using IPA. In both cases the transcriptomic signature is associated with TGF-b1 and the top upstream regulator. A: Experiment 1: 69 out of 99 genes consistent with an activation of TGF-b1 (z score 7,037). B: Experiment 2: 77 out of 102 genes have measurements consistent with an activation of TGF-b1 (z score 7,933).
(PPTX)
S5 Fig. Comparison of the efficacy of VV on cells from the two TNBC samples used in the single cell transcriptomics experiment. Primary canine cells from TNBC origin used in
sin-gle-cell transcriptomics experiments 1 and 2 were infected at different MOIs with VV. Fours days later, the remaining cells were estimated using a MTT assay. The results are presented as a percentage of cell-survival in uninfected cells and are mean +/- SEM of six different experi-mental points. This result is representative of two independent determinations.
(PPTX)
S1 Table. S1A Table: Differential expression of genes in bystander versus naïve cells ment 1). S1B Table: Differential expression of genes in infected versus bystander cells (Experi-ment 1).
(DOCX)
S2 Table. S2A Table: Differential expression of genes in bystander versus naïve cells (Experiment 2). S2B Table: Differential expression of genes in infected versus bystander cells (Experiment 2). (XLSX)
S3 Table. List of genes 130 genes commonly regulated in bystander versus infected cells in the two experiments.
(XLSX)
S4 Table. Breed, age and type of tissue used to extract low passage, primary cells.
(XLSX)
S5 Table. Histological types and utilization of the cells from the different specimen in the figures of the manuscript.
(DOCX)
S6 Table. Estrogen receptor (ER), progesterone receptor (ER) and human epidermal growth factor receptor 2 (HER2) status of relevant biopsies used in this study.
(DOCX)
Acknowledgments
Special thanks are due to Dr Robert Drillien (Strasbourg, France) for providing viruses, help and protocols in vaccinia handling and careful reading of the manuscript.
Author Contributions
Conceptualization: Be´atrice Cambien, Robert Barthel, Bernard Mari, Georges Vassaux. Data curation: Kevin Lebrigand, Alberto Baeri, Nicolas Nottet, Robert Barthel, Georges
Vassaux.
Formal analysis: Kevin Lebrigand, Alberto Baeri, Nicolas Nottet, Georges Vassaux. Funding acquisition: Bernard Mari, Georges Vassaux.
Investigation: Be´atrice Cambien, Catherine Compin, Audrey Lamit, Olivier Ferraris,
Chris-tophe N. Peyrefitte, Virginie Magnone, Laure-Emmanuelle Zaragosi, Sophie Giorgetti-Peraldi.
Methodology: Be´atrice Cambien, Alberto Baeri, Catherine Compin, Olivier Ferraris,
Chris-tophe N. Peyrefitte, Virginie Magnone, Laure-Emmanuelle Zaragosi, Marine Gautier-Isola, Roger Rezzonico, Pascal Barbry.
Project administration: Laure-Emmanuelle Zaragosi, Pascal Barbry, Bernard Mari. Resources: Sophie Giorgetti-Peraldi, Fre´de´ric Bost, Roger Rezzonico, Pascal Barbry, Robert
Barthel, Bernard Mari.
Software: Kevin Lebrigand, Alberto Baeri, Je´roˆme Henriques.
Supervision: Be´atrice Cambien, Pascal Barbry, Bernard Mari, Georges Vassaux. Validation: Catherine Compin, Audrey Lamit, Fre´de´ric Bost, Marine Gautier-Isola. Visualization: Marine Gautier-Isola, Roger Rezzonico.
Writing – original draft: Be´atrice Cambien, Kevin Lebrigand, Georges Vassaux.
Writing – review & editing: Be´atrice Cambien, Alberto Baeri, Nicolas Nottet, Robert Barthel,
Georges Vassaux.
References
1. Kirn DH, Thorne SH. Targeted and armed oncolytic poxviruses: a novel multi-mechanistic therapeutic class for cancer. Nat Rev Cancer. 2009; 9(1):64–71. Epub 2008/12/24.https://doi.org/10.1038/nrc2545
nrc2545 [pii]. PMID:19104515.
2. Heise C, Kirn DH. Replication-selective adenoviruses as oncolytic agents. J Clin Invest. 2000; 105 (7):847–51. Epub 2000/04/05.https://doi.org/10.1172/JCI9762PMID:10749561; PubMed Central PMCID: PMC377494.
3. Breitbach CJ, Arulanandam R, De Silva N, Thorne SH, Patt R, Daneshmand M, et al. Oncolytic vaccinia virus disrupts tumor-associated vasculature in humans. Cancer Res. 2013; 73(4):1265–75. Epub 2013/ 02/09.https://doi.org/10.1158/0008-5472.CAN-12-26870008-5472.CAN-12-2687 [pii]. PMID:
23393196.
4. Breitbach CJ, Parato K, Burke J, Hwang TH, Bell JC, Kirn DH. Pexa-Vec double agent engineered vac-cinia: oncolytic and active immunotherapeutic. Curr Opin Virol. 2015; 13:49–54. Epub 2015/04/23.
https://doi.org/10.1016/j.coviro.2015.03.016S1879-6257(15)00047-4 [pii]. PMID:25900822.
5. Thorne SH. Immunotherapeutic potential of oncolytic vaccinia virus. Immunol Res. 2011; 50(2–3):286– 93. Epub 2011/07/01.https://doi.org/10.1007/s12026-011-8211-4PMID:21717084.
6. Achard C, Surendran A, Wedge ME, Ungerechts G, Bell J, Ilkow CS. Lighting a Fire in the Tumor Micro-environment Using Oncolytic Immunotherapy. EBioMedicine. 2018; 31:17–24. Epub 2018/05/05. S2352-3964(18)30148-8 [pii].https://doi.org/10.1016/j.ebiom.2018.04.020PMID:29724655; PubMed Central PMCID: PMC6013846.
7. Marelli G, Howells A, Lemoine NR, Wang Y. Oncolytic Viral Therapy and the Immune System: A Dou-ble-Edged Sword Against Cancer. Front Immunol. 2018; 9:866. Epub 2018/05/15.https://doi.org/10. 3389/fimmu.2018.00866PMID:29755464; PubMed Central PMCID: PMC5932159.
8. Caceres A, Perdiguero B, Gomez CE, Cepeda MV, Caelles C, Sorzano CO, et al. Involvement of the cellular phosphatase DUSP1 in vaccinia virus infection. PLoS Pathog. 2013; 9(11):e1003719. Epub 2013/11/19.https://doi.org/10.1371/journal.ppat.1003719PPATHOGENS-D-13-00073 [pii]. PMID:
24244156; PubMed Central PMCID: PMC3828168.
9. Ibrahim N, Wicklund A, Wiebe MS. Molecular characterization of the host defense activity of the barrier to autointegration factor against vaccinia virus. J Virol. 2011; 85(22):11588–600. Epub 2011/09/02.
https://doi.org/10.1128/JVI.00641-11JVI.00641-11 [pii]. PMID:21880762; PubMed Central PMCID: PMC3209281.
10. Mercer J, Snijder B, Sacher R, Burkard C, Bleck CK, Stahlberg H, et al. RNAi screening reveals protea-some- and Cullin3-dependent stages in vaccinia virus infection. Cell Rep. 2012; 2(4):1036–47. Epub 2012/10/23.https://doi.org/10.1016/j.celrep.2012.09.003S2211-1247(12)00284-7 [pii]. PMID:
23084750.
11. Sivan G, Martin SE, Myers TG, Buehler E, Szymczyk KH, Ormanoglu P, et al. Human genome-wide RNAi screen reveals a role for nuclear pore proteins in poxvirus morphogenesis. Proc Natl Acad Sci U S A. 2013; 110(9):3519–24. Epub 2013/02/13.https://doi.org/10.1073/pnas.13007081101300708110 [pii]. PMID:23401514; PubMed Central PMCID: PMC3587217.
12. Beard PM, Griffiths SJ, Gonzalez O, Haga IR, Pechenick Jowers T, Reynolds DK, et al. A loss of func-tion analysis of host factors influencing Vaccinia virus replicafunc-tion by RNA interference. PLoS One. 2014; 9(6):e98431. Epub 2014/06/06.https://doi.org/10.1371/journal.pone.0098431 PONE-D-14-14314 [pii]. PMID:24901222; PubMed Central PMCID: PMC4047015.
13. Sivan G, Ormanoglu P, Buehler EC, Martin SE, Moss B. Identification of Restriction Factors by Human Genome-Wide RNA Interference Screening of Viral Host Range Mutants Exemplified by Discovery of SAMD9 and WDR6 as Inhibitors of the Vaccinia Virus K1L-C7L- Mutant. MBio. 2015; 6(4):e01122. Epub 2015/08/06.https://doi.org/10.1128/mBio.01122-15e01122-15 [pii] mBio.01122-15 [pii]. PMID:
26242627; PubMed Central PMCID: PMC4526713.
14. Zhang Q, Yu YA, Wang E, Chen N, Danner RL, Munson PJ, et al. Eradication of solid human breast tumors in nude mice with an intravenously injected light-emitting oncolytic vaccinia virus. Cancer Res. 2007; 67(20):10038–46. Epub 2007/10/19. 67/20/10038 [pii]. https://doi.org/10.1158/0008-5472.CAN-07-0146PMID:17942938.
15. Gholami S, Chen CH, Lou E, De Brot M, Fujisawa S, Chen NG, et al. Vaccinia virus GLV-1h153 is effec-tive in treating and preventing metastatic triple-negaeffec-tive breast cancer. Ann Surg. 2012; 256(3):437–45. Epub 2012/08/08.https://doi.org/10.1097/SLA.0b013e3182654572PMID:22868370.
16. Khanna C. Leveraging Comparative Oncology in the Hopes of Improving Therapies for Breast Cancer. Semin Oncol. 2017; 44(4):301. Epub 2018/03/13. S0093-7754(17)30161-6 [pii].https://doi.org/10. 1053/j.seminoncol.2017.11.003PMID:29526259.
17. Paoloni M, Khanna C. Translation of new cancer treatments from pet dogs to humans. Nat Rev Cancer. 2008; 8(2):147–56. Epub 2008/01/19.https://doi.org/10.1038/nrc2273nrc2273 [pii]. PMID:18202698. 18. Khanna C, Lindblad-Toh K, Vail D, London C, Bergman P, Barber L, et al. The dog as a cancer model. Nat Biotechnol. 2006; 24(9):1065–6. Epub 2006/09/12. nbt0906-1065b [pii].https://doi.org/10.1038/ nbt0906-1065bPMID:16964204.
19. Pinho SS, Carvalho S, Cabral J, Reis CA, Gartner F. Canine tumors: a spontaneous animal model of human carcinogenesis. Transl Res. 2012; 159(3):165–72. Epub 2012/02/22.https://doi.org/10.1016/j. trsl.2011.11.005S1931-5244(11)00413-0 [pii]. PMID:22340765.
20. Gama A, Alves A, Schmitt F. Identification of molecular phenotypes in canine mammary carcinomas with clinical implications: application of the human classification. Virchows Arch. 2008; 453(2):123–32. Epub 2008/08/05.https://doi.org/10.1007/s00428-008-0644-3PMID:18677512.
21. Sassi F, Benazzi C, Castellani G, Sarli G. Molecular-based tumour subtypes of canine mammary carci-nomas assessed by immunohistochemistry. BMC Vet Res. 2010; 6:5. Epub 2010/01/30.https://doi.org/ 10.1186/1746-6148-6-51746-6148-6-5 [pii]. PMID:20109214; PubMed Central PMCID: PMC2837647. 22. Jaillardon L, Abadie J, Godard T, Campone M, Loussouarn D, Siliart B, et al. The dog as a
naturally-occurring model for insulin-like growth factor type 1 receptor-overexpressing breast cancer: an observa-tional cohort study. BMC Cancer. 2015; 15:664. Epub 2015/10/10. https://doi.org/10.1186/s12885-015-1670-6[pii]. PMID:26449867; PubMed Central PMCID: PMC4598970.
23. Nguyen F, Pena L, Ibisch C, Loussouarn D, Gama A, Rieder N, et al. Canine invasive mammary carci-nomas as models of human breast cancer. Part 1: natural history and prognostic factors. Breast Cancer Res Treat. 2018; 167(3):635–48. Epub 2017/11/01.https://doi.org/10.1007/s10549-017-4548-2[pii]. PMID:29086231; PubMed Central PMCID: PMC5807494.
24. Liu D, Xiong H, Ellis AE, Northrup NC, Rodriguez CO Jr., O’Regan RM, et al. Molecular homology and difference between spontaneous canine mammary cancer and human breast cancer. Cancer Res.
2014; 74(18):5045–56. Epub 2014/08/02.https://doi.org/10.1158/0008-5472.CAN-14-03920008-5472. CAN-14-0392 [pii]. PMID:25082814; PubMed Central PMCID: PMC4167563.
25. Kim NH, Lim HY, Im KS, Kim JH, Sur JH. Identification of triple-negative and basal-like canine mam-mary carcinomas using four basal markers. J Comp Pathol. 2013; 148(4):298–306. Epub 2012/10/20.
https://doi.org/10.1016/j.jcpa.2012.08.009S0021-9975(12)00156-9 [pii]. PMID:23079102.
26. Abadie J, Nguyen F, Loussouarn D, Pena L, Gama A, Rieder N, et al. Canine invasive mammary carci-nomas as models of human breast cancer. Part 2: immunophenotypes and prognostic significance. Breast Cancer Res Treat. 2018; 167(2):459–68. Epub 2017/10/25. https://doi.org/10.1007/s10549-017-4542-8[pii]. PMID:29063312; PubMed Central PMCID: PMC5790838.
27. Katsafanas GC, Moss B. Colocalization of transcription and translation within cytoplasmic poxvirus fac-tories coordinates viral expression and subjugates host functions. Cell Host Microbe. 2007; 2(4):221–8. Epub 2007/11/17. S1931-3128(07)00215-6 [pii].https://doi.org/10.1016/j.chom.2007.08.005PMID:
18005740; PubMed Central PMCID: PMC2084088.
28. Cairns J. The initiation of vaccinia infection. Virology. 1960; 11:603–23. Epub 1960/07/01.https://doi. org/10.1016/0042-6822(60)90103-3PMID:13806834.
29. Yang Z, Bruno DP, Martens CA, Porcella SF, Moss B. Simultaneous high-resolution analysis of vaccinia virus and host cell transcriptomes by deep RNA sequencing. Proc Natl Acad Sci U S A. 2010; 107 (25):11513–8. Epub 2010/06/11.https://doi.org/10.1073/pnas.1006594107[pii]. PMID:20534518; PubMed Central PMCID: PMC2895082.
30. Pinto JA, Rolfo C, Raez LE, Prado A, Araujo JM, Bravo L, et al. In silico evaluation of DNA Damage Inducible Transcript 4 gene (DDIT4) as prognostic biomarker in several malignancies. Sci Rep. 2017; 7 (1):1526. Epub 2017/05/10.https://doi.org/10.1038/s41598-017-01207-3[pii]. PMID:28484222; PubMed Central PMCID: PMC5431475.
31. Pinto JA, Araujo J, Cardenas NK, Morante Z, Doimi F, Vidaurre T, et al. A prognostic signature based on three-genes expression in triple-negative breast tumours with residual disease. NPJ Genom Med. 2016; 1:15015. Epub 2016/02/03.https://doi.org/10.1038/npjgenmed.2015.15PMID:29263808; PubMed Central PMCID: PMC5685288.
32. Queiroga FL, Raposo T, Carvalho MI, Prada J, Pires I. Canine mammary tumours as a model to study human breast cancer: most recent findings. In Vivo. 2011; 25(3):455–65. Epub 2011/05/18. 25/3/455 [pii]. PMID:21576423.
33. Gillet JP, Varma S, Gottesman MM. The clinical relevance of cancer cell lines. J Natl Cancer Inst. 2013; 105(7):452–8. Epub 2013/02/26.https://doi.org/10.1093/jnci/djt007djt007 [pii]. PMID:23434901; PubMed Central PMCID: PMC3691946.
34. Williams JA. Using PDX for Preclinical Cancer Drug Discovery: The Evolving Field. J Clin Med. 2018; 7 (3):41. Epub 2018/03/03. E41 [pii].https://doi.org/10.3390/jcm7030041jcm7030041 [pii]. PMID:
29498669; PubMed Central PMCID: PMC5867567.
35. LeBlanc AK, Mazcko CN, Khanna C. Defining the Value of a Comparative Approach to Cancer Drug Development. Clin Cancer Res. 2016; 22(9):2133–8. Epub 2015/12/30. https://doi.org/10.1158/1078-0432.CCR-15-2347[pii]. PMID:26712689; PubMed Central PMCID: PMC5111620.
36. Russell AB, Trapnell C, Bloom JD. Extreme heterogeneity of influenza virus infection in single cells. Elife. 2018; 7. Epub 2018/02/17.https://doi.org/10.7554/eLife.32303e32303 [pii]. 32303 [pii]. PMID:
29451492; PubMed Central PMCID: PMC5826275.
37. Steuerman Y, Cohen M, Peshes-Yaloz N, Valadarsky L, Cohn O, David E, et al. Dissection of Influenza Infection In Vivo by Single-Cell RNA Sequencing. Cell Syst. 2018; 6(6):679–91 e4. Epub 2018/06/11. S2405-4712(18)30196-0 [pii].https://doi.org/10.1016/j.cels.2018.05.008PMID:29886109.
38. Kurokawa C, Iankov ID, Anderson SK, Aderca I, Leontovich AA, Maurer MJ, et al. Constitutive Inter-feron Pathway Activation in Tumors as an Efficacy Determinant Following Oncolytic Virotherapy. J Natl Cancer Inst. 2018; 110(10):1123–32. Epub 2018/05/23.https://doi.org/10.1093/jnci/djy0334994927 [pii]. PMID:29788332; PubMed Central PMCID: PMC6186520.
39. Patel MR, Dash A, Jacobson BA, Ji Y, Baumann D, Ismail K, et al. JAK/STAT inhibition with ruxolitinib enhances oncolytic virotherapy in non-small cell lung cancer models. Cancer Gene Ther. 2019. Epub 2019/01/10.https://doi.org/10.1038/s41417-018-0074-6[pii]. PMID:30622322.
40. Shibue T, Weinberg RA. EMT, CSCs, and drug resistance: the mechanistic link and clinical implications. Nat Rev Clin Oncol. 2017; 14(10):611–29. Epub 2017/04/12.https://doi.org/10.1038/nrclinonc.2017.44
nrclinonc.2017.44 [pii]. PMID:28397828; PubMed Central PMCID: PMC5720366.
41. Suriyamurthy S, Baker D, Ten Dijke P, Iyengar PV. Epigenetic Reprogramming of TGF-beta Signaling in Breast Cancer. Cancers (Basel). 2019; 11(5). Epub 2019/05/30. E726 [pii].https://doi.org/10.3390/ cancers11050726cancers11050726 [pii]. PMID:31137748; PubMed Central PMCID: PMC6563130.
42. Das V, Bhattacharya S, Chikkaputtaiah C, Hazra S, Pal M. The basics of epithelial-mesenchymal transi-tion (EMT): A study from a structure, dynamics, and functransi-tional perspective. J Cell Physiol. 2019. Epub 2019/02/07.https://doi.org/10.1002/jcp.28160PMID:30723913.
43. Bermudez O, Pages G, Gimond C. The dual-specificity MAP kinase phosphatases: critical roles in development and cancer. Am J Physiol Cell Physiol. 2010; 299(2):C189–202. Epub 2010/05/14.https:// doi.org/10.1152/ajpcell.00347.2009ajpcell.00347.2009 [pii]. PMID:20463170.
44. Baffet AD, Benoit B, Januschke J, Audo J, Gourhand V, Roth S, et al. Drosophila tubulin-binding cofac-tor B is required for microtubule network formation and for cell polarity. Mol Biol Cell. 2012; 23 (18):3591–601. Epub 2012/08/03.https://doi.org/10.1091/mbc.E11-07-0633mbc.E11-07-0633 [pii]. PMID:22855530; PubMed Central PMCID: PMC3442407.
45. Whitaker AM, Freudenthal BD. APE1: A skilled nucleic acid surgeon. DNA Repair (Amst). 2018; 71:93– 100. Epub 2018/09/02. S1568-7864(18)30177-0 [pii].https://doi.org/10.1016/j.dnarep.2018.08.012
PMID:30170830; PubMed Central PMCID: PMC6491353.
46. Zhong C, Xu M, Wang Y, Xu J, Yuan Y. An APE1 inhibitor reveals critical roles of the redox function of APE1 in KSHV replication and pathogenic phenotypes. PLoS Pathog. 2017; 13(4):e1006289. Epub 2017/04/06.https://doi.org/10.1371/journal.ppat.1006289PPATHOGENS-D-16-02325 [pii]. PMID:
28380040; PubMed Central PMCID: PMC5381946.
47. Yan N, Cherepanov P, Daigle JE, Engelman A, Lieberman J. The SET complex acts as a barrier to autointegration of HIV-1. PLoS Pathog. 2009; 5(3):e1000327. Epub 2009/03/07.https://doi.org/10. 1371/journal.ppat.1000327PMID:19266025; PubMed Central PMCID: PMC2644782.
48. Kane M, Zang TM, Rihn SJ, Zhang F, Kueck T, Alim M, et al. Identification of Interferon-Stimulated Genes with Antiretroviral Activity. Cell Host Microbe. 2016; 20(3):392–405. Epub 2016/09/16. S1931-3128(16)30349-3 [pii].https://doi.org/10.1016/j.chom.2016.08.005PMID:27631702; PubMed Central PMCID: PMC5026698.
49. Brugarolas J, Lei K, Hurley RL, Manning BD, Reiling JH, Hafen E, et al. Regulation of mTOR function in response to hypoxia by REDD1 and the TSC1/TSC2 tumor suppressor complex. Genes Dev. 2004; 18 (23):2893–904. Epub 2004/11/17. gad.1256804 [pii].https://doi.org/10.1101/gad.1256804PMID:
15545625; PubMed Central PMCID: PMC534650.
50. Ben Sahra I, Regazzetti C, Robert G, Laurent K, Le Marchand-Brustel Y, Auberger P, et al. Metformin, independent of AMPK, induces mTOR inhibition and cell-cycle arrest through REDD1. Cancer Res. 2011; 71(13):4366–72. Epub 2011/05/05.https://doi.org/10.1158/0008-5472.CAN-10-17690008-5472. CAN-10-1769 [pii]. PMID:21540236.
51. Tirado-Hurtado I, Fajardo W, Pinto JA. DNA Damage Inducible Transcript 4 Gene: The Switch of the Metabolism as Potential Target in Cancer. Front Oncol. 2018; 8:106. Epub 2018/05/01.https://doi.org/ 10.3389/fonc.2018.00106PMID:29707520; PubMed Central PMCID: PMC5906527.
52. Soares JA, Leite FG, Andrade LG, Torres AA, De Sousa LP, Barcelos LS, et al. Activation of the PI3K/ Akt pathway early during vaccinia and cowpox virus infections is required for both host survival and viral replication. J Virol. 2009; 83(13):6883–99. Epub 2009/04/24.https://doi.org/10.1128/JVI.00245-09
JVI.00245-09 [pii]. PMID:19386722; PubMed Central PMCID: PMC2698574.
53. Kapp LD, Lorsch JR. The molecular mechanics of eukaryotic translation. Annu Rev Biochem. 2004; 73:657–704. Epub 2004/06/11.https://doi.org/10.1146/annurev.biochem.73.030403.080419PMID:
15189156.
54. Walsh D, Arias C, Perez C, Halladin D, Escandon M, Ueda T, et al. Eukaryotic translation initiation fac-tor 4F architectural alterations accompany translation initiation facfac-tor redistribution in poxvirus-infected cells. Mol Cell Biol. 2008; 28(8):2648–58. Epub 2008/02/06.https://doi.org/10.1128/MCB.01631-07
MCB.01631-07 [pii]. PMID:18250159; PubMed Central PMCID: PMC2293122.
55. Meade N, King M, Munger J, Walsh D. mTOR Dysregulation by Vaccinia Virus F17 Controls Multiple Processes with Varying Roles in Infection. J Virol. 2019; 93(15). Epub 2019/05/24. e00784-19 [pii].
https://doi.org/10.1128/JVI.00784-19JVI.00784-19 [pii]. PMID:31118254; PubMed Central PMCID: PMC6639273.
56. Guerra S, Caceres A, Knobeloch KP, Horak I, Esteban M. Vaccinia virus E3 protein prevents the antivi-ral action of ISG15. PLoS Pathog. 2008; 4(7):e1000096. Epub 2008/07/08.https://doi.org/10.1371/ journal.ppat.1000096PMID:18604270; PubMed Central PMCID: PMC2434199.
57. Martinico SC, Jezzard S, Sturt NJ, Michils G, Tejpar S, Phillips RK, et al. Assessment of endostatin gene therapy for familial adenomatous polyposis-related desmoid tumors. Cancer Res. 2006; 66 (16):8233–40. Epub 2006/08/17. 66/16/8233 [pii].https://doi.org/10.1158/0008-5472.CAN-06-1209
PMID:16912203.
58. Montiel-Equihua CA, Martin-Duque P, de la Vieja A, Quintanilla M, Burnet J, Vassaux G, et al. Targeting sodium/iodide symporter gene expression for estrogen-regulated imaging and therapy in breast cancer.