HAL Id: hal-02900921
https://hal.archives-ouvertes.fr/hal-02900921
Submitted on 28 Oct 2020
HAL is a multi-disciplinary open access
archive for the deposit and dissemination of
sci-entific research documents, whether they are
pub-lished or not. The documents may come from
teaching and research institutions in France or
abroad, or from public or private research centers.
L’archive ouverte pluridisciplinaire HAL, est
destinée au dépôt et à la diffusion de documents
scientifiques de niveau recherche, publiés ou non,
émanant des établissements d’enseignement et de
recherche français ou étrangers, des laboratoires
publics ou privés.
Global Phosphorus Losses from Major Crop Cultivations
Wenfeng Liu, Hong Yang, Philippe Ciais, Christian Stamm, Xu Zhao, Jimmy
Williams, Karim Abbaspour, Rainer Schulin
To cite this version:
Wenfeng Liu, Hong Yang, Philippe Ciais, Christian Stamm, Xu Zhao, et al..
Integrative
Crop-Soil-Management Modeling to Assess Global Phosphorus Losses from Major Crop
Cultiva-tions.
Global Biogeochemical Cycles, American Geophysical Union, 2018, 32 (7), pp.1074-1086.
Integrative Crop-Soil-Management Modeling to Assess Global
Phosphorus Losses from Major Crop Cultivations
Wenfeng Liu1,2,3 , Hong Yang1,4, Philippe Ciais2, Christian Stamm1, Xu Zhao5, Jimmy R. Williams6, Karim C. Abbaspour1, and Rainer Schulin7
1
Eawag, Swiss Federal Institute of Aquatic Science and Technology, Duebendorf, Switzerland,2Laboratoire des Sciences du Climat et de l’Environnement, LSCE/IPSL, CEA-CNRS-UVSQ, Université Paris-Saclay, Gif-sur-Yvette, France,3State Key
Laboratory of Hydraulics and Mountain River Engineering, Sichuan University, Chengdu, China,4Department of Environmental Sciences, MGU, University of Basel, Basel, Switzerland,5Key Laboratory of Integrated Regulation and
Resource Development on Shallow Lakes, Ministry of Education, College of Environment, Hohai University, Nanjing, China,
6Texas A&M Agri-Life Research and Extension Center, Weslaco, TX, USA,7Institute of Terrestrial Ecosystems, ETH Zürich,
Zürich, Switzerland
Abstract
Fertilization, crop uptake followed by plant harvest, runoff and erosion, and transformations of phosphorus (P) in soil are the major factors influencing the P balance of croplands. It is important to integrate plant-soil-management interactions into consistent modeling systems to determine the effect of P fertilization conditions on yields and to quantify P losses. Previous assessment of P losses on large scales did not consider the interactions among these factors. Here we applied a grid-based crop model to estimate global P losses from three most produced crops: maize, rice, and wheat. The model was forced by detailed P input data sets over the period 1998–2002. According to our simulations, global P losses from the three crops reached 1.2 Tg P/year, and about 44% of it was due to soil erosion. The global total P losses were dominated by contributions from a few hot spot regions. Reducing P fertilizer in regions experiencing excessive P uses and hence losses, especially in China and India, could achieve the same yields as today and save about two thirds of global total P inputs, with the cobenefits of declining global total P losses by 41% and downstream water quality improvement. Reducing soil erosion and retaining more crop residues on croplands could further save P inputs and alleviate P losses. This study is of significance to determine the major factors influencing P balance across regions of the world and help policy makers to propose efficient strategies for tackling P-driven environmental problems.1. Introduction
Phosphorus (P) is a key nutrient element for agricultural production, but it is less studied than nitrogen (N; Elser & Bennett, 2011; Filippelli, 2008; Obersteiner et al., 2013; Sutton et al., 2013). Unlike N, P is a nonrenew-able mineral resource with an extremely uneven spatial distribution (Chen & Graedel, 2016; Yuan et al., 2018). Hence, ensuring availability of thisfinite resource for sustainable crop production is essential for human well-being (Nemery & Garnier, 2016). At present, P fertilization is viewed as inefficient, which is reflected by an overuse of the resource, on the one hand, and substantial losses to the environment, on the other (Carpenter, 2008; Childers et al., 2011; Grizzetti et al., 2012; W. Liu et al., 2017; Powers et al., 2016). It is esti-mated that P emissions to the environment have significantly transgressed its safe planetary boundary (Carpenter & Bennett, 2011; Kahiluoto et al., 2014; Steffen et al., 2015). The use of P for agriculture is con-strained by the extraction costs and the available reserves of mineral P to produce fertilizers, which poses a threat to long-term global food security (Cordell et al., 2009; van Vuuren et al., 2010). Therefore, conceiving development pathways with a more efficient use of P has become a key challenge for scientists and policy makers in the 21st century.
Spatially explicit assessment of global P losses from croplands and identification of regions and crop types with inappropriate P fertilization are essential to make plans for improving the efficiency of P fertilization. P losses from croplands depend on the balance between fertilization, crop uptake and harvest of P, runoff and soil erosion, and soil P transformations. This necessitates considering plant-soil-management as a coupled system. Previous studies did not achieve such integration, as they either were only based on the bal-ance of P inputs and removal of P in harvested biomass while ignoring soil erosion (A. F. Bouwman et al., 2009; L. Bouwman et al., 2013; Lun et al., 2017; MacDonald et al., 2011; West et al., 2014) or only assessed
Global Biogeochemical Cycles
RESEARCH ARTICLE
10.1029/2017GB005849Key Points:
• We conduct an integrative crop-soil-management assessment of global phosphorus losses from major crop cultivations
• Phosphorus losses are concentrated on small hot spot regions, while crop yields do not show consistent patterns
• Optimizing phosphorus inputs in regions with excessive uses can significantly reduce phosphorus losses without compromising crop yields Supporting Information: • Supporting Information S1 Correspondence to: W. Liu, wenfeng.liu@eawag.ch Citation:
Liu, W., Yang, H., Ciais, P., Stamm, C., Zhao, X., Williams, J. R., et al. (2018). Integrative crop-soil-management modeling to assess global phosphorus losses from major crop cultivations. Global Biogeochemical Cycles, 32, 1074–1086. https://doi.org/10.1029/ 2017GB005849
Received 26 NOV 2017 Accepted 16 JUN 2018
Accepted article online 26 JUN 2018 Published online 20 JUL 2018
©2018. American Geophysical Union. All Rights Reserved.
the impacts of soil erosion without taking P fertilization, crop uptake, and within-system cycling into account (Bennett et al., 2001; Y. Liu et al., 2008; Quinton et al., 2010). In addition, they often focused on agriculture as a whole and did not differentiate between crops (L. Bouwman et al., 2013; Lun et al., 2017; MacDonald et al., 2011; Mekonnen & Hoekstra, 2017). However, P losses and fertilizer requirements vary substantially among different crops (Ringeval et al., 2017). Taking account of these differences is important in attempts to improve agricultural nutrient management (W. Liu, Yang, Liu, et al., 2016).
Here we applied a global gridded crop model PEPIC (W. Liu, Yang, Folberth, et al., 2016; W. Liu, Yang, Liu, et al., 2016) to estimate global P losses for the period of 1998–2002 with a 0.5° spatial resolution asso-ciated with the cultivation of maize, rice, and wheat. On a global scale, these three crops account for ~63% of all P fertilizers applied and for ~62% of the calories provided by the 17 food crops most com-monly produced (West et al., 2014). The PEPIC model is a grid-based version of the Environmental Policy Integrated Climate (EPIC) model (Williams, 1995; Williams et al., 1984). It explicitly accounts for the interactions between fertilization, crop uptake and harvest, runoff and erosion, and soil P transforma-tions. The simulated P losses to the environment (outside cropfields) for each grid include P losses from surface runoff and leaching, and soil erosion. The harvested fraction of P in yields and residues removed fromfields is not defined as a loss to the environments since it enters the food chain. P removed by resi-dues returned to thefield is not a loss, but rather a recycling flux. The PEPIC model has been used to simulate global crop-water relations (W. Liu, Yang, Folberth, et al., 2016), assess the trade-offs between global N losses and yields (W. Liu, Yang, Liu, et al., 2016; W. Liu et al., 2018). It also contributes to the Global Gridded Crop Model Intercomparison in the Agricultural Model Intercomparison and Improvement Project (Müller et al., 2017; Porwollik et al., 2017). In addition to the baseline P fertilization schedule, that is, applying P before crop planting with actual P inputs based on the EarthStat data set (Mueller et al., 2012; West et al., 2014), we used the PEPIC model to determine an optimal P input rate (the optP scenario), which provides optimal P concentration in soil for crop uptake in each grid cell, keep-ing other factors unchanged. In addition to optimizkeep-ing P inputs, we also investigated the impacts of redu-cing soil erosion and recycling crop residues to reduce losses. Optimal P inputs were also quantified for three alternative scenarios, that is, the optP-ero scenario (50% reduced soil erosion relative to the base-line), the optP-res scenario (only 25% of crop residues removed from croplands compared to 75% under the baseline), and the optP-ero-res scenario (both reduced erosion and less residues removed).
2. Materials and Methods
2.1. Simulation Framework
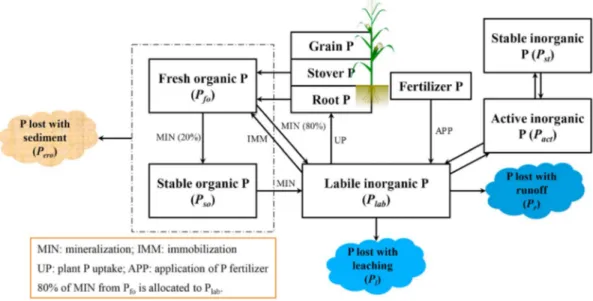
The EPIC model (Williams, 1995; Williams et al., 1984) was initially developed to investigate the impacts of soil erosion on crop productivity at daily scale. In its current form, it couples submodels of soil processes to a crop growth model. It has been widely used to assess P losses from agricultural cultivations (Della Peruta et al., 2014; Pierson et al., 2001). EPIC distinguishes three mineral inorganic P pools (Jones et al., 1984), that is, labile, active, and stable P, and two organic P pools, that is, a fresh and a stable organic matter (Figure 1). P inputs (Pin) included Pfluxes associated with mineral fertilizer and manure application, while P outputs included P fluxes with surface runoff and leaching, and soil erosion, as well as P exports with crop yields (Py) and residue removal (Pres). P losses through surface runoff and leaching (Pr + l) were calculated from the respectivefluxes and P concentrations in surface runoff and percolation water, while P losses with erosion (Pero) were calcu-lated from the concentration of P in the top soil layer, soil erosion yields, and an enrichment ratio which is the concentration of P in the sediment divided by that in the soil (Williams et al., 2008). P losses to the total environment (Ptot) includes Pr + land Pero. Details of P transformations among different pools and calculation of P losses are provided in the supporting information.
To apply EPIC on the large scale of this study, we used the grid-based version of EPIC in the Python environ-ment (PEPIC) developed by W. Liu, Yang, Folberth, et al. (2016). The PEPIC model used elevation, slope, cli-mate, soil, nutrients, irrigation, planting and harvesting dates, potential heat units (PHU), and crop fractional cover as input data at a spatial resolution of 30 arc min. Climate data, including precipitation, max-imum and minmax-imum temperature, solar radiation, relative humidity, and wind speed were derived from Weedon et al. (2014). Data on soil properties, for example, depths of soil layers, organic carbon content, pH, silt and clay content, and bulk density were obtained from Batjes (2006). The data on P and N inputs
with the application of mineral fertilizers and manure were taken from the EarthStat data set (http://www. earthstat.org), which were based on Mueller et al. (2012) and West et al. (2014). These nutrient data relate to the situation in the study period 1998–2002 and are currently the most updated spatially explicit and crop-specific fertilizer data. Crop-specific calendars were obtained from Sacks et al. (2010). The PHU was calculated by using the PHU Calculator (http://swat.tamu.edu/software/potential-heat-unit-program), which is based on crop calendar and temperature. Crop-specific rainfed and irrigated cultivated land areas in each grid cell were downloaded from Portmann et al. (2010). Default EPIC parameters were used in this study based on the EPIC user’s manual (Gerik et al., 2015) without considering spatial variability. This is a common parameterization of large-scale crop simulation, as it is a challenge to set regional specific model parameters on a global scale (Müller et al., 2017). However, model uncertainties and parameter sensitivities were investigated systematically by performing model runs with parameters varied in a range of uncertainty determined from literature and expert judgment (Table S1). Details of this uncertainty and sensitivity analysis are given in section 2.3.
2.2. Model Setup
The simulations spanned a period from 1981 to 2002. In this period, global P fertilizer consumption was rela-tively stable (Chen & Graedel, 2016). Thefirst 17 years were used to phase out the influence of unknown initial conditions. In the simulations, N was applied automatically with a maximum amount equal to the current annual input from the EarthStat data set based on Balkovič et al. (2013). Rainfed and irrigated cultivations were simulated separately. Given the unavailability of irrigation amount data, an automatic irrigation sche-dule was used without water limitation for the irrigated cultivation. Compared to upland crops (maize and wheat), paddy management practices were considered for rice simulations. Paddyfields were first built, fol-lowed by puddling the rice paddy before planting. Puddling is a tillage operation with saturated soil and shal-low ponding water to break clods andflatten the rice paddy, which makes the top soil layer more suitable for rice planting and also reduces sediment generation (Choi et al., 2017). Rice transplanting was simulated by setting leaf area index of 0.1 at the time of transplanting based on Steglich et al. (2016). Before harvesting, the puddling condition was destroyed. Details regarding how to set paddy rice simulation can be found in Steglich et al. (2016).
Under the baseline scenario, P fertilizer from the EarthStat data set was applied before crop planting consid-ering removing 75% of crop residues from croplands (Del Grosso et al., 2009; W. Liu, Yang, Liu, et al., 2016; Table S2). Besides the baseline P fertilization, a dynamic P fertilization schedule was used (the optP-D sce-nario). This method applies P fertilizer automatically without limitation based on the optimal P concentration in the soil for crop taking up and can be used to derive the optimal P inputs after a long-term simulation (e.g.,
Figure 1. Schematic of phosphorus (P) routines in the EPIC model. EPIC = Environmental Policy Integrated Climate.
10.1029/2017GB005849
longer than 20 years). The average annual P inputs for the period 1981–2002 from the optP-D scenario was treated as the optimal P inputs and was applied before crop planting for the optP scenario. In addition to optimizing P inputs, we also investigated the impacts of reducing 50% soil erosion (the optP-ero scenario), removing only 25% crop residues from croplands (the optP-res scenario), and combining the two managements (the optP-ero-res scenario) on P fertilization and P losses. Similar to the optP scenario, optimal P inputs for the three scenarios, that is, optP-ero, optP-res, and optP-ero-res, were also quantified under the scenarios of optP-ero-D, optP-res-D, and optP-ero-res-D (Table S2).
All outputs in this study represent averages for thefive years from 1998 to 2002. For each grid cell, they were aggregated by area weighting of rainfed and irrigated outputs. Evaluation of model performance is described in the supporting information.
2.3. Uncertainty and Sensitivity Analyses
The Latin Hypercube Sampling (LHS) method (Mckay et al., 1979) was used to sample the model parameters to explore uncertainties in P loss simulations derived from uncertain parameter values. LHS was applied in our previous study for investigating global N loss uncertainties (W. Liu, Yang, Liu, et al., 2016). This methodfirst divides the range of parameters into a number of segments. Then the parameter segments are randomized. Finally, a random sample is chosen in each segment. LHS is more efficient than Monte Carlo (Mckay et al., 1979) and has been used in the SWAT-CUP software (Abbaspour, 2011) for calibrating the Soil and Water Assessment Tool model parameters (Abbaspour et al., 2007; Yang et al., 2008) as well as for the LPJ global vegetation model (Zaehle et al., 2005). Model parameters associated with crop growth, water balance, as well as P and carbon routines in PEPIC and their possible ranges for uncertainty analysis were carefully selected based on Gerik et al. (2015) and Wang et al. (2012; Table S1). In this study, 100 parameter segments were con-sidered in the LHS method.
A global sensitivity analysis method was used to determine the most sensitive model parameters. This methodfirst builds the multiple regression relationship between LHS-generated parameters and simulated output variables, for example, Peroand Ptot. A t test is then employed to identify the relative significance of each model parameter based on its corresponding t value. Parameters with larger t value are assessed to be more sensitive for the selected model output. A detailed description of this sensitivity analysis method is given in Abbaspour (2011).
3. Results
3.1. Global Phosphorus Loss Assessment
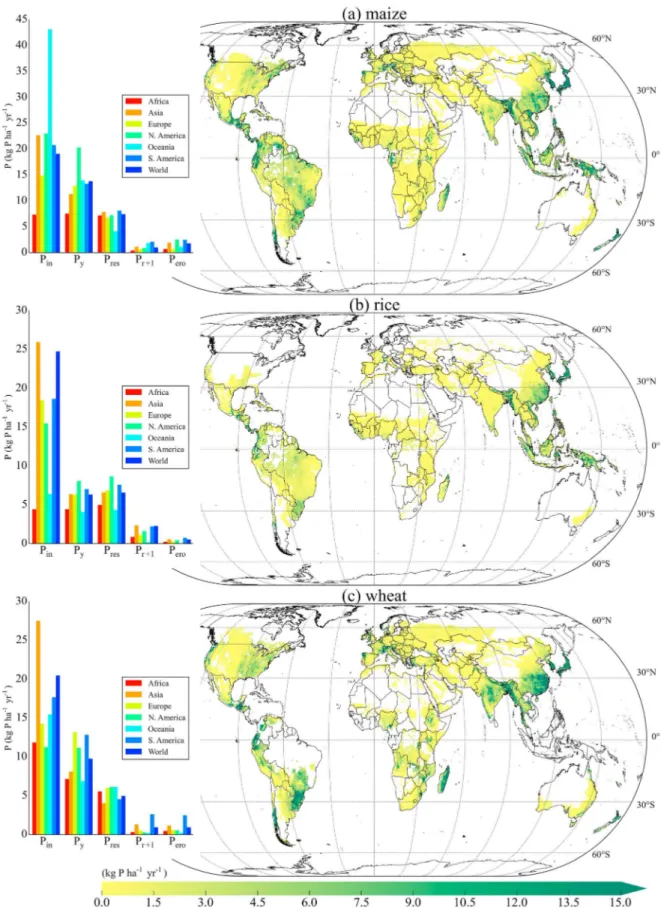
According to the baseline simulation results with actual P fertilizer applications during 1998–2002, global P losses into the environment from leaching and erosion totaled 409, 429, and 392 Gg P/year (Gg = 109g) for maize, rice, and wheat, respectively, accounting for 15%, 11%, and 9% of the respective P inputs (Pin; Table 1).
Table 1
Comparison of Phosphorus (P) Inputs (Pin), P Losses to Total Environment (Ptot), P Losses With Soil Erosion (Pero), and Crop
Production Among Different Scenarios
Crop Variable Baseline optP optP-ero optP-res optP-ero-res
Maize Pin(Gg P/year) 2,795.12 1,849.43 1,840.75 1,458.55 1,442.73 Ptot(Gg P/year) 409.23 293.07 211.57 351.42 240.01 Pero(Gg P/year) 261.84 220.99 139.19 272.03 160.61 Production (Tg/year) 808.72 812.24 815.12 820.37 824.25 Rice Pin(Gg P/year) 3,761.10 674.50 670.33 359.87 354.68 Ptot(Gg P/year) 429.04 240.69 225.40 270.91 248.20 Pero(Gg P/year) 83.45 52.58 37.32 70.82 47.92 Production (Tg/year) 740.46 740.65 741.05 743.46 743.90 Wheat Pin(Gg P/year) 4,293.79 1,296.97 1,291.37 1,009.12 1,002.30 Ptot(Gg P/year) 391.92 191.69 142.61 213.05 155.38 Pero(Gg P/year) 194.81 126.84 77.44 144.81 86.70 Production (Tg/year) 584.90 585.27 586.38 592.57 593.85
Figure 2. (a–c) Global maps of phosphorus (P) losses to total environment for the study period 1998–2002. Information of P inputs (Pin), P uptake in crop yields (Py) and
crop residues (Pres), P losses with surface runoff and leaching (Pr + l), and P losses with erosion (Pero) is presented at the global and continental levels for each crop.
10.1029/2017GB005849
About 64%, 19%, and 50% of these Ptotlosses were contributed by the pro-cess of erosion. Perowas lower for rice production compared with maize and wheat production, due to the special paddy management practices considered for rice simulation. South Korea, Japan, southeastern China, southeastern Asia, and northeastern India, Brazil, and Chile accounted for high loss rates (Figure 2). Maize had the highest P recovery rate in yields (with a ratio of Py/Pinof 0.72), followed by wheat (0.48), while rice had the lowest value (0.26). European and North American agriculture was found to be more efficient in transferring Pinto crop yields, by contrast with Asia. Meanwhile, a large amount of P was also removed from crop-lands containing harvested crop residues (Pres).
We found that Ptotand Perolosses are highly concentrated over small hot spot regions (Figures 2, 3, and S1), with differences in loss rates between the three crops. The percentages of total P losses contributed from the 20th percentile of cultivated areas with highest Ptot rates being 60%, 58%, and 71% for maize, rice and wheat, respectively. The 20th percentile of areas with lowest Ptotrates only account for 1.5%, 1.4%, and 0.4% of the respective total P losses. By contrast, crop yields do not show a coincident distribution. This means that there is a significant potential to reduce P losses and avoid P pollution by focusing on a small fraction of cropland areas. At the continental level, Asia and North America almost equally con-tributed to the majority of P losses for maize, whereas in the case of rice and wheat, Asia was the main contributor, mainly due to excessive P inputs there (Tables S3–S5).
3.2. Global Phosphorus Fertilization Conditions
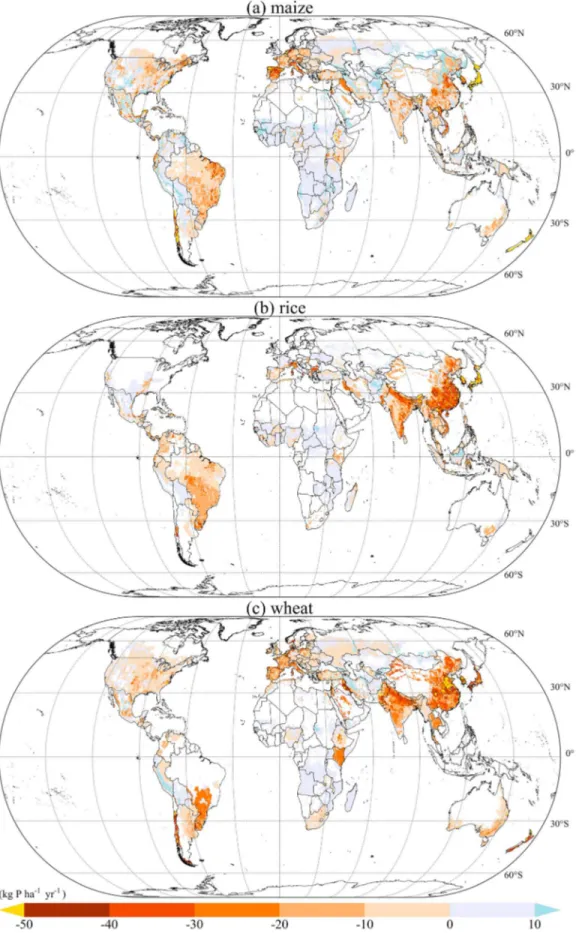
By comparing this baseline simulation with the optP simulation where P input rates were optimized for crop uptake, we identified regions with overapplication or underapplication of P fertilizer. This comparison shows that Pincould be reduced substantially, especially for rice and wheat culti-vation (Table 1 and Figure 4). This would corresponds to annual P fertilizer savings of 946, 3,087, and 2,997 Gg P/year for maize, rice, and wheat, respectively, suggesting that currently 34%, 82%, and 70% of P applica-tions for the three crops could be eliminated without reducing crop yields (Table S6). The differences in Pinbetween optP and baseline present simi-lar spatial patterns for the three crops (Figure 4). Japan, South Korea, New Zealand, China, India, and Brazil, western Europe, and parts of the United States show high potentials for reducing Pin, with potential savings of 50 kg P·ha 1·year 1in Japan and South Korea. On the contrary, Pinneeds to be slightly increased in many parts of Africa and the Middle East, with a general increase of less than 10 kg P·ha 1·year 1 throughout these regions. Simulations with the optP-ero, optP-res, and optP-ero-res scenar-ios show that reducing soil erosion could translate only in small savings of Pin (Table 1), mainly because P bound to soil is not available for crop uptake (Jones et al., 1984). On the other hand, leaving 75% instead of 25% of the crop residues in thefield would further substantially decrease the consumption of total P fertilizer inputs from 3,821 Gg P/year in the optP simulation to 2,800 Gg P/year in the optP-ero-res simulation.
3.3. Reduction of Global Phosphorus Losses
The decreases in Pinbetween optP and baseline also lead to a significant decrease in P losses for the three crops, with reductions of 116, 188, and 200 Gg P/year for maize, rice, and wheat, respectively (Table 1). These
Figure 3. (a–c) Distributions of cumulative phosphorus (P) losses (or food production) in relation to cumulative cropland areas. Solid lines are for P losses to the total environment (Ptotred color), crop production (green
color), and P losses with soil erosion (Peroblue color) sorted from highest grid
Ptotto lowest one. Dashed lines arefirst grouped by continents; countries are
then sorted from highest country average Ptotto lowest one in each
continent; grids arefinally sorted from highest grid Ptotto lowest one in each
country for Ptot(bold dashed line) and Pero(slim dashed line). Topfive P loss
Figure 4. (a–c) Global maps of differences in phosphorus (P) inputs between scenarios optP and baseline. Negative values indicate decreases in P inputs; positive values indicate increases in P inputs. Definition of scenarios refers to Table S2.
10.1029/2017GB005849
decreases correspond to 28%, 44%, and 51% of the current total P losses for the three crops, which are mainly due to reduction in P losses with surface runoff and leaching but less because of reduction in P losses with soil erosion (Tables S3 and S4). The spatial patterns of Ptotreduction are quite similar to Pinreduction (Figure S2). Reducing soil erosion could further decrease Peroand hence also Ptot (the optP-ero scenario), but leaving more crop residues in croplands, on the other hand, could increase Pero and Ptot (Figure 5). Overall, combining the managements of reducing soil erosion and leaving more crop residues could lead to more benefits in terms of reducing global P inputs and P losses, while also slightly increasing crop production (Table S6).
3.4. Model Uncertainties
Simulations with 100 sets of model parameters indicate high uncertainties in estimating Pero and Ptot (Figure 6). The standard deviations of global average Pero and Ptot are 0.19–0.45 and 0.27–0.71 kg P·ha 1·year 1, respectively, for the three crops (Table S7). This translates into large coefficients of variation (CV) in the P loss estimates in the range of 21%–29%, from uncertain model parameters. Sensitivity analysis indicates that the maximum depth for biological soil mixing (P24), the modified Universal Soil Loss Equation (RUSLE2) threshold transport capacity coefficient (P72), the soluble P runoff coefficient (P08), and the upward movement of soluble P by evaporation coefficient (P43) of PEPIC are the most sensitive/influential para-meters in controlling P losses (Table S7).
4. Discussion
We found that the average ratio of Ptotto Pin(Ptot/Pin) is 11.3% for the three major crops, indicating that about 11% of the inputs of P were lost to the environment. The Ptot/Pinratio estimated in this study falls in the mid-dle of the range of previous studies going from between 2.8% and 23% (Table 2). The large range illustrates uncertainties in estimating P losses, which was captured in our simulations with CV as high as 30% (Table S7). A similar CV was reported by Ringeval et al. (2017) in modeling farm P inputs and outputs with a global
Figure 5. Global and continental phosphorus (P) inputs (a, d, g: Pin), P losses to the total environment (b, e, h: Ptot), and P losses with soil erosion (c, f, i: Pero) under different scenarios. Definition of scenarios refers to Table S2.
empirical soil P balance model. Regional comparison shows that our P loss estimates are in line with previous studies (Table S8). For instance, the simulated average Ptotin this study of 1.2 kg P·ha 1·year 1in Europe, falls in the range of 0.09–2 kg P·ha 1·year 1, reported for 10 large river basins in Europe (Kronvang et al., 2007). Besides, our model also performs well in representing the FAO statistical yields (http://www.fao.org/fao-stat/en/#home), with the coefficients of determination of the linear regression between reported and simu-lated yields ranging between 0.33 and 0.64 for the three crops (Figure S3). The acceptable match of yields (for a global crop model with generic parameters) and of P compared with statistics and previous results provides support for the reliability of our approach.
The current estimate of the safe planetary boundary for P losses from agricultural systems to water bodies was set to 1.0 Tg P/year (Tg = 1012g; Kahiluoto et al., 2014), based on an arbitrary target P conctention of 24 mg P/m3in freshwaters (Carpenter & Bennett, 2011). Our simulations indicate that total P losses from the three major crops today have exceeded this boundary, reaching 1.2 Tg P/year by 2002 (Table 1). There is thus an urgent need to reduce P losses from these three crops. Application of optimal P inputs (the optP scenario) could reduce losses by 0.5 Tg P/year without negatively affecting crop yields (Tables 1,
Figure 6. Uncertainties of phosphorus (P) losses with (a, c, e) soil erosion (Pero) and P losses to the (b, d, f) total environment
(Ptot) continentally and globally. Lines from top to bottom are 95th, 75th, 50th, 25th, and 5th percentiles, respectively.
10.1029/2017GB005849
S3, and S6). Total P inputs from fertilizers could be reduced by 7.0 Tg P/year under the optP scenario (and by 8.0 Tg P/year under the optP-ero-res scenario) compared to 11 Tg P/year currently. These savings of P resources will alleviate the depletion of global P reserves and sustain long-term food security (Cordell et al., 2009; Van Vuuren et al., 2010).
The PEPIC model includes several crop growth limiting factors, for example, water, temperature, N, and P and takes the highest one as the major factor to limit crop yields. In our simulations, the simulated optimal level of P inputs would not significantly increase crop yields in under-application regions, for example, in Africa. It implies that P may not be the major growth limiting factor in our simulations, but rather N (Kvakić et al., 2018; W. Liu, Yang, Liu, et al., 2016). However, it is still important to increase P inputs in the P limited regions to maintain soil fertility especially under a continuous cultivation (Ringeval et al., 2014; Zhang et al., 2017). The spatially concentrated P losses to the environment found in this study provide an option to mitigate the environmental problems caused by P losses from agricultural areas through more evenly distributing P ferti-lizer application, that is, redistribute P inputs from overuse regions to regions showing a deficit. Due to the different concentration patterns among the three crops, it is important to identify crop-specific P fertilization conditions. In this study, crop management practices, for example, P fertilizer inputs (Figure S4), fraction of irrigated areas to total cultivation areas in each grid cell (Figure S5), and crop growing conditions, especially growing season precipitation (Figure S6), are responsible for the differences among the three crops. The dif-ferent management approaches and climatic conditions further highlight the significance of crop-specific assessment. Compared with upland crops, for example, maize and wheat, paddy rice systems have quite dif-ferent management practices, leading to low Peroestimates (Table 1). We also conducted a rice simulation without considering paddy condition, which is a common setup of global rice modeling (Müller et al., 2017). In this condition, Ptotand Peroof rice were estimated to be about 1 Tg P/year and 0.5 Tg P/year, respec-tively, being much higher than the simulation with paddy systems. The large differences in estimating P losses between with and without considering paddy practices call for explicitly simulating paddy rice cultiva-tion on a global scale.
We acknowledge some limitations of our simulation results. First, the P losses to the environment esti-mated in this study relate to the situation around the year 2000 and not the current period, due to lim-itation in available crop-specific P input data. The more recent situation can be inferred from the trend in total P fertilizer consumption globally and for the top 10 producing countries (W. Liu, Yang, Liu, et al., 2016) of the three crops (Figure S7). Global total P consumption increased by ~25% between 2002 and 2013, particularly in India, China, and Brazil. This signals potentially severe P-driven environmental issues (e.g., eutrophication) today and calls for actions to address them. Second, we only considered the effects of better fertilization, reducing soil erosion, and crop residue management on mitigating P losses. Other options, for example, precision farming and increasing the fraction of manure returned to croplands, will further minimize P losses. Future assessment needs to take all these measurements into account. Despite these limitations, this study is thefirst comprehensive attempt to evaluate the P fertilization and P loss conditions for the three major crops on a global scale, to help policy makers ameliorate global P-related issues.
Table 2
Ratio of Phosphorus (P) Losses to Total Environment (Ptot) to P Inputs (Pin) in the Current Study Compared to Previous Studies
Study Pin(Tg P/year) Ptot(Tg P/year) Ptot/Pin(%) Study period
A. F. Bouwman et al. (2009) 31a 3 10 2000
L. Bouwman et al. (2013) 31a 4 12.5 2000
Lun et al. (2017) 20.4b 3.2 15.7 2000
MacDonald et al. (2011) 23.8b 2.4 10 2000
Mekonnen and Hoekstra (2017) 24b 0.6 2.8 2002–2010
Penuelas et al. (2013) 21.8–26.8c 5 19–23 2000–2010
Sattari et al. (2012) 16.6b 1.70 10 2007
Current study 10.8d 1.2 11.3 1998–2002
aP
infor croplands and grasslands from mineral fertilizer and manure. bPinfor croplands from mineral fertilizer and
manure. cPinfor croplands and grasslands from only mineral fertilizer. dPinonly for maize, rice, and wheat from
5. Conclusions
In this study, we conducted an integrative crop-soil-management assessment of global P losses from the cul-tivations of three major crops, that is, maize, rice and wheat, by using a grid-based crop model with detailed management information. Several mitigation scenarios were proposed to investigate pathways toward bal-ance among P uses, crop yields, and P losses. We found that global total P losses from the three major crops reached 1.2 Tg P/year by 2002, which have significantly exceeded the safe planetary boundary of P losses to water bodies, and soil erosion contributed 44% of it. Meanwhile, simulations demonstrate, for thefirst time to our knowledge, that global P losses showed quite different patterns to crop yields, as P losses were concen-trated over a few hot spot regions while yields did not present coincident distribution. Through identifying appropriate P inputs throughout the cultivated areas of the three crops, we found that P inputs could be reduced in many regions due to excessive uses, especially in China and India, therefore reducing P losses without compromising crop yields. Reducing soil erosion and integrating more crop residues for cycling could further reduce P losses. Additionally, these mitigation measures could also save a large amount of P inputs, which is essential to slowdown the depletion of ourfinite P resources. In order to ensure long-term availability of P for crop production and simultaneously address severe environmental problems associated with P losses, there is an urgent need to conserve global P resources and reduce P losses. This study is parti-cularly important for informing policy makers the hot spot regions of global P losses and guiding them to pro-pose strategies for tackling P-related issues.
References
Abbaspour, K. C. (2011). SWAT–CUP: SWAT calibration and uncertainty programs. Dübendorf, Switzerland: Eawag.
Abbaspour, K. C., Yang, J., Maximov, I., Siber, R., Bogner, K., Mieleitner, J., et al. (2007). Modelling hydrology and water quality in the pre-ailpine/alpine Thur watershed using SWAT. Journal of Hydrology, 333(2-4), 413–430. https://doi.org/10.1016/j.jhydrol.2006.09.014 Balkovič, J., van der Velde, M., Schmid, E., Skalský, R., Khabarov, N., Obersteiner, M., et al. (2013). Pan-European crop modelling with EPIC:
Implementation, up-scaling and regional crop yield validation. Agricultural Systems, 120, 61–75. https://doi.org/10.1016/j.agsy.2013.05.008 Batjes, N. H. (2006). ISRIC-WISE derived soil properties on a 5 by 5 arc-minutes global grid (version 1.1). Wageningen: ISRIC - World Soil
Infromation.
Bennett, E. M., Carpenter, S. R., & Caraco, N. F. (2001). Human impact on erodable phosphorus and eutrophication: A global perspective. Bioscience, 51(3), 227–234. https://doi.org/10.1641/0006-3568(2001)051[0227:HIOEPA]2.0.CO;2
Bouwman, A. F., Beusen, A. H. W., & Billen, G. (2009). Human alteration of the global nitrogen and phosphorus soil balances for the period 1970–2050. Global Biogeochemical Cycles, 23, GB0A04. https://doi.org/10.1029/2009GB003576
Bouwman, L., Goldewijk, K. K., Van Der Hoek, K. W., Beusen, A. H., Van Vuuren, D. P., Willems, J., et al. (2013). Exploring global changes in nitrogen and phosphorus cycles in agriculture induced by livestock production over the 1900–2050 period. Proceedings of the National Academy of Sciences of the United States of America, 110(52), 20,882–20,887. https://doi.org/10.1073/pnas.1012878108
Cao, D., Cao, W. Z., Fang, J., & Cai, L. Y. (2014). Nitrogen and phosphorus losses from agricultural systems in China: A meta-analysis. Marine Pollution Bulletin, 85(2), 727–732. https://doi.org/10.1016/j.marpolbul.2014.05.041
Carpenter, S. R. (2008). Phosphorus control is critical to mitigating eutrophication. Proceedings of the National Academy of Sciences of the United States of America, 105(32), 11,039–11,040. https://doi.org/10.1073/pnas.0806112105
Carpenter, S. R., & Bennett, E. M. (2011). Reconsideration of the planetary boundary for phosphorus. Environmental Research Letters, 6(1), 014009. https://doi.org/10.1088/1748-9326/6/1/014009
Chen, M. P., & Graedel, T. E. (2016). A half-century of global phosphorusflows, stocks, production, consumption, recycling, and environmental impacts. Global Environmental Change, 36, 139–152. https://doi.org/10.1016/j.gloenvcha.2015.12.005
Childers, D. L., Corman, J., Edwards, M., & Elser, J. J. (2011). Sustainability challenges of phosphorus and food: Solutions from closing the human phosphorus cycle. Bioscience, 61(2), 117–124. https://doi.org/10.1525/bio.2011.61.2.6
Choi, S. K., Jeong, J., & Kim, M. K. (2017). Simulating the effects of agricultural management on water quality dynamics in rice paddies for sustainable rice production-model development and validation. Water, 9(11), 869. https://doi.org/10.3390/w9110869
Cordell, D., Drangert, J. O., & White, S. (2009). The story of phosphorus: Global food security and food for thought. Global Environmental Change, 19(2), 292–305. https://doi.org/10.1016/j.gloenvcha.2008.10.009
Del Grosso, S. J., Ojima, D. S., Parton, W. J., Stehfest, E., Heistemann, M., DeAngelo, B., & Rose, S. (2009). Global scale DAYCENT model analysis of greenhouse gas emissions and mitigation strategies for cropped soils. Global and Planetary Change, 67(1–2), 44–50. https://doi.org/ 10.1016/j.gloplacha.2008.12.006
Della Peruta, R., Keller, A., & Schulin, R. (2014). Sensitivity analysis, calibration and validation of EPIC for modelling soil phosphorus dynamics in Swiss agro-ecosystems. Environmental Modelling & Software, 62, 97–111. https://doi.org/10.1016/j.envsoft.2014.08.018
Elser, J., & Bennett, E. (2011). A broken biogeochemical cycle. Nature, 478(7367), 29–31. https://doi.org/10.1038/478029a Filippelli, G. M. (2008). The global phosphorus cycle: Past, present, and future. Elements, 4(2), 89–95. https://doi.org/10.2113/
GSELEMENTS.4.2.89
Gerik T., Williams, J. R., Dagitz, S., Magre, M., Meinardus, A., Steglich, E., et al. (2015). EPIC user’s manual version 0810, Blackland Research and Extension Center, Temple, Texas, US., Temple, Texas.
Goulet, M., Gallichand, J., Duchemin, M., & Giroux, M. (2006). Measured and computed phosphorus losses by runoff and subsurface drainage in eastern Canada. Applied Engineering in Agriculture, 22(2), 203–213. https://doi.org/10.13031/2013.20282
Grizzetti, B., Bouraoui, F., & Aloe, A. (2012). Changes of nitrogen and phosphorus loads to European seas. Global Change Biology, 18(2), 769–782. https://doi.org/10.1111/j.1365-2486.2011.02576.x
Izaurralde, R. C., Williams, J. R., McGill, W. B., Rosenberg, N. J., & Jakas, M. C. Q. (2006). Simulating soil C dynamics with EPIC: Model description and testing against long-term data. Ecological Modelling, 192(3–4), 362–384. https://doi.org/10.1016/j.ecolmodel.2005.07.010
10.1029/2017GB005849
Global Biogeochemical Cycles
Acknowledgments
This study was supported by funding from the Swiss Federal Institute of Aquatic Science and Technology (Eawag) and the World Food System Center at ETH Zürich, Switzerland. W. L. acknowledges the support received from the Early Postdoctoral Mobility Fellowship awarded by Swiss National Science Foundation (P2EZP2_175096) and the Open Fund Research project by the State Key Laboratory of Hydraulics and Mountain River Engineering (Sichuan University) (SKHL1709). We are grateful to Hans W. Paerl from the Institute of Marine Sciences at the University of North Carolina at Chapel Hill and Susan Wang and Jaehak Jeong from the Blackland Research and Extension Center for valuable discus-sions. We are grateful to EarthStat (http://www.earthstat.org/) and Peder Engstrom of the Institute on the Environment at the University of Minnesota for providing the global crop-specific fertilizer data. The authors declare that data supporting the find-ings of this study are available within the article and its supporting informa-tionfiles.
Jones, C. A., Cole, C. V., Sharpley, A. N., & Williams, J. R. (1984). A simplified soil and plant phosphorus model. 1. Documentation. Soil Science Society of America Journal, 48(4), 800–805. https://doi.org/10.2136/sssaj1984.03615995004800040020x
Kahiluoto, H., Kuisma, M., Kuokkanen, A., Mikkilä, M., & Linnanen, L. (2014). Taking planetary nutrient boundaries seriously: Can we feed the people? Global Food Security, 3(1), 16–21. https://doi.org/10.1016/j.gfs.2013.11.002
Kronvang, B., Vagstad, N., Behrendt, H., Bogestrand, J., & Larsen, S. E. (2007). Phosphorus losses at the catchment scale within Europe: An overview. Soil Use and Management, 23(s1), 104–116. https://doi.org/10.1111/j.1475-2743.2007.00113.x
Kvakić, M., Pellerin, S., Ciais, P., Achat, D. L., Augusto, L., Denoroy, P., et al. (2018). Quantifying the limitation to world cereal production due to soil phosphorus status. Global Biogeochemical Cycles, 32, 143–157. https://doi.org/10.1002/2017GB005754
Liu, W., Antonelli, M., Liu, X., & Yang, H. (2017). Towards improvement of grey water footprint assessment: With an illustration for global maize cultivation. Journal of Cleaner Production, 147, 1–9. https://doi.org/10.1016/j.jclepro.2017.01.072
Liu, W., Yang, H., Folberth, C., Wang, X., Luo, Q., & Schulin, R. (2016). Global investigation of impacts of PET methods on simulating crop-water relations for maize. Agricultural and Forest Meteorology, 221, 164–175. https://doi.org/10.1016/j.agrformet.2016.02.017
Liu, W., Yang, H., Liu, J., Azevedo, L. B., Wang, X., Xu, Z., et al. (2016). Global assessment of nitrogen losses and trade-offs with yields from major crop cultivations. Science of the Total Environment, 572, 526–537. https://doi.org/10.1016/j.scitotenv.2016.08.093
Liu, W., Yang, H., Liu, Y., Kummu, M., Hoekstra, A. Y., Liu, J., & Schulin, R. (2018). Water resources conservation and nitrogen pollution reduction under global food trade and agricultural intensification. Science of the Total Environment, 633(C), 1591–1601.
Liu, Y., Villalba, G., Ayres, R. U., & Schroder, H. (2008). Global phosphorusflows and environmental impacts from a consumption perspective. Journal of Industrial Ecology, 12(2), 229–247. https://doi.org/10.1111/j.1530-9290.2008.00025.x
Lun, F., Liu, J., Ciais, P., Nesme, T., Chang, J., Wang, R., et al. (2017). Global and regional phosphorus budgets in agricultural systems and their implications for phosphorus-use efficiency. Earth System Science Data, 10, 1–18. https://doi.org/10.5194/essd-10-1-2018
MacDonald, G. K., Bennett, E. M., Potter, P. A., & Ramankutty, N. (2011). Agronomic phosphorus imbalances across the world’s croplands. Proceedings of the National Academy of Sciences of the United States of America, 108(7), 3086–3091. https://doi.org/10.1073/ pnas.1010808108
Mckay, M. D., Beckman, R. J., & Conover, W. J. (1979). A comparison of three methods for selecting values of input variables in the analysis of output from a computer code. Technometrics, 21, 239–245.
Mekonnen, M. M., & Hoekstra, A. Y. (2017). Global anthropogenic phosphorus loads to fresh water and associated grey water footprints and water pollution levels: A high-resolution global study. Water Resources Research, 54, 345–358. https://doi.org/10.1002/2017WR020448 Mueller, N. D., Gerber, J. S., Johnston, M., Ray, D. K., Ramankutty, N., & Foley, J. A. (2012). Closing yield gaps through nutrient and water
management. Nature, 490(7419), 254–257. https://doi.org/10.1038/nature11420
Müller, C., Elliott, J., Chryssanthacopoulos, J., Arneth, A., Balkovic, J., Ciais, P., et al. (2017). Global gridded crop model evaluation: Benchmarking, skills, deficiencies and implications. Geoscientific Model Development, 10(4), 1403–1422. https://doi.org/10.5194/gmd-10-1403-2017 Nemery, J., & Garnier, J. (2016). Biogeochemistry: The fate of phosphorus. Nature Geoscience, 9(5), 343–344. https://doi.org/10.1038/
ngeo2702
Obersteiner, M., Penuelas, J., Ciais, P., van der Velde, M., & Janssens, I. A. (2013). The phosphorus trilemma. Nature Geoscience, 6(11), 897–898. https://doi.org/10.1038/ngeo1990
Parton, W. J., Schimel, D., Ojima, D., Cole, C. V., Bryant, R., & Arnold, R. (1994). A general model for soil organic matter dynamics: sensitivity to litter chemistry, texture and management, paper presented at Quantitative modeling of soil forming processes: proceedings of a sym-posium sponsored by Divisions S-5 and S-9 of the Soil Science Society of America in Minneapolis, Minnesota, USA, 2 Nov. 1992., Soil Science Society of America Inc.
Peñuelas, J., Poulter, B., Sardans, J., Ciais, P., van der Velde, M., Bopp, L., et al. (2013). Human-induced nitrogen-phosphorus imbalances alter natural and managed ecosystems across the globe. Nature Communications, 4(1), 2934. https://doi.org/10.1038/ncomms3934 Pierson, S. T., Cabrera, M. L., Evanylo, G. K., Schroeder, P. D., Radcliffe, D. E., Kuykendall, H. A., et al. (2001). Phosphorus losses from grasslands
fertilized with broiler litter: EPIC simulations. Journal of Environmental Quality, 30(5), 1790–1795. https://doi.org/10.2134/ jeq2001.3051790x
Portmann, F. T., Siebert, S., & Doll, P. (2010). MIRCA2000—Global monthly irrigated and rainfed crop areas around the year 2000: A new high-resolution data set for agricultural and hydrological modeling. Global Biogeochemical Cycles, 24, GB1011. https://doi.org/10.1029/ 2008GB003435
Porwollik, V., Müller, C., Elliott, J., Chryssanthacopoulos, J., Iizumi, T., Ray, D. K., et al. (2017). Spatial and temporal uncertainty of crop yield aggregations. European Journal of Agronomy, 88, 10–21. https://doi.org/10.1016/j.eja.2016.08.006
Potter, S. R., Andrews, S., Atwood, J. D., Kellogg, R. L., Lemunyon, J., Norfleet, L., & Oman, D. (2006). Model simulation of soil loss, nutrient loss, and change in soil organic carbon associated with crop production, USDA-NRCS.
Powers, S. M., Bruulsema, T. W., Burt, T. P., Chan, N. I., Elser, J. J., Haygarth, P. M., et al. (2016). Long-term accumulation and transport of anthropogenic phosphorus in three river basins. Nature Geoscience, 9(5), 353–356. https://doi.org/10.1038/ngeo2693
Quinton, J. N., Govers, G., Van Oost, K., & Bardgett, R. D. (2010). The impact of agricultural soil erosion on biogeochemical cycling. Nature Geoscience, 3(5), 311–314. https://doi.org/10.1038/ngeo838
Ringeval, B., Augusto, L., Monod, H., van Apeldoorn, D., Bouwman, L., Yang, X., et al. (2017). Phosphorus in agricultural soils: Drivers of its distribution at the global scale. Global Change Biology, 23(8), 3418–3432. https://doi.org/10.1111/gcb.13618
Ringeval, B., Nowak, B., Nesme, T., Delmas, M., & Pellerin, S. (2014). Contribution of anthropogenic phosphorus to agricultural soil fertility and food production. Global Biogeochemical Cycles, 28, 743–756. https://doi.org/10.1002/2014GB004842
Sacks, W. J., Deryng, D., Foley, J. A., & Ramankutty, N. (2010). Crop planting dates: An analysis of global patterns. Global Ecology and Biogeography, 19(5), 607–620.
Sattari, S. Z., Bouwman, A. F., Giller, K. E., & van Ittersum, M. K. (2012). Residual soil phosphorus as the missing piece in the global phosphorus crisis puzzle. Proceedings of the National Academy of Sciences of the United States of America, 109(16), 6348–6353. https://doi.org/10.1073/ pnas.1113675109
Sharpley, A. N., & Villiams, J. R. (1990). EPIC—Erosion/Productivity impact calculator: 1. Model documentation, U.S. Department of Agriculture Technical Bulletin No. 1768.235 pp.
Steffen, W., Richardson, K., Rockstrom, J., Cornell, S. E., Fetzer, I., Bennett, E. M., et al. (2015). Planetary boundaries: Guiding human devel-opment on a changing planet. Science, 347(6223), 1259855. https://doi.org/10.1126/science.1259855
Steglich E. M., Jeong, J., & Williams, J. R. (2016). Apex user’s manual version 1501, Blackland research and Extension Center, Temple, Texas, US., Temple, Texas.
Sutton, M. A., Bleeker, A., Howard, C. M., Bekunda, M., Grizzetti, B., de Vries, W., et al. (2013). Our nutrient world: The challenge to produce more food and energy with less pollution. Edinburgh, UK: Centre for Ecology and Hydrology (CEH).
Tan, C. S., & Zhang, T. Q. (2011). Surface runoff and sub-surface drainage phosphorus losses under regular free drainage and controlled drainage with sub-irrigation systems in southern Ontario. Canadian Journal of Soil Science, 91(3), 349–359. https://doi.org/10.4141/ cjss09086
Ulén, B., Bechmann, M., Folster, J., Jarvie, H. P., & Tunney, H. (2007). Agriculture as a phosphorus source for eutrophication in the north-west European countries, Norway, Sweden, United Kingdom and Ireland: A review. Soil Use and Management, 23(s1), 5–15. https://doi.org/ 10.1111/j.1475-2743.2007.00115.x
Van Vuuren, D. P., Bouwman, A. F., & Beusen, A. H. W. (2010). Phosphorus demand for the 1970–2100 period: A scenario analysis of resource depletion. Global Environmental Change, 20(3), 428–439. https://doi.org/10.1016/j.gloenvcha.2010.04.004
Vuorenmaa, J., Rekolainen, S., Lepisto, A., Kenttamies, K., & Kauppila, P. (2002). Losses of nitrogen and phosphorus from agricultural and forest areas in Finland during the 1980s and 1990s. Environmental Monitoring and Assessment, 76(2), 213–248. https://doi.org/10.1023/ A:1015584014417
Wang, X., Williams, J. R., Gassman, P. W., Baffaut, C., Izaurralde, R. C., Jeong, J., & Kiniry, J. R. (2012). EPIC and APEX: Model use, calibration, and validation. Transactions of the ASABE, 55(4), 1447–1462. https://doi.org/10.13031/2013.42253
Weedon, G. P., Balsamo, G., Bellouin, N., Gomes, S., Best, M. J., & Viterbo, P. (2014). The WFDEI meteorological forcing data set: WATCH forcing data methodology applied to ERA-Interim reanalysis data. Water Resources Research, 50, 7505–7514. https://doi.org/10.1002/ 2014WR015638
West, P. C., Gerber, J. S., Engstrom, P. M., Mueller, N. D., Brauman, K. A., Carlson, K. M., et al. (2014). Leverage points for improving global food security and the environment. Science, 345(6194), 325–328. https://doi.org/10.1126/science.1246067
Williams, J. R. (1995). The EPIC model. In V. P. Singh (Ed.), Computer models of watershed hydrology (pp. 909–1000). Highlands Ranch, CO: Water Resources Publications.
Williams, J. R., Jones, C. A., & Dyke, P. T. (1984). A modeling approach to determining the relationship between erosion and soil productivity. Transactions of the ASABE, 27(1), 0129–0144. https://doi.org/10.13031/2013.32748
Williams, J. W., Izaurralde, R. C., & Steglich, E. M. (2008). Agricultural Policy/Environmental eXtender model theoretical documentation. Texas, US: Blackland research and Extension Center, Temple.
Yang, J., Reichert, P., Abbaspour, K. C., Xia, J., & Yang, H. (2008). Comparing uncertainty analysis techniques for a SWAT application to the Chaohe Basin in China. Journal of Hydrology, 358(1-2), 1–23. https://doi.org/10.1016/j.jhydrol.2008.05.012
Yuan, Z., Jiang, S., Sheng, H., Liu, X., Hua, H., Liu, X., & Zhang, Y. (2018). Human perturbation of the global phosphorus cycle: Changes and consequences. Environmental Science & Technology, 52(5), 2438–2450. https://doi.org/10.1021/acs.est.7b03910
Zaehle, S., Sitch, S., Smith, B., & Hatterman, F. (2005). Effects of parameter uncertainties on the modeling of terrestrial biosphere dynamics. Global Biogeochemical Cycles, 19, GB3020. https://doi.org/10.1029/2004GB002395
Zhang, J., Beusen, A. H. W., Van Apeldoorn, D. F., Mogollon, J. M., Yu, C. Q., & Bouwman, A. F. (2017). Spatiotemporal dynamics of soil phosphorus and crop uptake in global cropland during the 20th century. Biogeosciences, 14(8), 2055–2068. https://doi.org/10.5194/bg-14-2055-2017